The Opposite of a Cowboy—Nelson on CTSIX’s Calculated Path to 63% 2020 Return and What’s Ahead
January 12, 2021
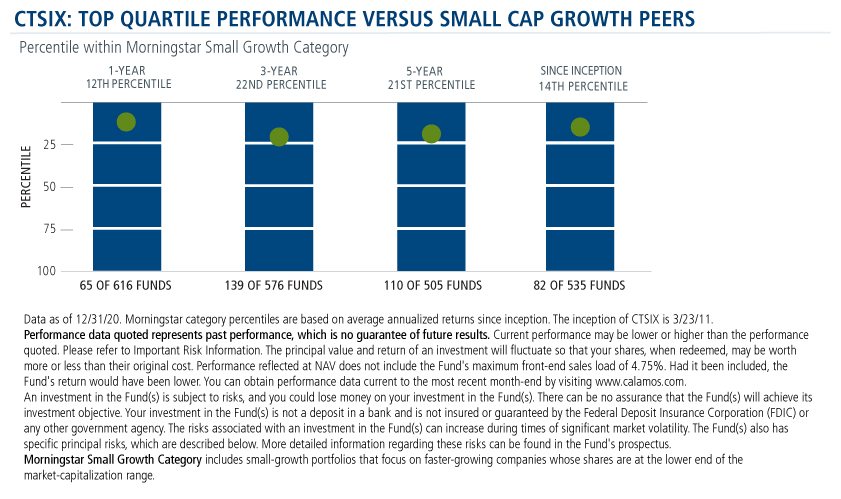
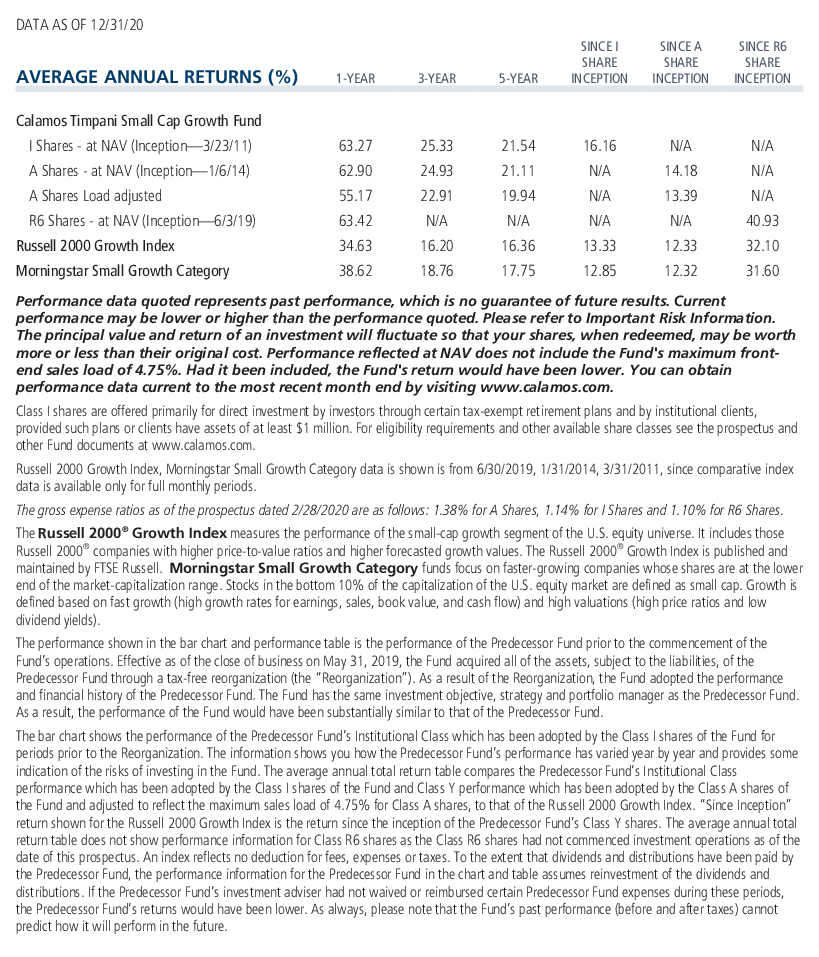
Whatever you do, don’t call our small cap portfolio manager—whose fund in 2020 returned 63.27% versus the Russell 2000 Growth’s 34.63% return—a cowboy.
“Diversification drove our return. It wasn’t us being reckless with a sector weight or an individual stock,” says Brandon M. Nelson, Senior Portfolio Manager of Calamos Timpani Small Cap Growth Fund (CTSIX). “Ours is a very calculated, risk-sensitive approach to managing the portfolios. It wasn’t us being cowboys, shooting for the moon, and hoping it went our way. It was us being very calculated in our approach.”
Standard Deviation: CTSIX vs. Category Peers and Index
As of 12/31/20
| CTSIX | Morningstar Small Growth Category | Russell 2000 Growth | |
|---|---|---|---|
| 3-year | 25.62 | 25.25 | 25.46 |
| 5-year | 21.64 | 21.13 | 21.46 |
Source: Morningstar.com
Nelson offers three proof points:
- While the technology sector was a significant source of relative outperformance, it was not the only contributor. CTSIX added value in 10 out of 11 sectors.
- Seventeen holdings each contributed at least 100 basis points of relative outperformance while just two stocks were 100-plus basis point losers. A total of 33 holdings each contributed at least 50 basis points of relative outperformance.
- The fund’s standard deviation is largely in line with the Morningstar category and benchmark average.
These achievements are the result of a process that Nelson simplifies as “we have been good at finding big winners and sticking with them, and we have also been good at damage control and reducing exposure quickly to losing situations.”
CTSIX’s 2020 outperformance started early in 2020 (see this post), well before the small cap rally in the fall. Looking ahead, Nelson is positive on the prospects this year for small caps as a whole and for his fund in particular.
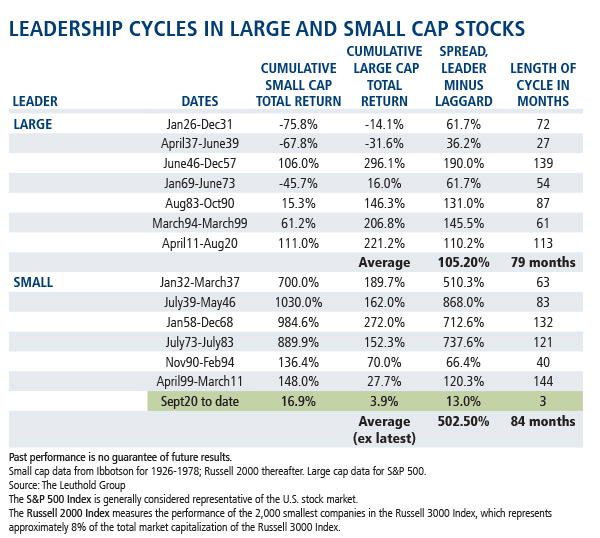
Small caps may be just getting started, based on historical data Nelson cites. When small caps have led, they’ve led big and they’ve led for an extended period of time—an average of 84 months and historically never less than 40 months, according to the Leuthold Group.
The historical performance track record for CTSIX isn’t quite as long but it’s consistent with the theme.
The chart below shows four corrections in the S&P 500 since the fund’s inception, and the table below compares CTSIX’s one-year performance from exactly where we are now—nine months after the bottom—to both the Russell 2000 Growth Index and the S&P 500.
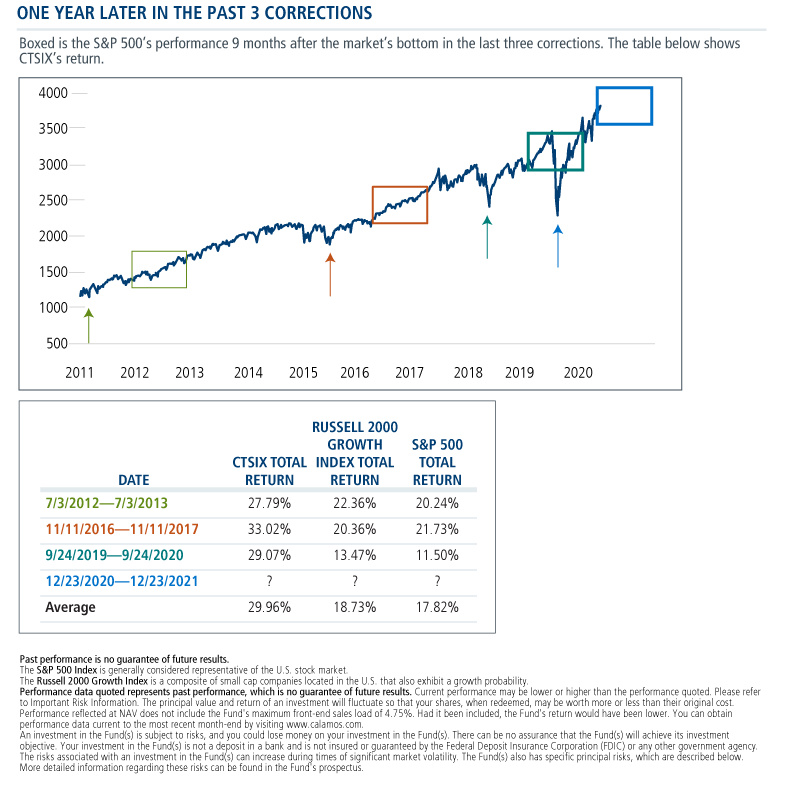
The average return of the previous three corrections is 29.96%, better than the index by 1100 basis points on average. It’s also significantly higher than the S&P 500’s return in those years.
“Investment professionals look at what the fund did in 2020 and wonder if they ‘missed it.’ Well, in the last three times this happened, you wouldn’t have missed it. You would have had another 30% in front of you,” says Nelson. “This is strong outperformance, in absolute and relative terms and, by the way, a lot better than your S&P 500 index fund.”
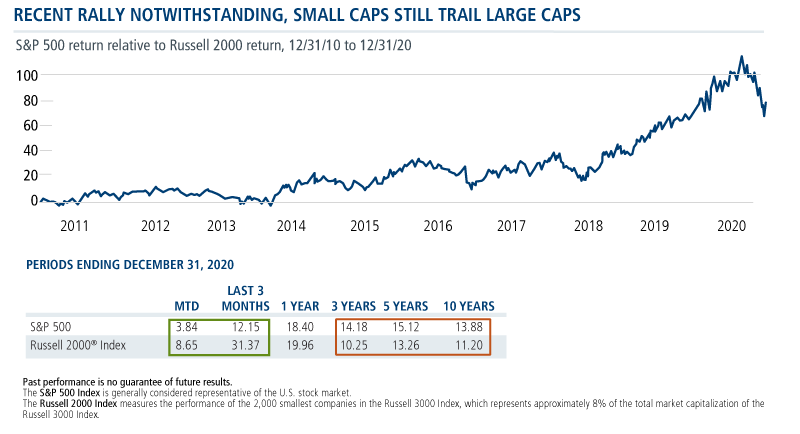
The chart below is a 10-year look at large cap versus small cap performance. When the line is going up, large stocks are beating the smaller. The opposite is true when the line is going down. Small caps have been winning recently but see how far it is from the baseline, Nelson says. Small caps have some catching up to do.
Finally, while much has been made of small caps’ move late last year, Nelson comments on the valuations of Russell 2000 stocks versus the larger stocks of the Russell 1000.
“Even after November, which was the biggest gain for the Russell 2000 in its existence, and even after December," Nelson notes, "valuations have moved to only the 31st percentile.”
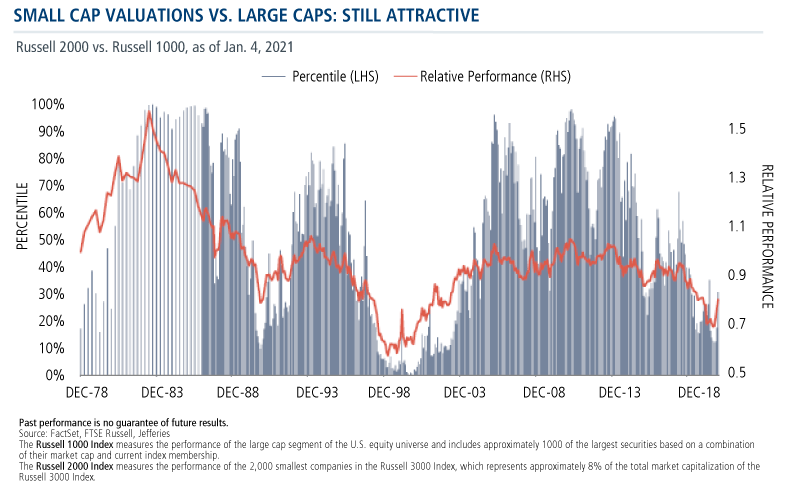
“There’s a long way to go to get back to parity,” he concludes, adding that the fundamentals continue to suggest that the small cap rally is sustainable (see related post).
Investment professionals, for more information about CTSIX and Nelson’s optimism about 2021, contact your Calamos Investment Consultant at 888-571-2567 or caminfo@calamos.com.
Before investing, carefully consider the fund’s investment objectives, risks, charges and expenses. Please see the prospectus and summary prospectus containing this and other information which can be obtained by calling 1-866-363-9219. Read it carefully before investing.
Opinions and estimates offered constitute our judgment and are subject to change without notice, as are statements of financial market trends, which are based on current market conditions. We believe the information provided here is reliable, but do not warrant its accuracy or completeness. This material is not intended as an offer or solicitation for the purchase or sale of any financial instrument. The views and strategies described may not be suitable for all investors. This material has been prepared for informational purposes only, and is not intended to provide, and should not be relied on for, accounting, legal or tax advice. References to future returns are not promises or even estimates of actual returns a client portfolio may achieve. Any forecasts contained herein are for illustrative purposes only and are not to be relied upon as advice or interpreted as a recommendation. References to specific securities, asset classes and financial markets are for illustrative purposes only and are not intended to be, and should not be interpreted as, recommendations.
Important Risk Information. An investment in the Fund(s) is subject to risks, and you could lose money on your investment in the Fund(s). There can be no assurance that the Fund(s) will achieve its investment objective. Your investment in the Fund(s) is not a deposit in a bank and is not insured or guaranteed by the Federal Deposit Insurance Corporation (FDIC) or any other government agency. The risks associated with an investment in the Fund(s) can increase during times of significant market volatility. The Fund(s) also has specific principal risks, which are described below. More detailed information regarding these risks can be found in the Fund's prospectus.
The principal risks of investing in the Calamos Timpani Small Cap Growth Fund include: equity securities risk consisting of market prices declining in general, growth stock risk consisting of potential increased volatility due to securities trading at higher multiples, and portfolio selection risk. The Fund invests in small capitalization companies, which are often more volatile and less liquid than investments in larger companies. As a result of political or economic instability in foreign countries, there can be special risks associated with investing in foreign securities, including fluctuations in currency exchange rates, increased price volatility and difficulty obtaining information. In addition, emerging markets may present additional risk due to potential for greater economic and political instability in less developed countries.
The S&P 500 Index is generally considered representative of the U.S. stock market.
Morningstar Small Growth Category includes small-growth portfolios that focus on faster-growing companies whose shares are at the lower end of the market-capitalization range.
The Russell 1000 Index measures the performance of the large cap segment of the U.S. equity universe and includes approximately 1000 of the largest securities based on a combination of their market cap and current index membership.
The Russell 2000 Index measures the performance of the 2,000 smallest companies in the Russell 3000 Index, which represents approximately 8% of the total market capitalization of the Russell 3000 Index.
Standard deviation is a measure of volatility.
802289 121
Archived material may contain dated performance, risk and other information. Current performance may be lower or higher than the performance quoted in the archived material. For the most recent month-end fund performance information visit www.calamos.com. Archived material may contain dated opinions and estimates based on our judgment and are subject to change without notice, as are statements of financial market trends, which are based on current market conditions at the time of publishing. We believed the information provided here was reliable, but do not warrant its accuracy or completeness. This material is not intended as an offer or solicitation for the purchase or sale of any financial instrument. The views and strategies described may not be suitable for all investors. This material has been prepared for informational purposes only, and is not intended to provide, and should not be relied on for, accounting, legal or tax advice. References to future returns are not promises or even estimates of actual returns a client portfolio may achieve. Any forecasts contained herein are for illustrative purposes only and are not to be relied upon as advice or interpreted as a recommendation.
Performance data quoted represents past performance, which is no guarantee of future results. Current performance may be lower or higher than the performance quoted. The principal value and return of an investment will fluctuate so that your shares, when redeemed, may be worth more or less than their original cost. Performance reflected at NAV does not include the Fund’s maximum front-end sales load. Had it been included, the Fund’s return would have been lower.
Archived on January 12, 2022