Microcap Tailwind Lifted CTSIX, Rewarded Style Consistency
June 26, 2020
The smaller the company, the better the performer.
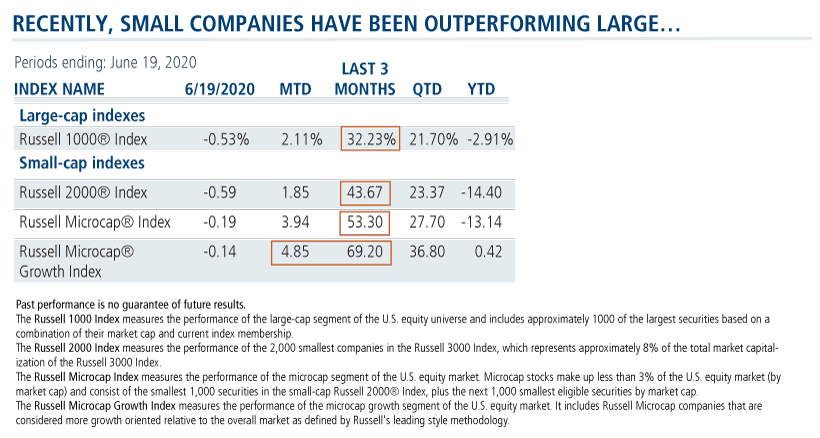
While that hasn’t been true for years, here’s some fresh data we believe suggests that a reversion to mean is underway. The Russell 1000 has had a strong run in the last three months with a 32% return (see chart below). But that fell short of the Russell 2000’s 44% gain.
And, what’s even more intriguing is that over the same time period, the Russell Microcap Index (tracking companies with $1 billion or less in market capitalization) is ahead 53% and the Russell Microcap Growth Index up 69%.
Through June 19, small cap performance in June was similar to large caps, but the microcaps continued to work well, especially microcap growth.
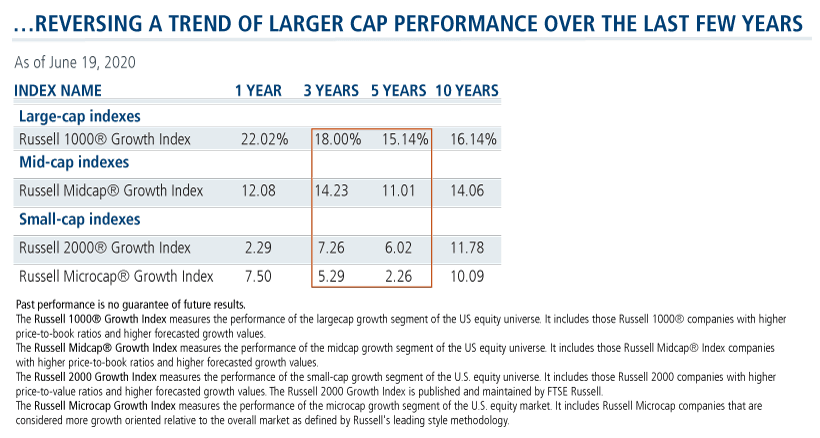
This short-term trend is reversing what’s been true of the last several years—when the smaller the company, the greater the magnitude of underperformance.
And, it’s consistent with the start of a market rotation that Calamos Senior Portfolio Manager Brandon Nelson has been on the lookout for.
Nelson is expecting small caps to perform what has been their historical role: to lead the market out of recession. The first 12 months of a new bull market following an economic downturn have historically involved significant outperformance by small caps. (See this April post.) While acknowledging the recent microcap rally, Nelson believes further mean reversion is possible.
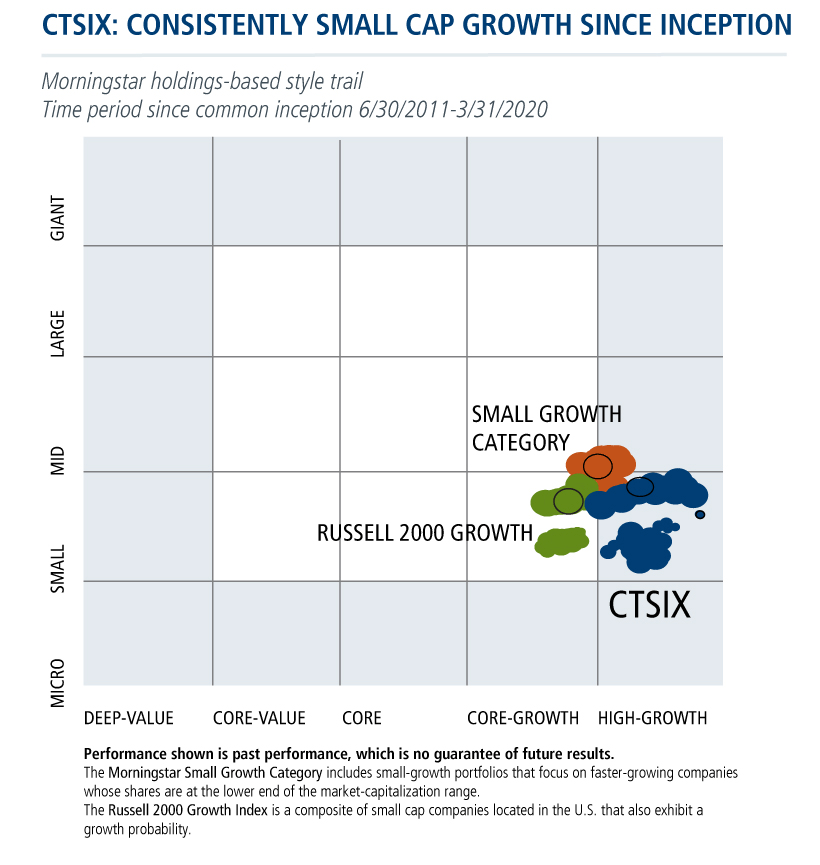
To be sure, this recent outperformance by “the smallest of the small” has been a tailwind on an absolute and relative basis for the Calamos Timpani Small Cap Growth Fund (CTSIX). At the end of May, microcaps represented more than 21% of the CTSIX portfolio versus the Russell 2000 Growth’s 14.5%. The team’s internal attribution analysis confirms that the microcaps have generated significant outperformance relative to the index, Nelson says.
But he describes the macro size tailwind as “just an additional layer of strength.” Even in recent weeks, he says, the team’s stock selection—independent of company size—has been the bigger driver of returns.
“In other words,” he says, “we haven't needed small caps and microcaps to win for the fund to win on a relative basis. Before small caps started to lead, we’ve been successful at finding company-specific winning situations that added value.” (See How CTSIX’s Active Management Provided a 776bps Advantage in a Deep Down Quarter for Small Cap Growth.)
Nelson continues to refer to the low asset size of the fund as an advantage relative to its peers. For CTSIX, its size has afforded a nimbleness that’s enabled the team to explore names further down the market cap spectrum where they find security pricing less efficient. At the same time, the fund has remained faithful to its Small Cap Growth style.
This is in contrast to larger funds that, in part due to liquidity restrictions, have drifted toward mid-cap companies as they’ve grown in recent years. “If the market continues to favor the small, such a mid-cap tilt could have performance implications,” Nelson says.
Investment professionals, for more about small cap growth or CTSIX, contact your Calamos Investment Consultant at 888-571-2567 or caminfo@calamos.com.
Before investing, carefully consider the fund’s investment objectives, risks, charges and expenses. Please see the prospectus and summary prospectus containing this and other information which can be obtained by calling 1-866-363-9219. Read it carefully before investing.
Opinions are subject to change due to changes in the market, economic conditions or changes in the legal and/or regulatory environment and may not necessarily come to pass. This information is provided for informational purposes only and should not be considered tax, legal, or investment advice. References to specific securities, asset classes and financial markets are for illustrative purposes only and are not intended to be, and should not be interpreted as, recommendations.
Important Risk Information. An investment in the Fund(s) is subject to risks, and you could lose money on your investment in the Fund(s). There can be no assurance that the Fund(s) will achieve its investment objective. Your investment in the Fund(s) is not a deposit in a bank and is not insured or guaranteed by the Federal Deposit Insurance Corporation (FDIC) or any other government agency. The risks associated with an investment in the Fund(s) can increase during times of significant market volatility. The Fund(s) also has specific principal risks, which are described below. More detailed information regarding these risks can be found in the Fund's prospectus.
The principal risks of investing in the Calamos Timpani Small Cap Growth Fund include: equity securities risk consisting of market prices declining in general, growth stock risk consisting of potential increased volatility due to securities trading at higher multiples, and portfolio selection risk. The Fund invests in small capitalization companies, which are often more volatile and less liquid than investments in larger companies. As a result of political or economic instability in foreign countries, there can be special risks associated with investing in foreign securities, including fluctuations in currency exchange rates, increased price volatility and difficulty obtaining information. In addition, emerging markets may present additional risk due to potential for greater economic and political instability in less developed countries.
The opinions referenced are as of the date of publication and are subject to change due to changes in the market or economic conditions and may not necessarily come to pass. Information contained herein is for informational purposes only and should not be considered investment advice.
The Russell 1000 Index measures the performance of the large cap segment of the U.S. equity universe and includes approximately 1000 of the largest securities based on a combination of their market cap and current index membership.
The Russell 2000 Index measures the performance of the 2,000 smallest companies in the Russell 3000 Index, which represents approximately 8% of the total market capitalization of the Russell 3000 Index.
The Russell Microcap Index measures the performance of the microcap segment of the U.S. equity market. Microcap stocks make up less than 3% of the U.S. equity market (by market cap) and consist of the smallest 1,000 securities in the small-cap Russell 2000® Index, plus the next 1,000 smallest eligible securities by market cap.
The Russell Microcap Growth Index measures the performance of the microcap growth segment of the U.S. equity market. It includes Russell Microcap companies that are considered more growth oriented relative to the overall market as defined by Russell's leading style methodology.
The Russell 1000® Growth Index measures the performance of the large cap growth segment of the U.S. equity universe. It includes those Russell 1000® companies with higher price-to-book ratios and higher forecasted growth values.
The Russell Midcap® Growth Index measures the performance of the midcap growth segment of the U.S. equity universe. It includes those Russell Midcap® Index companies with higher price-to-book ratios and higher forecasted growth values.
The Russell 2000 Growth Index measures the performance of the small-cap growth segment of the U.S. equity universe. It includes those Russell 2000 companies with higher price-to-value ratios and higher forecasted growth values. The Russell 2000 Growth Index is published and maintained by FTSE Russell.
802058 0620
Archived material may contain dated performance, risk and other information. Current performance may be lower or higher than the performance quoted in the archived material. For the most recent month-end fund performance information visit www.calamos.com. Archived material may contain dated opinions and estimates based on our judgment and are subject to change without notice, as are statements of financial market trends, which are based on current market conditions at the time of publishing. We believed the information provided here was reliable, but do not warrant its accuracy or completeness. This material is not intended as an offer or solicitation for the purchase or sale of any financial instrument. The views and strategies described may not be suitable for all investors. This material has been prepared for informational purposes only, and is not intended to provide, and should not be relied on for, accounting, legal or tax advice. References to future returns are not promises or even estimates of actual returns a client portfolio may achieve. Any forecasts contained herein are for illustrative purposes only and are not to be relied upon as advice or interpreted as a recommendation.
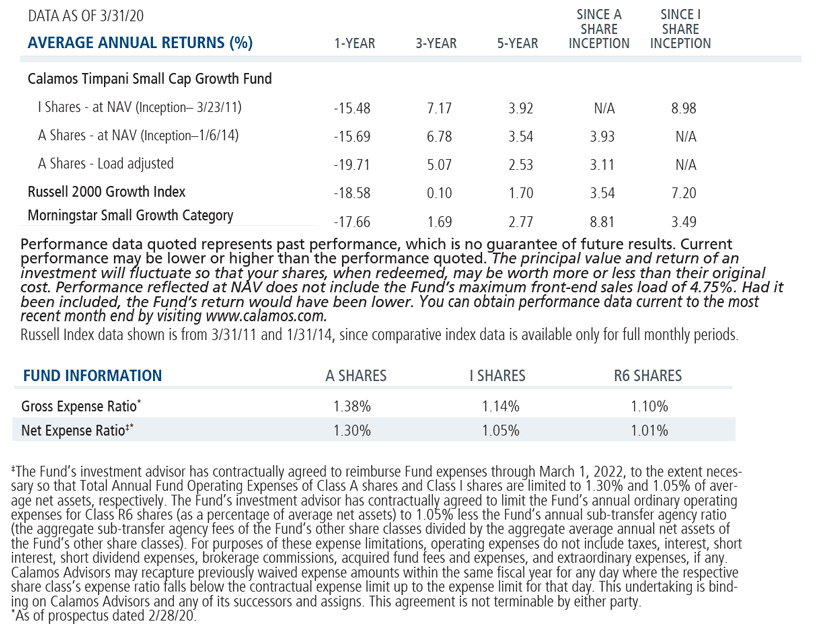
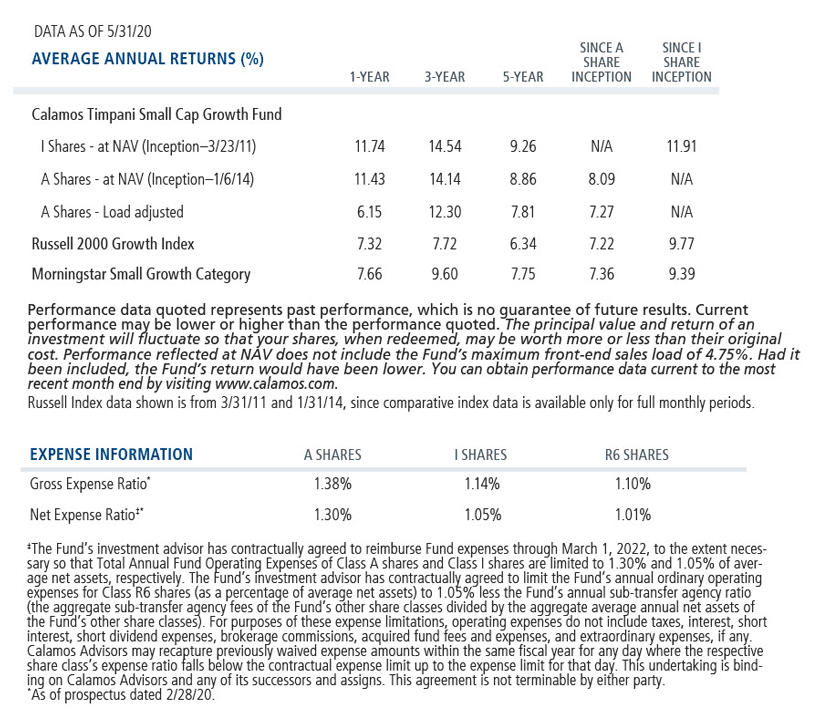
Performance data quoted represents past performance, which is no guarantee of future results. Current performance may be lower or higher than the performance quoted. The principal value and return of an investment will fluctuate so that your shares, when redeemed, may be worth more or less than their original cost. Performance reflected at NAV does not include the Fund’s maximum front-end sales load. Had it been included, the Fund’s return would have been lower.
Archived material may contain dated performance, risk and other information. Current performance may be lower or higher than the performance quoted in the archived material. For the most recent month-end fund performance information visit www.calamos.com. Archived material may contain dated opinions and estimates based on our judgment and are subject to change without notice, as are statements of financial market trends, which are based on current market conditions at the time of publishing. We believed the information provided here was reliable, but do not warrant its accuracy or completeness. This material is not intended as an offer or solicitation for the purchase or sale of any financial instrument. The views and strategies described may not be suitable for all investors. This material has been prepared for informational purposes only, and is not intended to provide, and should not be relied on for, accounting, legal or tax advice. References to future returns are not promises or even estimates of actual returns a client portfolio may achieve. Any forecasts contained herein are for illustrative purposes only and are not to be relied upon as advice or interpreted as a recommendation.
Performance data quoted represents past performance, which is no guarantee of future results. Current performance may be lower or higher than the performance quoted. The principal value and return of an investment will fluctuate so that your shares, when redeemed, may be worth more or less than their original cost. Performance reflected at NAV does not include the Fund’s maximum front-end sales load. Had it been included, the Fund’s return would have been lower.
Archived on June 26, 2021