Proven Correct So Far This Year, CTSIX Bullishness Continues
August 13, 2020
On August 5, Calamos hosted a Small Cap Growth Review and Outlook with Brandon Nelson, CFA, Senior Vice President and Senior Portfolio Manager of the Calamos Timpani Small Cap Growth Fund (CTSIX). To listen to the call in its entirety, go to www.calamos.com/CIOsmallcap-8-5
Calamos Senior Portfolio Manager Brandon Nelson acknowledges the seeming disconnect between the stock market’s “relentless tear” higher since the March lows and the uncertainty related to COVID-19, the state of the overall economy, the upcoming elections, and above-average equity valuations.
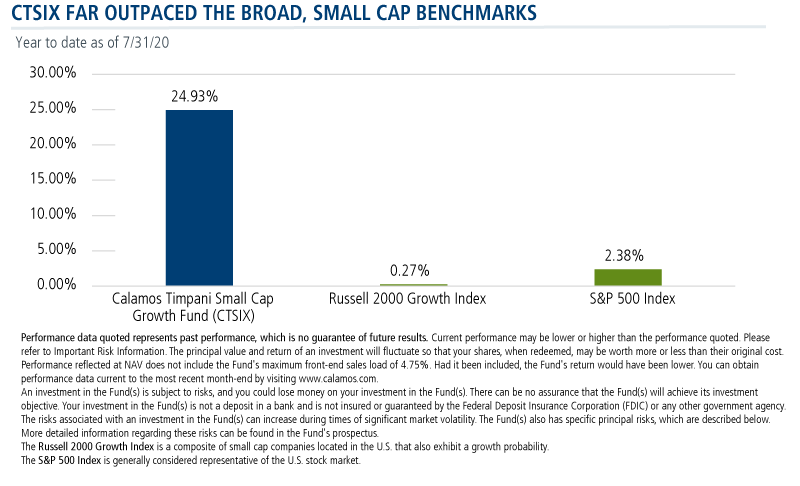
Nonetheless, Nelson last week told a group of investment professionals that he expects equities to keep rising (listen to call replay). As the leader of the Calamos Timpani Small Cap Growth Fund (CTSIX) team, Nelson has been more bullish than most since mid-March. This positioning has contributed to the towering difference between the fund’s performance and both the S&P 500 and the Russell 2000 Growth year to date through July 31.
Nelson believes the U.S. economy is coming out of a recession and is in the early stages of a new bull market—a period when small caps perform especially well. He offered these four arguments:
- The stimulus is here to stay. Federal Reserve Chairman Jay Powell’s commitment to significant monetary stimulus over the short and intermediate term means “low rates for longer, which means high valuations—and possibly much higher valuations are justified,” said Nelson.
-
Earnings are improving at a faster pace than expected. Analyst estimates were slashed after COVID-19 concerns surfaced in late February, and expectations collapsed in March and April. During the downturn, management teams cut costs and became more efficient. Since the economic bottom in April, revenues have climbed but earnings have ramped up meaningfully higher, especially relative to expectations.
“This earnings season a larger percentage of companies are exceeding earnings expectations and by a larger magnitude than normal,” Nelson noted. “The stock market wisely anticipated this, and so did we when we forecasted this exact scenario a few months ago.” (Read highlights of Nelson’s remarks on our April CIO conference call.) -
The upcoming elections in November won’t necessarily interrupt the stock market’s momentum. Nelson commented on the impact of the Democrats winning both the White House and Congress.
“There’s concern that the Trump administration corporate tax cuts would be undone, which all else being equal, would cut S&P 500 earnings estimates. This scenario is entirely possible,” he acknowledged.
However, Nelson urged investment professionals to consider the timing. “With unemployment so high, the economy is still fragile. Thus, logic would suggest tax hikes would likely be pushed out to maybe 2023. If that’s the case, the stock market wouldn’t likely reflect this concern until 2022. Again, this all assumes a Democratic sweep, which is not a given,” said Nelson.
-
Comparisons of today’s valuations to 1999/2000 are “misplaced.” In March 2000, the 2001 P/E multiple of the S&P 500 was about 25 times. Today the forward multiple is about 20 times consensus estimates.
What’s more, Nelson believes those forward estimates are too low. “If they were true, then the E portion of the P/E ratio is higher, making the actual P/E ratio lower than 20 times.
“It’s the same story with forward sales multiple estimates,” he continued. “At the March 2000 peak, the average forward sales multiple of the top five weighted S&P 500 stocks was 10x. That's 10 times the 2001 sales estimates at that time. Today the average forward sales multiple of the top five weighted S&P 500 stocks is just under 6x.”
Further, he noted that interest rates are significantly lower than where they were 20 years ago, which he says justifies today's higher valuations.
Valuation Expansion for Secular Growth
Having made the macro case for equities in general, Nelson also provided a CTSIX update. The small cap valuation case is even more compelling, he said. For more than 3.5 years, small caps have underperformed large caps and, as a result, currently trade at a significant discount relative to historical norms (see related post).
“Low interest rates for longer also can mean potentially more valuation expansion for long duration stocks like many secular growth companies,” said Nelson.
He expressed enthusiasm for the small cap growth opportunities the team is finding across several sectors.
Secular themes include healthcare, ecommerce, cloud-based communications, and software security, all of whose growth has accelerated since COVID-19 hit the United States. Other themes relate to consumer discretionary stocks that are benefiting from changes in consumer behavior.
“For instance, one emerging trend we see is that consumers are spending more time outdoors, in safe, less crowded settings. Families are still going on vacation but instead of flying to theme parks, they are renting or buying RVs and are choosing to go camping, fishing or boating. We own stocks like Sportsman’s Warehouse, Thor Industries, and OneWater Marine as ways to get exposure to this theme.
“Another trend we see,” he continued “is that consumers are moving from cities to suburbs. They want to be in less crowded and less expensive downtown locations, especially if they now have more flexibility to work from home. This, along with exceptionally low mortgage rates, is providing a boost to several companies including certain home builders, building products companies, and residential real estate brokers. We own stocks like LGI Homes, TopBuild and Redfin as ways to get exposure to this theme.”
Investment professionals, for more on CTSIX, listen to the call replay, read the latest quarterly commentary or contact your Calamos Investment Consultant at 888-571-2567 or caminfo@calamos.com.
Before investing, carefully consider the fund’s investment objectives, risks, charges and expenses. Please see the prospectus and summary prospectus containing this and other information which can be obtained by calling 1-866-363-9219. Read it carefully before investing.
Top 10 Holdings
As of 6/30/20
| Company | Sector | % |
|---|---|---|
| Ringcentral, Inc. - Class A | Information Technology | 2.8% |
| GAN, Ltd. | Consumer Discretionary | 2.5% |
| Palomar Holdings, Inc. | Financials | 2.4% |
| Lithia Motors, Inc. - Class A | Consumer Discretionary | 2.4% |
| Generac Holdings, Inc. | Industrials | 2.2% |
| TopBuild Corp. | Consumer Discretionary | 2.2% |
| Zynex, Inc. | Health Care | 2.1% |
| Redfin Corp. | Real Estate | 2.0% |
| Advanced Drainage Systems, Inc. | Industrials | 1.7% |
| Inspire Medical Systems, Inc. | Health Care | 1.7% |
| Total | 22.0% |
Opinions are subject to change due to changes in the market, economic conditions or changes in the legal and/or regulatory environment and may not necessarily come to pass. This information is provided for informational purposes only and should not be considered tax, legal, or investment advice. References to specific securities, asset classes and financial markets are for illustrative purposes only and are not intended to be, and should not be interpreted as, recommendations.
Important Risk Information. An investment in the Fund(s) is subject to risks, and you could lose money on your investment in the Fund(s). There can be no assurance that the Fund(s) will achieve its investment objective. Your investment in the Fund(s) is not a deposit in a bank and is not insured or guaranteed by the Federal Deposit Insurance Corporation (FDIC) or any other government agency. The risks associated with an investment in the Fund(s) can increase during times of significant market volatility. The Fund(s) also has specific principal risks, which are described below. More detailed information regarding these risks can be found in the Fund's prospectus.
The principal risks of investing in the Calamos Timpani Small Cap Growth Fund include: equity securities risk consisting of market prices declining in general, growth stock risk consisting of potential increased volatility due to securities trading at higher multiples, and portfolio selection risk. The Fund invests in small capitalization companies, which are often more volatile and less liquid than investments in larger companies. As a result of political or economic instability in foreign countries, there can be special risks associated with investing in foreign securities, including fluctuations in currency exchange rates, increased price volatility and difficulty obtaining information. In addition, emerging markets may present additional risk due to potential for greater economic and political instability in less developed countries.
The S&P 500 Index is generally considered representative of the U.S. stock market.
The Russell 2000 Growth Index is a composite of small cap companies located in the U.S. that also exhibit a growth probability.
Morningstar Small Growth Category includes small-growth portfolios that focus on faster-growing companies whose shares are at the lower end of the market-capitalization range.
Price/Earnings Ratio Is the current stock price over trailing 12-month earnings per share.
802105 820
Archived material may contain dated performance, risk and other information. Current performance may be lower or higher than the performance quoted in the archived material. For the most recent month-end fund performance information visit www.calamos.com. Archived material may contain dated opinions and estimates based on our judgment and are subject to change without notice, as are statements of financial market trends, which are based on current market conditions at the time of publishing. We believed the information provided here was reliable, but do not warrant its accuracy or completeness. This material is not intended as an offer or solicitation for the purchase or sale of any financial instrument. The views and strategies described may not be suitable for all investors. This material has been prepared for informational purposes only, and is not intended to provide, and should not be relied on for, accounting, legal or tax advice. References to future returns are not promises or even estimates of actual returns a client portfolio may achieve. Any forecasts contained herein are for illustrative purposes only and are not to be relied upon as advice or interpreted as a recommendation.
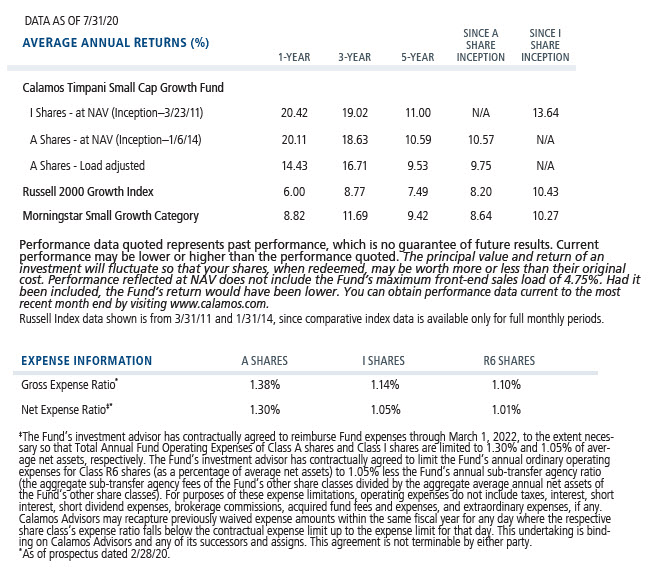
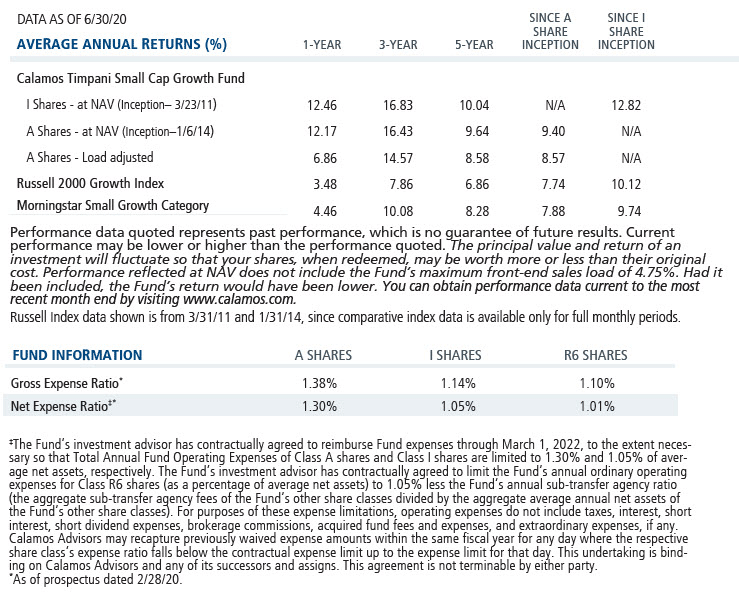
Performance data quoted represents past performance, which is no guarantee of future results. Current performance may be lower or higher than the performance quoted. The principal value and return of an investment will fluctuate so that your shares, when redeemed, may be worth more or less than their original cost. Performance reflected at NAV does not include the Fund’s maximum front-end sales load. Had it been included, the Fund’s return would have been lower.
Archived material may contain dated performance, risk and other information. Current performance may be lower or higher than the performance quoted in the archived material. For the most recent month-end fund performance information visit www.calamos.com. Archived material may contain dated opinions and estimates based on our judgment and are subject to change without notice, as are statements of financial market trends, which are based on current market conditions at the time of publishing. We believed the information provided here was reliable, but do not warrant its accuracy or completeness. This material is not intended as an offer or solicitation for the purchase or sale of any financial instrument. The views and strategies described may not be suitable for all investors. This material has been prepared for informational purposes only, and is not intended to provide, and should not be relied on for, accounting, legal or tax advice. References to future returns are not promises or even estimates of actual returns a client portfolio may achieve. Any forecasts contained herein are for illustrative purposes only and are not to be relied upon as advice or interpreted as a recommendation.
Performance data quoted represents past performance, which is no guarantee of future results. Current performance may be lower or higher than the performance quoted. The principal value and return of an investment will fluctuate so that your shares, when redeemed, may be worth more or less than their original cost. Performance reflected at NAV does not include the Fund’s maximum front-end sales load. Had it been included, the Fund’s return would have been lower.
Archived on August 13, 2021