Managing Risk and Preserving Capital During the Drawdown and Q1: How Calamos Funds Outperformed
April 13, 2020
Now, that was a quarter that won’t soon be forgotten. The 11-year bull market in stocks came to a crashing end starting on February 20, adding to the anxiety of investors already concerned about the spreading COVID-19 pandemic.
The first quarter of 2020 will be remembered for its history-making:
- The S&P 500 corrected in the fewest days ever and then went on to fall a full 20% in the fastest bull market to bear market transition on record.
- Prior to the correction and then crash, the S&P 500 made 13 all-time closing highs over the first 33 days of the year.
- Losses on three days in the quarter ranked them among the 20 largest percentage losses in the history of the S&P.
- Gains on two days in the quarter ranked them among the 10 largest percentage gains in the history of the S&P.
- Twenty-two days in seven weeks saw the S&P move plus or minus 3%, shattering a November 2008 record, which itself broke an October 1932 record.
- In one week (March 25) investors were motivated to move a record $258.9 billion into money market funds.
- Q1 2020 was the first negative quarter since 2008 and just the eighth negative first quarter of the year in the S&P’s 63-year-old history.
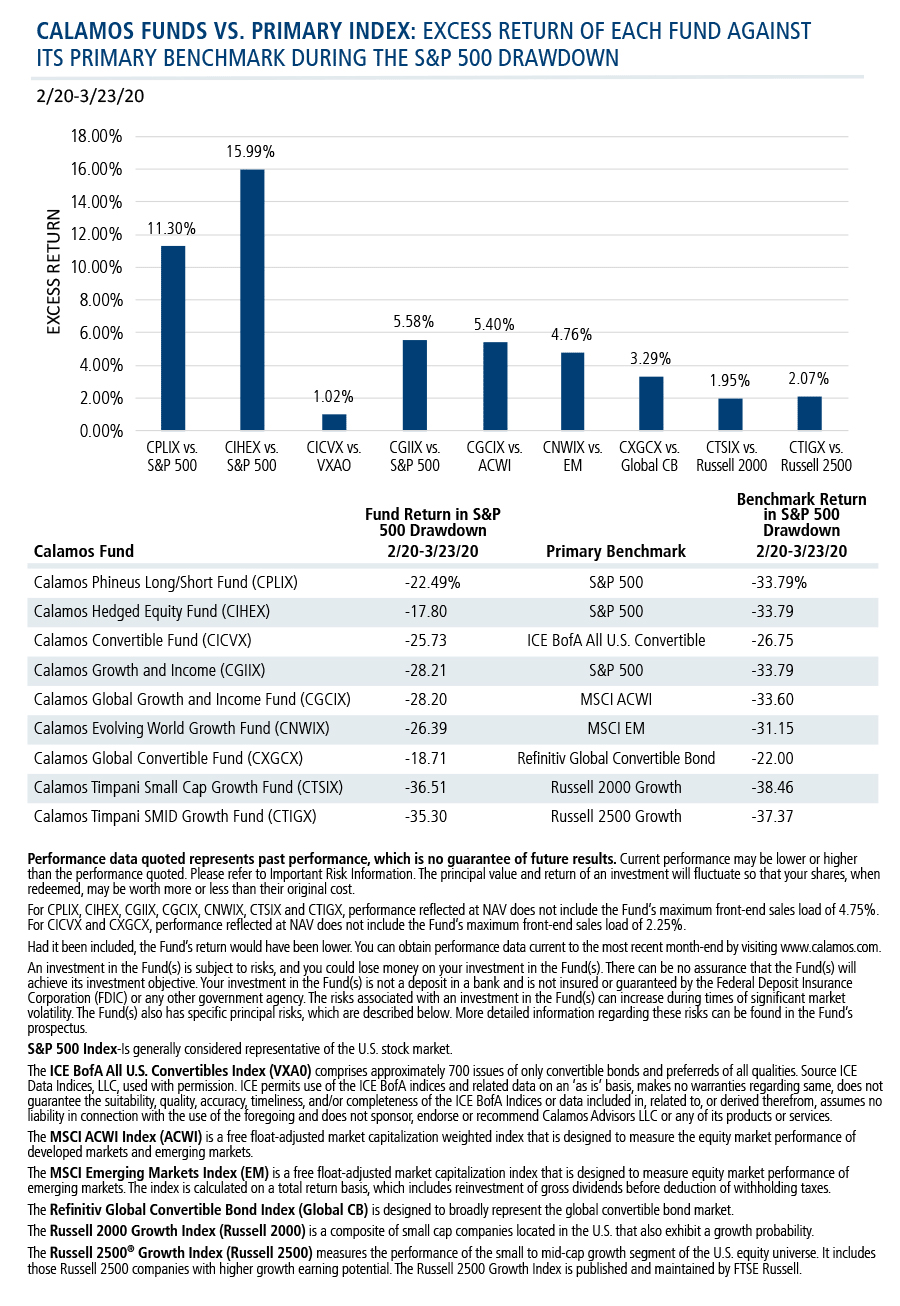
Investment performance in such an environment is necessarily evaluated relative to everything else that’s happening. At a time when markets are cratering, the goal is to do a better job of cushioning the fall.
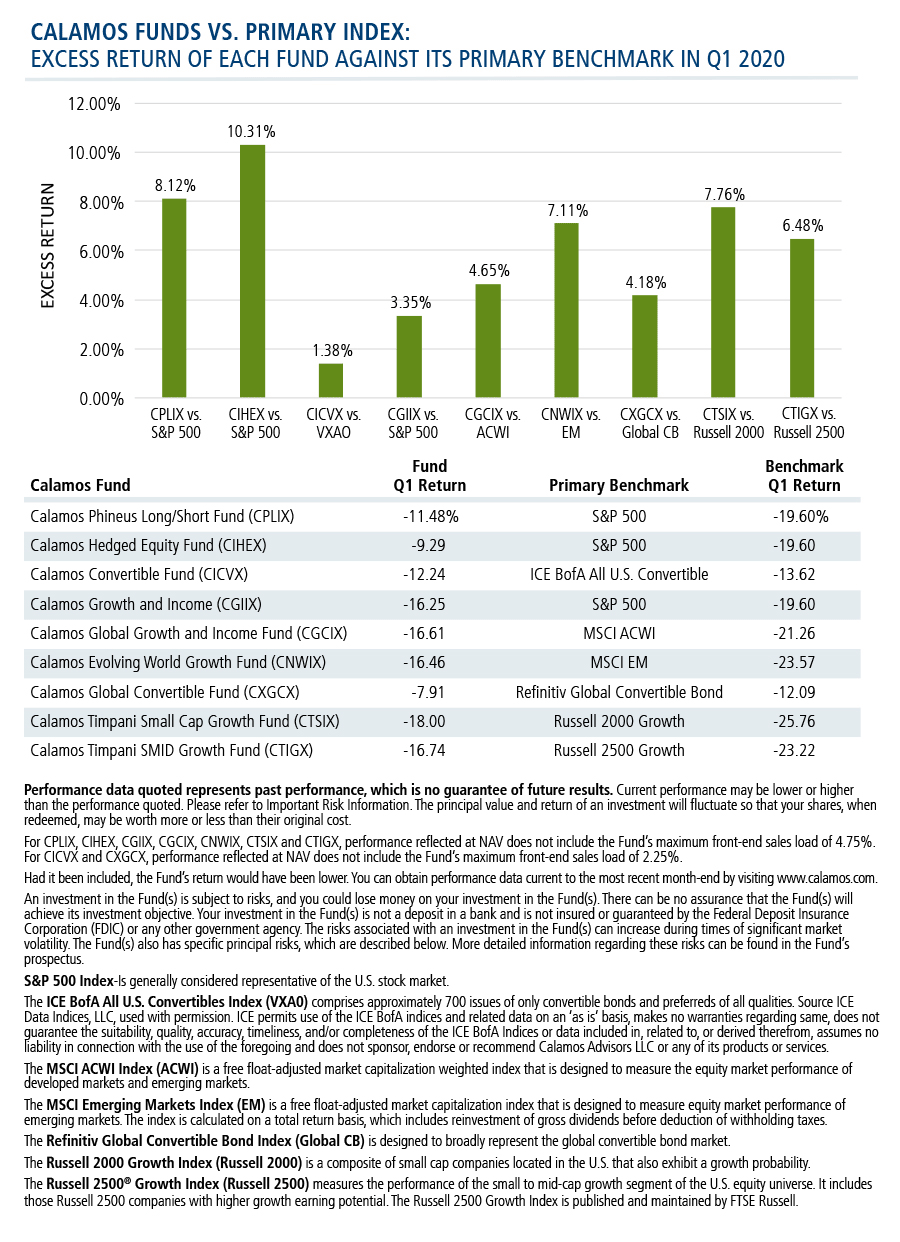
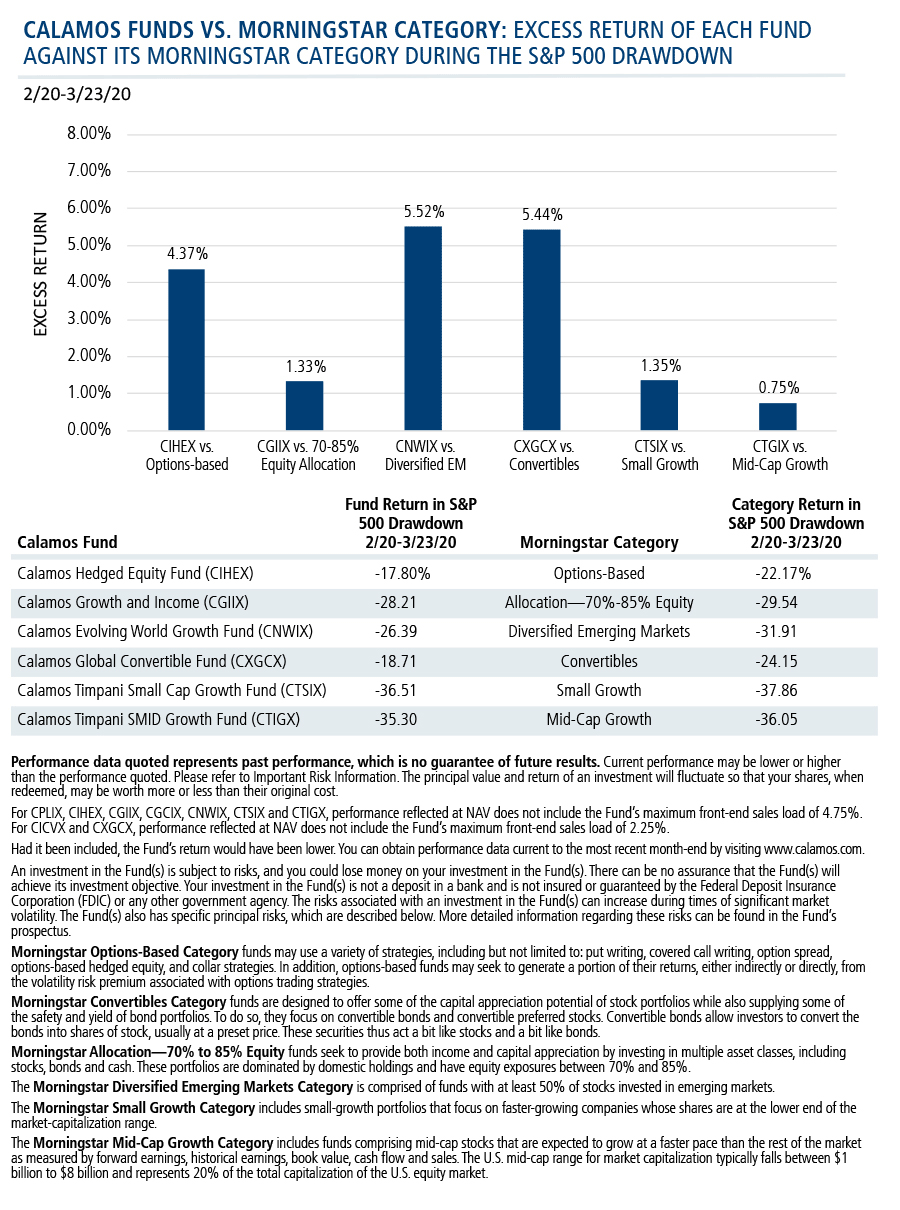
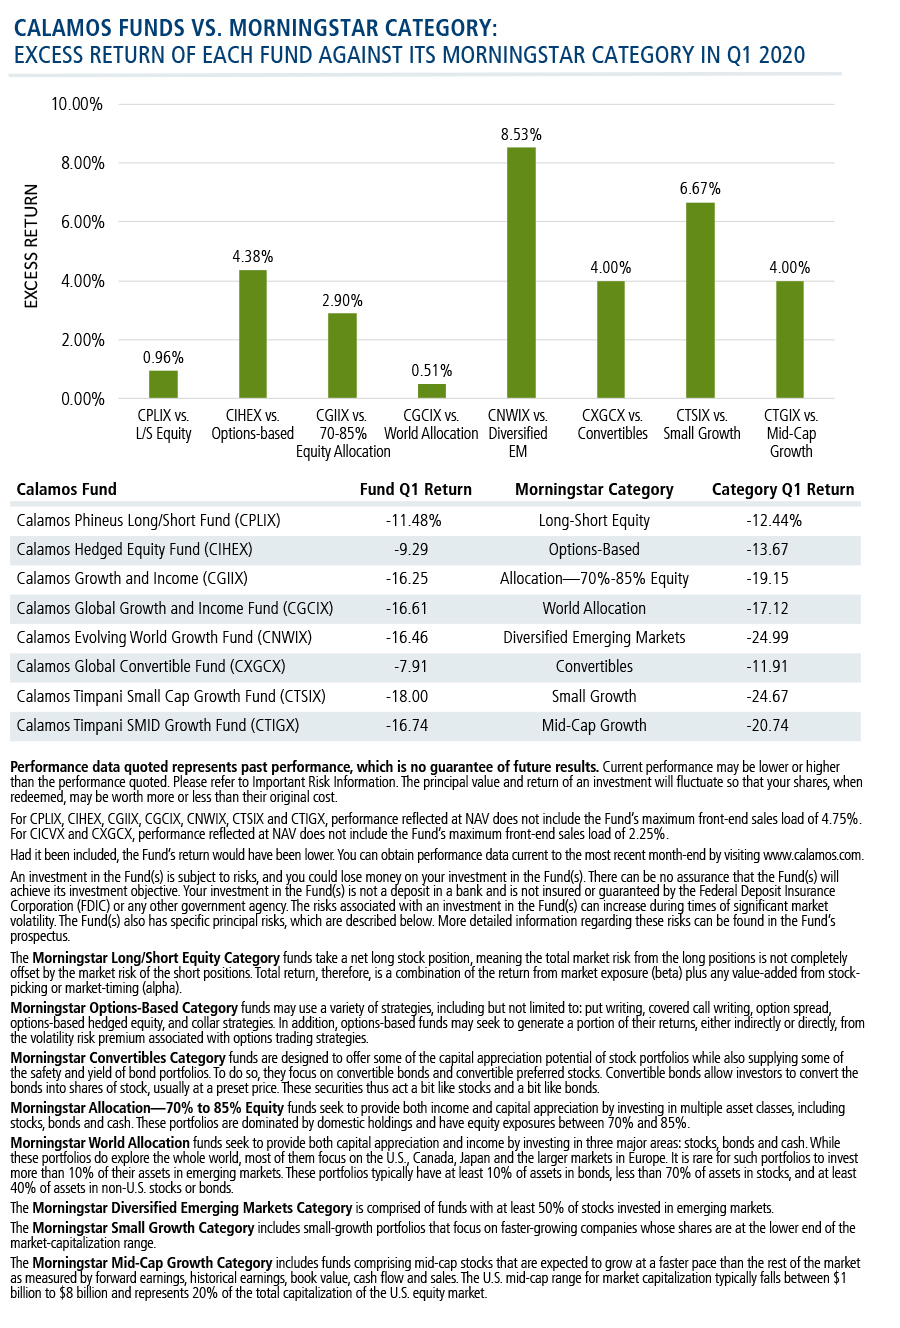
The next several charts show how Calamos funds outperformed during the February 20 to March 23 drawdown and across the full first quarter ended March 31. Included are our alternative funds that worked as designed, our risk-managed convertible-using U.S. and global equity funds, and our small and mid-cap growth funds. Expressed as excess returns, Calamos outperformance is shown against the funds’ primary benchmark and Morningstar category peers during the drawdown and for the full first quarter.
As Calamos Founder, Chairman and Global Chief Investment Officer John P. Calamos, Sr. explained on one of the market’s darkest days in March: “Since our founding more than 40 years ago, risk management has been part of the Calamos DNA; our teams are focused on preserving capital, while also positioning our strategies to take advantage of the positive inflection points that we believe will eventually come.” (See blog post.)
We present these charts as a snapshot of the funds’ performance. Please follow the links at the bottom of the post to see each fund’s long-term performance. Financial advisors, for more information, please contact your Investment Consultant at 888-571-2567 or caminfo@calamos.com.
Click here to view CPLIX's standardized performance.
Click here to view CIHEX's standardized performance.
Click here to view CICVX's standardized performance.
Click here to view CGIIX's standardized performance.
Click here to view CGCIX's standardized performance.
Click here to view CNWIX’s standardized performance.
Click here to view CXGCX’s standardized performance.
Click here to view CTSIX's standardized performance.
Click here to view CTIGX's standardized performance.
Before investing, carefully consider the fund’s investment objectives, risks, charges and expenses. Please see the prospectus and summary prospectus containing this and other information which can be obtained by calling 1-866-363-9219. Read it carefully before investing.
An investment in the Fund(s) is subject to risks, and you could lose money on your investment in the Fund(s). There can be no assurance that the Fund(s) will achieve its investment objective. Your investment in the Fund(s) is not a deposit in a bank and is not insured or guaranteed by the Federal Deposit Insurance Corporation (FDIC) or any other government agency. The risks associated with an investment in the Fund(s) can increase during times of significant market volatility. The Fund(s) also has specific principal risks, which are described below. More detailed information regarding these risks can be found in the Fund's prospectus.
The principal risks of investing in the Calamos Phineus Long/Short Fund include: equity securities risk consisting of market prices declining in general, short sale risk consisting of potential for unlimited losses, foreign securities risk, currency risk, geographic concentration risk, other investment companies (including ETFs) risk, derivatives risk, options risk, and leverage risk. As a result of political or economic instability in foreign countries, there can be special risks associated with investing in foreign securities, including fluctuations in currency exchange rates, increased price volatility and difficulty obtaining information. In addition, emerging markets may present additional risk due to potential for greater economic and political instability in less developed countries.
The principal risks of investing in the Calamos Hedged Equity Fund include: covered call writing risk, options risk, equity securities risk, correlation risk, mid-sized company risk, interest rate risk, credit risk, liquidity risk, portfolio turnover risk, portfolio selection risk, foreign securities risk, American depository receipts, and REITs risks.
Options Risk - The Fund's ability to close out its position as a purchaser or seller of an over-the-counter or exchange-listed put or call option is dependent, in part, upon the liquidity of the option market. There are significant differences between the securities and options markets that could result in an imperfect correlation among these markets, causing a given transaction not to achieve its objectives. The Fund's ability to utilize options successfully will depend on the ability of the Fund's investment adviser to predict pertinent market movements, which cannot be assured.
The principal risks of investing in the Calamos Convertible Fund include: convertible securities risk consisting of the potential for a decline in value during periods of rising interest rates and the risk of the borrower to miss payments, synthetic convertible instruments risk consisting of fluctuations inconsistent with a convertible security and the risk of components expiring worthless, foreign securities risk, equity securities risk, interest rate risk, credit risk, high yield risk, portfolio selection risk and liquidity risk. As a result of political or economic instability in foreign countries, there can be special risks associated with investing in foreign securities, including fluctuations in currency exchange rates, increased price volatility and difficulty obtaining information. In addition, emerging markets may present additional risk due to potential for greater economic and political instability in less developed countries.
The principal risks of investing in the Calamos Growth and Income Fund include: convertible securities risk consisting of the potential for a decline in value during periods of rising interest rates and the risk of the borrower to miss payments, synthetic convertible instruments risk consisting of fluctuations inconsistent with a convertible security and the risk of components expiring worthless, equity securities risk, growth stock risk, small and mid-sized company risk, interest rate risk, credit risk, liquidity risk, high yield risk, forward foreign currency contract risk and portfolio selection risk.
The principal risks of investing in the Calamos Global Growth and Income Fund include: convertible securities risk consisting of the potential for a decline in value during periods of rising interest rates and the risk of the borrower to miss payments, synthetic convertible instruments risk consisting of fluctuations inconsistent with a convertible security and the risk of components expiring worthless, foreign securities risk, emerging markets risk, equity securities risk, growth stock risk, interest rate risk, credit risk, high yield risk, forward foreign currency contract risk, portfolio selection risk, and liquidity risk. As a result of political or economic instability in foreign countries, there can be special risks associated with investing in foreign securities, including fluctuations in currency exchange rates, increased price volatility and difficulty obtaining information. In addition, emerging markets may present additional risk due to potential for greater economic and political instability in less developed countries.
The principal risks of investing in the Calamos Evolving World Growth Fund include: equity securities risk consisting of market prices declining in general, growth stock risk consisting of potential increased volatility due to securities trading at higher multiples, foreign securities risk, emerging markets risk, convertible securities risk consisting of the potential for a decline in value during periods of rising interest rates and the risk of the borrower to miss payments, and portfolio selection risk. As a result of political or economic instability in foreign countries, there can be special risks associated with investing in foreign securities, including fluctuations in currency exchange rates, increased price volatility and difficulty obtaining information. In addition, emerging markets may present additional risk due to potential for greater economic and political instability in less developed countries.
The principal risks of investing in the Calamos Global Convertible Fund include: equity securities risk consisting of market prices declining in general, growth stock risk consisting of potential increased volatility due to securities trading at higher multiples, foreign securities risk, emerging markets risk, currency risk, geographic concentration risk, American depository receipts, mid-size company risk, small company risk, portfolio turnover risk and portfolio selection risk. As a result of political or economic instability in foreign countries, there can be special risks associated with investing in foreign securities, including fluctuations in currency exchange rates, increased price volatility and difficulty obtaining information. In addition, emerging markets may present additional risk due to potential for greater economic and political instability in less developed countries.
The principal risks of investing in the Calamos Timpani Small Cap Growth Fund include: equity securities risk consisting of market prices declining in general, growth stock risk consisting of potential increased volatility due to securities trading at higher multiples, and portfolio selection risk. The Fund invests in small capitalization companies, which are often more volatile and less liquid than investments in larger companies. As a result of political or economic instability in foreign countries, there can be special risks associated with investing in foreign securities, including fluctuations in currency exchange rates, increased price volatility and difficulty obtaining information. In addition, emerging markets may present additional risk due to potential for greater economic and political instability in less developed countries.
The principal risks of investing in the Calamos Timpani SMID Growth Fund include: equity securities risk consisting of market prices declining in general, growth stock risk consisting of potential increased volatility due to securities trading at higher multiples, and portfolio selection risk. The Fund invests in small capitalization companies, which are often more volatile and less liquid than investments in larger companies. As a result of political or economic instability in foreign countries, there can be special risks associated with investing in foreign securities, including fluctuations in currency exchange rates, increased price volatility and difficulty obtaining information. In addition, emerging markets may present additional risk due to potential for greater economic and political instability in less developed countries.
S&P 500 Index-Is generally considered representative of the U.S. stock market.
The ICE BofA All U.S. Convertibles Index (VXA0) comprises approximately 700 issues of only convertible bonds and preferreds of all qualities. Source ICE Data Indices, LLC, used with permission. ICE permits use of the ICE BofA indices and related data on an 'as is' basis, makes no warranties regarding same, does not guarantee the suitability, quality, accuracy, timeliness, and/or completeness of the ICE BofA Indices or data included in, related to, or derived therefrom, assumes no liability in connection with the use of the foregoing and does not sponsor, endorse or recommend Calamos Advisors LLC or any of its products or services.
The MSCI ACWI Index is a free float-adjusted market capitalization weighted index that is designed to measure the equity market performance of developed markets and emerging markets.
The MSCI Emerging Markets Index is a free float-adjusted market capitalization index that is designed to measure equity market performance of emerging markets. The index is calculated on a total return basis, which includes reinvestment of gross dividends before deduction of withholding taxes.
The Refinitiv Global Convertible Bond Index is designed to broadly represent the global convertible bond market.
The Russell 2000 Growth Index is a composite of small cap companies located in the U.S. that also exhibit a growth probability.
The Russell 2500® Growth Index measures the performance of the small to mid-cap growth segment of the U.S. equity universe. It includes those Russell 2500 companies with higher growth earning potential. The Russell 2500 Growth Index is published and maintained by FTSE Russell.
The Morningstar Long/Short Equity Category funds take a net long stock position, meaning the total market risk from the long positions is not completely offset by the market risk of the short positions. Total return, therefore, is a combination of the return from market exposure (beta) plus any value-added from stock-picking or market-timing (alpha).
Morningstar Options-Based Category funds may use a variety of strategies, including but not limited to: put writing, covered call writing, option spread, options-based hedged equity, and collar strategies. In addition, options-based funds may seek to generate a portion of their returns, either indirectly or directly, from the volatility risk premium associated with options trading strategies.
Morningstar Convertibles Category funds are designed to offer some of the capital appreciation potential of stock portfolios while also supplying some of the safety and yield of bond portfolios. To do so, they focus on convertible bonds and convertible preferred stocks. Convertible bonds allow investors to convert the bonds into shares of stock, usually at a preset price. These securities thus act a bit like stocks and a bit like bonds.
Morningstar Allocation—70% to 85% Equity funds seek to provide both income and capital appreciation by investing in multiple asset classes, including stocks, bonds and cash. These portfolios are dominated by domestic holdings and have equity exposures between 70% and 85%.
Morningstar World Allocation funds seek to provide both capital appreciation and income by investing in three major areas: stocks, bonds and cash. While these portfolios do explore the whole world, most of them focus on the U.S., Canada, Japan and the larger markets in Europe. It is rare for such portfolios to invest more than 10% of their assets in emerging markets. These portfolios typically have at least 10% of assets in bonds, less than 70% of assets in stocks, and at least 40% of assets in non-U.S. stocks or bonds.
The Morningstar Diversified Emerging Markets Category is comprised of funds with at least 50% of stocks invested in emerging markets.
The Morningstar Small Growth Category includes small-growth portfolios that focus on faster-growing companies whose shares are at the lower end of the market-capitalization range.
The Morningstar Mid-Cap Growth Category includes funds comprising mid-cap stocks that are expected to grow at a faster pace than the rest of the market as measured by forward earnings, historical earnings, book value, cash flow and sales. The U.S. mid-cap range for market capitalization typically falls between $1 billion to $8 billion and represents 20% of the total capitalization of the U.S. equity market.
801987 420
Archived material may contain dated performance, risk and other information. Current performance may be lower or higher than the performance quoted in the archived material. For the most recent month-end fund performance information visit www.calamos.com. Archived material may contain dated opinions and estimates based on our judgment and are subject to change without notice, as are statements of financial market trends, which are based on current market conditions at the time of publishing. We believed the information provided here was reliable, but do not warrant its accuracy or completeness. This material is not intended as an offer or solicitation for the purchase or sale of any financial instrument. The views and strategies described may not be suitable for all investors. This material has been prepared for informational purposes only, and is not intended to provide, and should not be relied on for, accounting, legal or tax advice. References to future returns are not promises or even estimates of actual returns a client portfolio may achieve. Any forecasts contained herein are for illustrative purposes only and are not to be relied upon as advice or interpreted as a recommendation.
Performance data quoted represents past performance, which is no guarantee of future results. Current performance may be lower or higher than the performance quoted. The principal value and return of an investment will fluctuate so that your shares, when redeemed, may be worth more or less than their original cost. Performance reflected at NAV does not include the Fund’s maximum front-end sales load. Had it been included, the Fund’s return would have been lower.
Archived on April 13, 2021