After a Mighty Move in May, CTSIX Looks Forward to a Market Rotation Toward Small Caps
June 10, 2020
You might agree that the Calamos Timpani Small Cap Growth Fund (CTSIX) had a pretty good May. The fund:
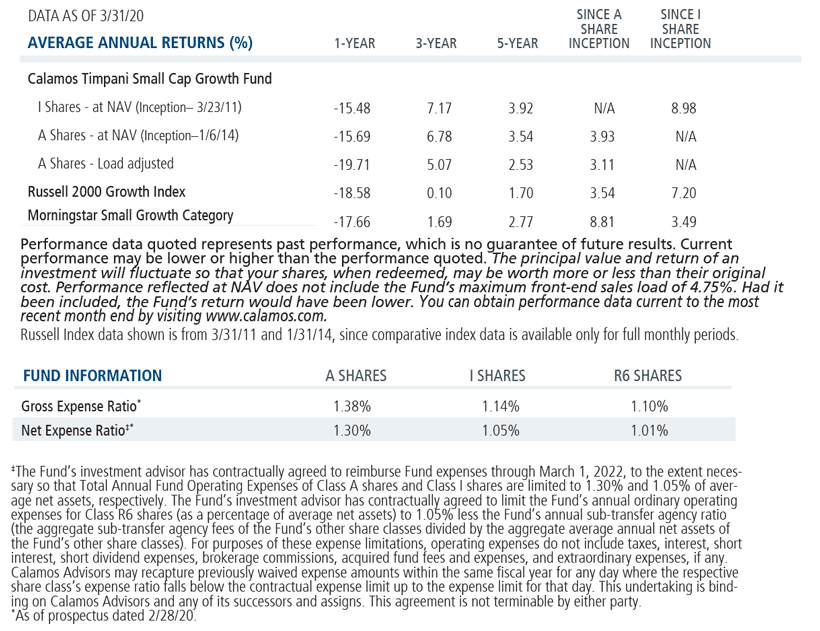
- Entered the month down -7.59% for the year and, with a 14.92% return, closed May up 6.20%. More than 1200 basis points away in the other direction was CTSIX’s benchmark, the Russell 2000 Growth Index, which finished May down -6.65% for the year.
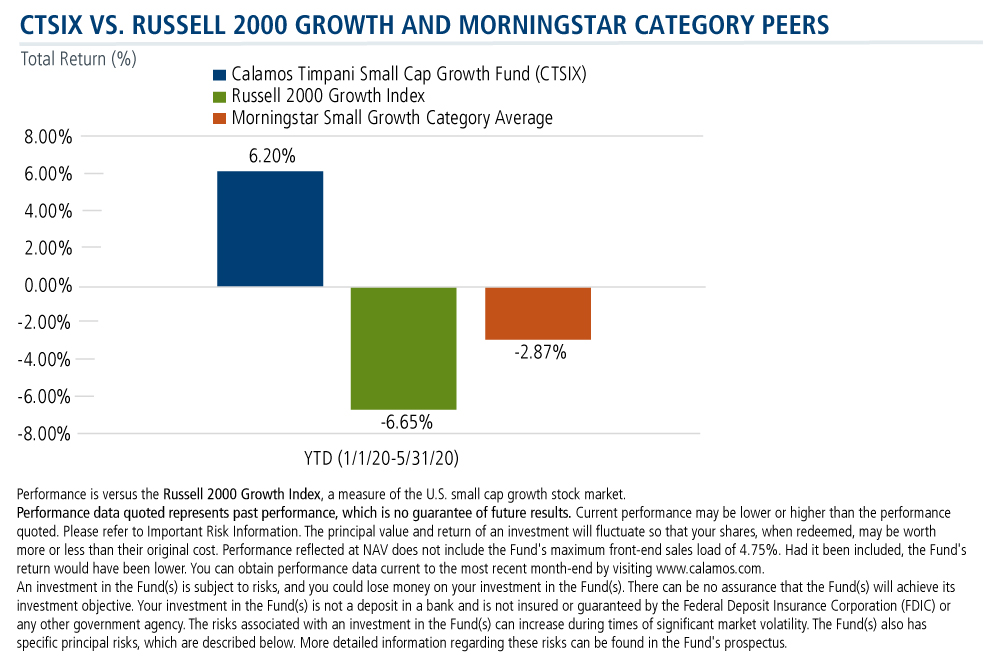
For context, within Morningstar’s Small Growth category, less than one-third of funds (32%) were positive year to date through 5/31/20.
-
Affirmed yet again the team’s ability to pick winners, as analyzed by the team’s internal methodology. The earnings season (remember that small caps report later than large caps) was one of CTSIX’s best, according to Brandon Nelson, Senior Portfolio Manager.
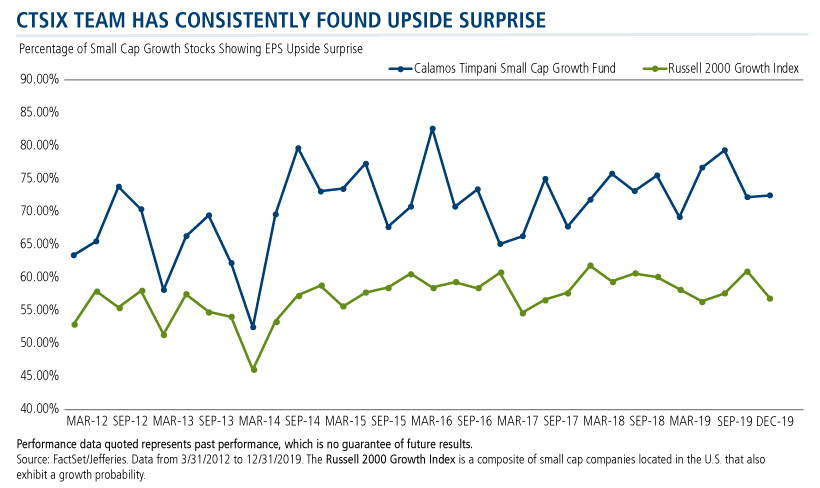
For the last few years, the team has tracked outlier performance—stocks that had one-day 5%+ moves higher and lower on the first trade day after a stock reports.
The results last month: In absolute terms, the fund’s outliers were 80.6% positive (29 of 36) and just 19.4% negative (seven of 36). Relative to the benchmark, outliers were 78.4% positive (29 of 37) and just 21.6% negative (eight of 37) for that one-day analysis. Both the absolute and relative positive outlier figures are well above average.
”Earnings seasons have tended to be alpha generators, and that’s how it should be,” says Nelson. “That’s when you get a tidal wave of data. When companies are beating estimates, that’s when they enjoy the multiple expansion. It makes sense that you should be generating disproportionate alpha during earnings season because that’s when the datapoints are fresh.”
As shown below, the CTSIX team has consistently found upside surprise.
- The top contributor to CTSIX’s performance was bought multiple times on May 5 for an average price of $10.69 per share. It closed on May 29 at a price of $21.89. The holding, which Nelson can’t name because it has yet to be publicly disclosed, is among the top 15 weights in the fund, and CTSIX owns more than 1% of the company. This “winner” is not in the index. “This is why you would own our fund instead of an index,” Nelson says.
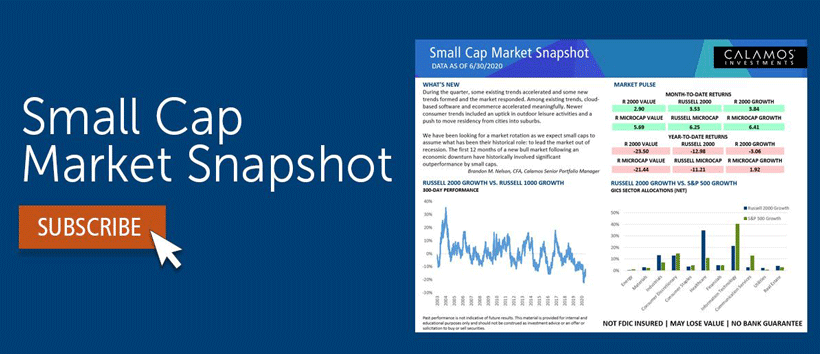
Small Caps Are Poised to Mean Revert
But as strong as May was, Nelson is even more positive about what he believes is ahead for small caps. With small caps having lagged large caps for the last 3.5 years, Nelson agrees with many strategists who believe the stage is set for a mean reversion for small caps to outperform going forward.
Specifically, Nelson expects small caps to perform what has been their historical role: to lead the market out of recession. The first 12 months of a new bull market following an economic downturn have historically involved significant outperformance—1400 basis points—by small caps. (See this April post from Nelson.)
The performance of large and small cap stocks has rarely, if ever, been as divergent as it is currently, according to Nelson. The last time it was close—20 years ago—the Russell 2000 reverted to the mean by outperforming the S&P 500 by approximately 50%.
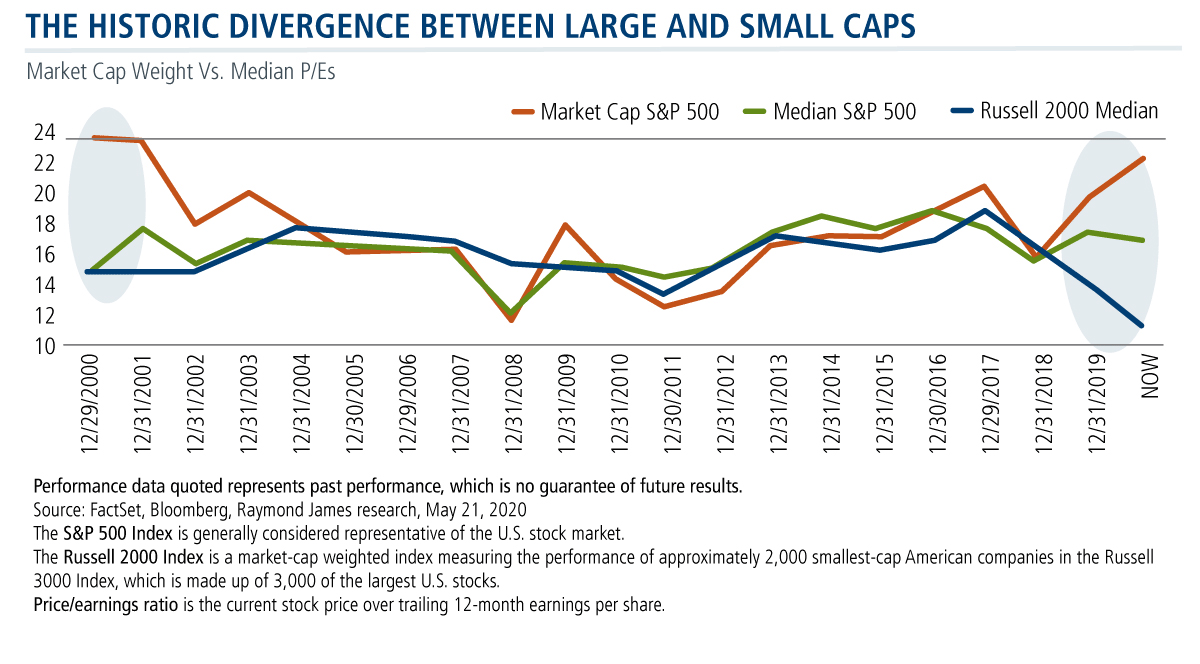
“It doesn't necessarily mean that large caps need to go down a lot in value. They could flatline or only rise modestly from here, and you could see small caps climb significantly more,” said Nelson at last week’s "A Closer Look at Small Cap Opportunities" webcast (watch on-demand here).
Finally, Nelson calls attention to one more market dynamic for those seeking to position their clients for upcoming small cap opportunities.
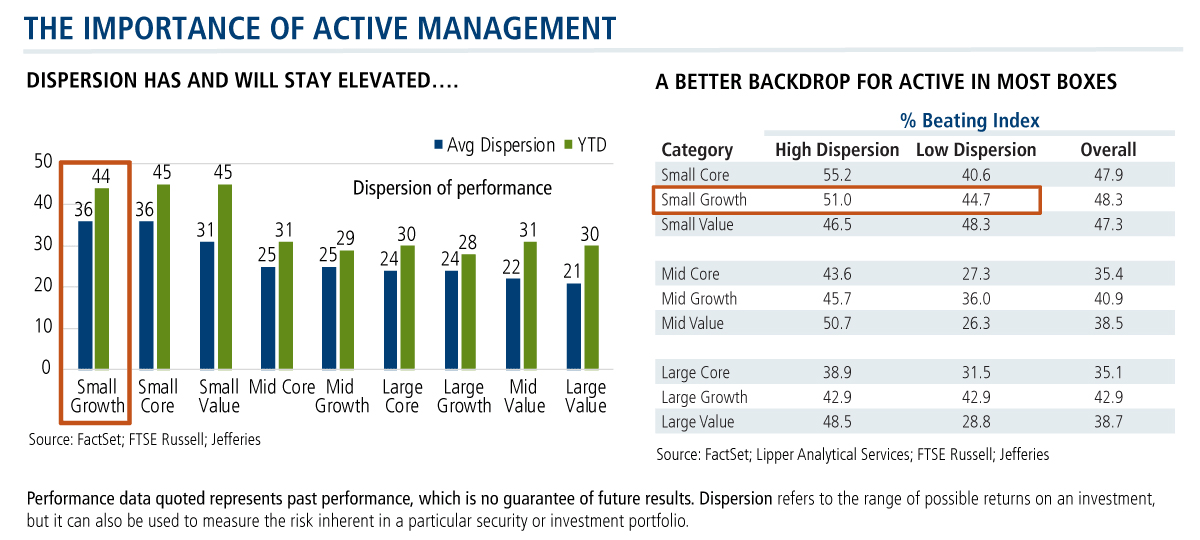
“Active management in small cap growth always makes sense because the inherent higher volatility of the asset class creates so many opportunities to outperform,” he says. (Indeed, investment professional respondents to Calamos research last year agreed—two-thirds said they were likelier to choose an active manager for a small cap fund.)
But the active management edge is particularly evident in markets like these when dispersion (range of performance between stocks) is as high as it’s been this year. As shown in the chart below, dispersion is highest in small cap growth at all times but “off the charts” this year.
Investment professionals, reach out to your Calamos Investment Consultant to learn more about why we’re enthusiastic about CTSIX’s prospects. You can reach him or her at 888-571-2567 or caminfo@calamos.com.
Before investing, carefully consider the fund’s investment objectives, risks, charges and expenses. Please see the prospectus and summary prospectus containing this and other information which can be obtained by calling 1-866-363-9219. Read it carefully before investing.
Opinions are subject to change due to changes in the market, economic conditions or changes in the legal and/or regulatory environment and may not necessarily come to pass. This information is provided for informational purposes only and should not be considered tax, legal, or investment advice. References to specific securities, asset classes and financial markets are for illustrative purposes only and are not intended to be, and should not be interpreted as, recommendations.
Important Risk Information. An investment in the Fund(s) is subject to risks, and you could lose money on your investment in the Fund(s). There can be no assurance that the Fund(s) will achieve its investment objective. Your investment in the Fund(s) is not a deposit in a bank and is not insured or guaranteed by the Federal Deposit Insurance Corporation (FDIC) or any other government agency. The risks associated with an investment in the Fund(s) can increase during times of significant market volatility. The Fund(s) also has specific principal risks, which are described below. More detailed information regarding these risks can be found in the Fund's prospectus.
The principal risks of investing in the Calamos Timpani Small Cap Growth Fund include: equity securities risk consisting of market prices declining in general, growth stock risk consisting of potential increased volatility due to securities trading at higher multiples, and portfolio selection risk. The Fund invests in small capitalization companies, which are often more volatile and less liquid than investments in larger companies. As a result of political or economic instability in foreign countries, there can be special risks associated with investing in foreign securities, including fluctuations in currency exchange rates, increased price volatility and difficulty obtaining information. In addition, emerging markets may present additional risk due to potential for greater economic and political instability in less developed countries.
802035 0620
Archived material may contain dated performance, risk and other information. Current performance may be lower or higher than the performance quoted in the archived material. For the most recent month-end fund performance information visit www.calamos.com. Archived material may contain dated opinions and estimates based on our judgment and are subject to change without notice, as are statements of financial market trends, which are based on current market conditions at the time of publishing. We believed the information provided here was reliable, but do not warrant its accuracy or completeness. This material is not intended as an offer or solicitation for the purchase or sale of any financial instrument. The views and strategies described may not be suitable for all investors. This material has been prepared for informational purposes only, and is not intended to provide, and should not be relied on for, accounting, legal or tax advice. References to future returns are not promises or even estimates of actual returns a client portfolio may achieve. Any forecasts contained herein are for illustrative purposes only and are not to be relied upon as advice or interpreted as a recommendation.
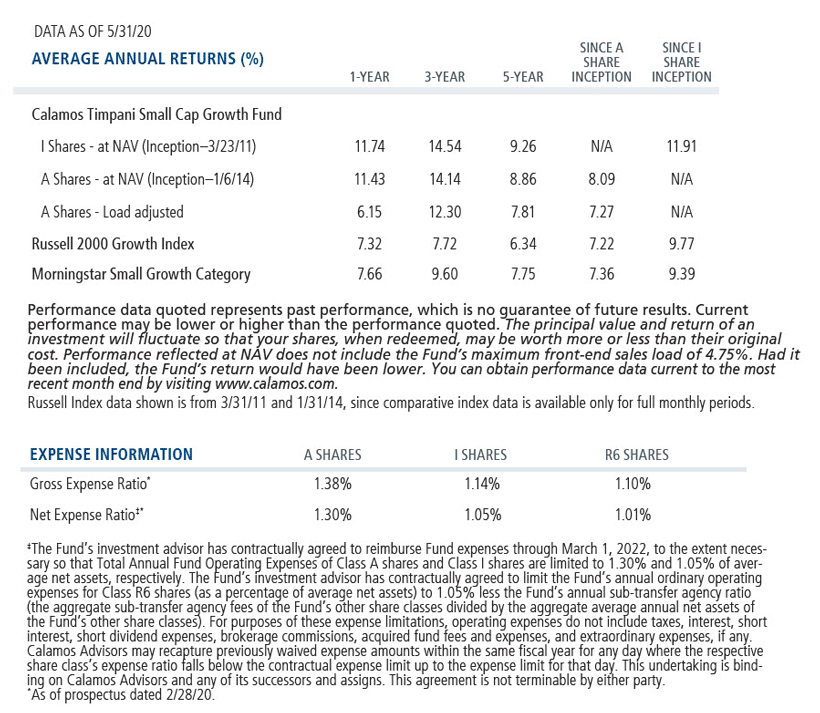
Performance data quoted represents past performance, which is no guarantee of future results. Current performance may be lower or higher than the performance quoted. The principal value and return of an investment will fluctuate so that your shares, when redeemed, may be worth more or less than their original cost. Performance reflected at NAV does not include the Fund’s maximum front-end sales load. Had it been included, the Fund’s return would have been lower.
Archived material may contain dated performance, risk and other information. Current performance may be lower or higher than the performance quoted in the archived material. For the most recent month-end fund performance information visit www.calamos.com. Archived material may contain dated opinions and estimates based on our judgment and are subject to change without notice, as are statements of financial market trends, which are based on current market conditions at the time of publishing. We believed the information provided here was reliable, but do not warrant its accuracy or completeness. This material is not intended as an offer or solicitation for the purchase or sale of any financial instrument. The views and strategies described may not be suitable for all investors. This material has been prepared for informational purposes only, and is not intended to provide, and should not be relied on for, accounting, legal or tax advice. References to future returns are not promises or even estimates of actual returns a client portfolio may achieve. Any forecasts contained herein are for illustrative purposes only and are not to be relied upon as advice or interpreted as a recommendation.
Performance data quoted represents past performance, which is no guarantee of future results. Current performance may be lower or higher than the performance quoted. The principal value and return of an investment will fluctuate so that your shares, when redeemed, may be worth more or less than their original cost. Performance reflected at NAV does not include the Fund’s maximum front-end sales load. Had it been included, the Fund’s return would have been lower.
Archived on June 10, 2021