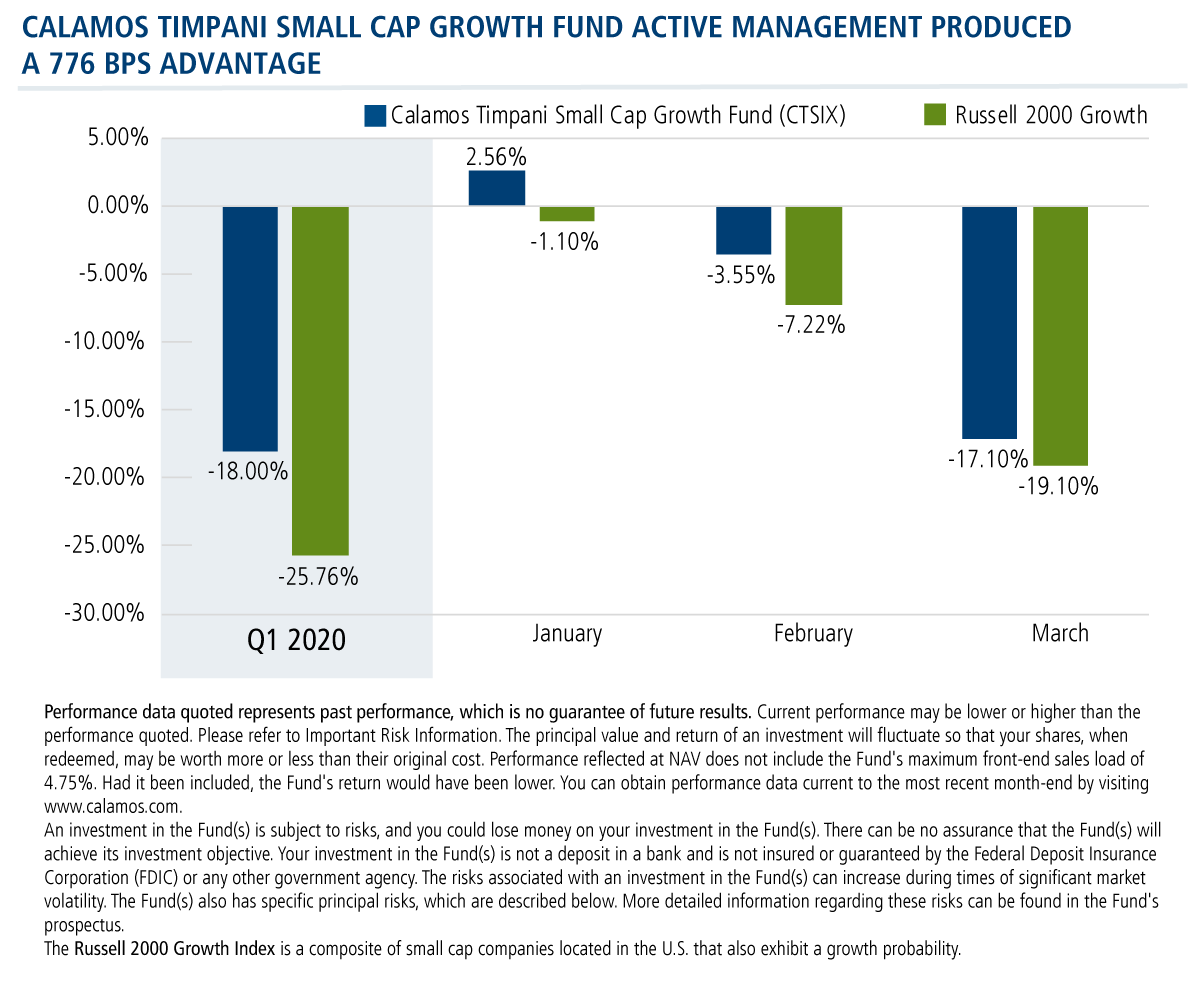
How CTSIX’s Active Management Provided a 776bps Advantage in a Deep Down Quarter for Small Cap Growth
April 14, 2020
The case for active management is typically made over full market cycles. It’s over an extended period of time that investors experience the benefit of investment directed by a team of professionals as opposed to a market index.
In this post, we’ll isolate just the first three months of 2020—a quarter that will long be remembered for its all-time highs and then fastest plummet to correction and then crash related to COVID-19. The data below spotlights the impact of the active management of Calamos Timpani Small Cap Growth Fund (CTSIX). While financial advisors know to consider the fund’s long-term results, the data provides a near real-time perspective on active management at work January through March 31.
Like many portfolio managers, Senior Portfolio Manager Brandon M. Nelson, CFA, describes the quarter as one of the most difficult and unusual periods in his career. What made the difference last quarter, he says, is the team’s bias to own stocks of high quality companies with relatively strong growth prospects.
Ultimately, active management’s investment performance is the result of a series of decisions. Decisions that are more correct than not are what lead to a potential performance advantage.
Nelson credits the CTSIX’s team trading—whether to initiate a position, liquidate a position, trim or add to the portfolio—during the quarter for providing 39% (295 basis points) of the 776 basis points of outperformance. This attribution is based on a holding by holding comparison of the portfolio against the performance results of a buy-and-hold strategy if the portfolio had been unchanged throughout the quarter.
Key to the fund’s process is the team’s sell discipline (see Watch: Small Cap Active Management: The Buy/Sell Process That Differentiates CTSIX). In fact, in the first quarter, sales of nine stocks made a significant contribution. (Fund holdings are reported on a delay. For the latest list of all holdings, see Where We’re Finding Small Cap Opportunities).
As at all times, a host of factors drove the decisions, including:
- Sustainability of growth rate became questionable—a significant driver, given the quarter.
- Earnings were disappointing or revenue was revised.
- Market sentiment turned negative.
The sell discipline proved to be a clear advantage in turbulent markets and helps explain why the fund ranks eleventh in its performance among its peers in Morningstar’s U.S. Small Growth category as of 3/31/20. (Calamos Timpani Small Cap Growth Fund: The inception of Class I shares was 3/23/11. The fund’s Class I shares were ranked 233 of 635 for the 1-year period, 116 of 577 for the 3-year period and 173 of 502 for the 5-year period.)
Financial advisors, for more information about CTSIX, talk to your Calamos Investment Consultant at 888-571-2567 or caminfo@calamos.com.
Before investing, carefully consider the fund’s investment objectives, risks, charges and expenses. Please see the prospectus and summary prospectus containing this and other information which can be obtained by calling 1-866-363-9219. Read it carefully before investing.
Opinions and estimates offered constitute our judgment and are subject to change without notice, as are statements of financial market trends, which are based on current market conditions. We believe the information provided here is reliable, but do not warrant its accuracy or completeness. This material is not intended as an offer or solicitation for the purchase or sale of any financial instrument. The views and strategies described may not be suitable for all investors. This material has been prepared for informational purposes only, and is not intended to provide, and should not be relied on for, accounting, legal or tax advice. References to future returns are not promises or even estimates of actual returns a client portfolio may achieve. Any forecasts contained herein are for illustrative purposes only and are not to be relied upon as advice or interpreted as a recommendation.
An investment in the Fund(s) is subject to risks, and you could lose money on your investment in the Fund(s). There can be no assurance that the Fund(s) will achieve its investment objective. Your investment in the Fund(s) is not a deposit in a bank and is not insured or guaranteed by the Federal Deposit Insurance Corporation (FDIC) or any other government agency. The risks associated with an investment in the Fund(s) can increase during times of significant market volatility. The Fund(s) also has specific principal risks, which are described below. More detailed information regarding these risks can be found in the Fund's prospectus.
The principal risks of investing in the Calamos Timpani Small Cap Growth Fund include: equity securities risk consisting of market prices declining in general, growth stock risk consisting of potential increased volatility due to securities trading at higher multiples, and portfolio selection risk. The Fund invests in small capitalization companies, which are often more volatile and less liquid than investments in larger companies. As a result of political or economic instability in foreign countries, there can be special risks associated with investing in foreign securities, including fluctuations in currency exchange rates, increased price volatility and difficulty obtaining information. In addition, emerging markets may present additional risk due to potential for greater economic and political instability in less developed countries.
The Russell 2000 Growth Index is a composite of small cap companies located in the U.S. that also exhibit a growth probability.
Morningstar Small Growth Category includes small-growth portfolios that focus on faster-growing companies whose shares are at the lower end of the market-capitalization range.
801933 0420
Archived material may contain dated performance, risk and other information. Current performance may be lower or higher than the performance quoted in the archived material. For the most recent month-end fund performance information visit www.calamos.com. Archived material may contain dated opinions and estimates based on our judgment and are subject to change without notice, as are statements of financial market trends, which are based on current market conditions at the time of publishing. We believed the information provided here was reliable, but do not warrant its accuracy or completeness. This material is not intended as an offer or solicitation for the purchase or sale of any financial instrument. The views and strategies described may not be suitable for all investors. This material has been prepared for informational purposes only, and is not intended to provide, and should not be relied on for, accounting, legal or tax advice. References to future returns are not promises or even estimates of actual returns a client portfolio may achieve. Any forecasts contained herein are for illustrative purposes only and are not to be relied upon as advice or interpreted as a recommendation.
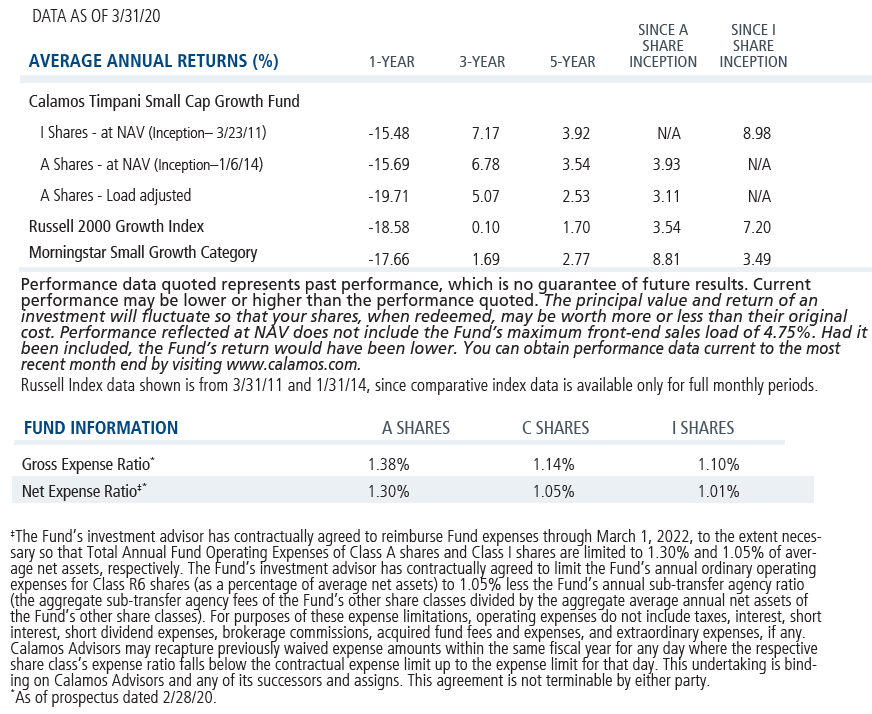
Performance data quoted represents past performance, which is no guarantee of future results. Current performance may be lower or higher than the performance quoted. The principal value and return of an investment will fluctuate so that your shares, when redeemed, may be worth more or less than their original cost. Performance reflected at NAV does not include the Fund’s maximum front-end sales load. Had it been included, the Fund’s return would have been lower.
Archived material may contain dated performance, risk and other information. Current performance may be lower or higher than the performance quoted in the archived material. For the most recent month-end fund performance information visit www.calamos.com. Archived material may contain dated opinions and estimates based on our judgment and are subject to change without notice, as are statements of financial market trends, which are based on current market conditions at the time of publishing. We believed the information provided here was reliable, but do not warrant its accuracy or completeness. This material is not intended as an offer or solicitation for the purchase or sale of any financial instrument. The views and strategies described may not be suitable for all investors. This material has been prepared for informational purposes only, and is not intended to provide, and should not be relied on for, accounting, legal or tax advice. References to future returns are not promises or even estimates of actual returns a client portfolio may achieve. Any forecasts contained herein are for illustrative purposes only and are not to be relied upon as advice or interpreted as a recommendation.
Performance data quoted represents past performance, which is no guarantee of future results. Current performance may be lower or higher than the performance quoted. The principal value and return of an investment will fluctuate so that your shares, when redeemed, may be worth more or less than their original cost. Performance reflected at NAV does not include the Fund’s maximum front-end sales load. Had it been included, the Fund’s return would have been lower.
Archived on April 14, 2021