Looking for a Small Cap Rally in 2020? Now Is the Time to Prepare
January 8, 2020
"Do the work now.”
So suggests Brandon M. Nelson, Senior Portfolio Manager of Calamos Timpani Small Cap Growth Fund (CTSIX), to financial advisors anticipating small caps to overcome 2019’s headwinds and start on a tear higher.
What Happened in 2019
High growth, high expectation stocks are subject to ebbs and flows, Nelson notes—with the most recent ebb starting in July 2019. The CTSIX team compares this period to the 2014-2015 correction which, as in 2019, was sparked by a dramatic rotation into deep value stocks at the expense of growth stocks.
When that happens, Nelson says, “the only way to win is to cheat, and we don’t do that. We're style-pure, we don't drift. There are different shades of what we do, but we stay in our stylebox and we won't drift. Because of that, when there’s a vicious rotation against growth, it can be a difficult period.”
The chart below compares the relative performance of the fund in 2014-2015 with the 2019 correction. In 2014, the fund took six months to establish the left side of the U, followed by a basing process (the bottom of the U), which was then followed by a strong performance surge (the right side of the U).
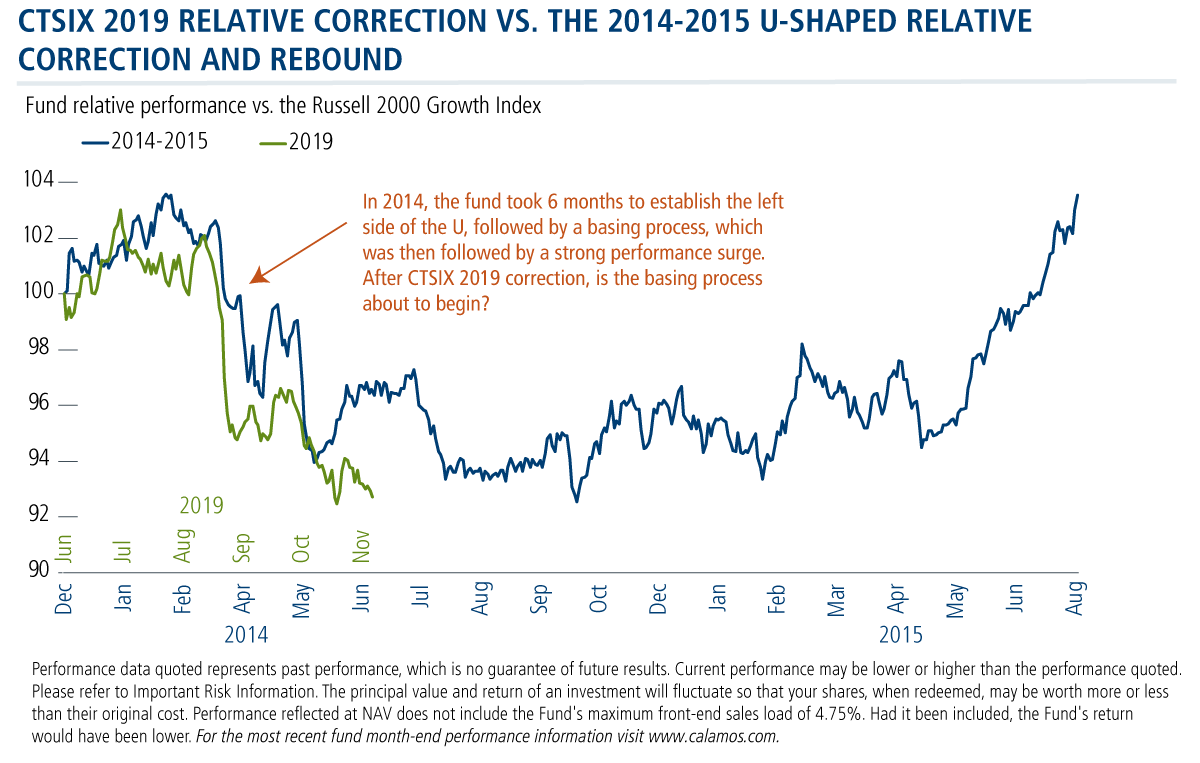
“Every downtick and uptick has their own sort of unique characteristics. This one has been more fierce than normal, no doubt, and who knows what that means,” says Nelson.
“I don’t know the amount of time we’ll be in the bottom of the U, the steepness of the drop or the steepness of the recovery. I don't know if today's the bottom or if today is the ideal entry point, but I've seen this movie before, and I've seen it many times. I believe there’s a pattern that will play out. I’m confident,” he says.
Small Cap Vs. Large Cap Performance
Nelson shares some additional observations about small caps in general and small cap growth in particular.
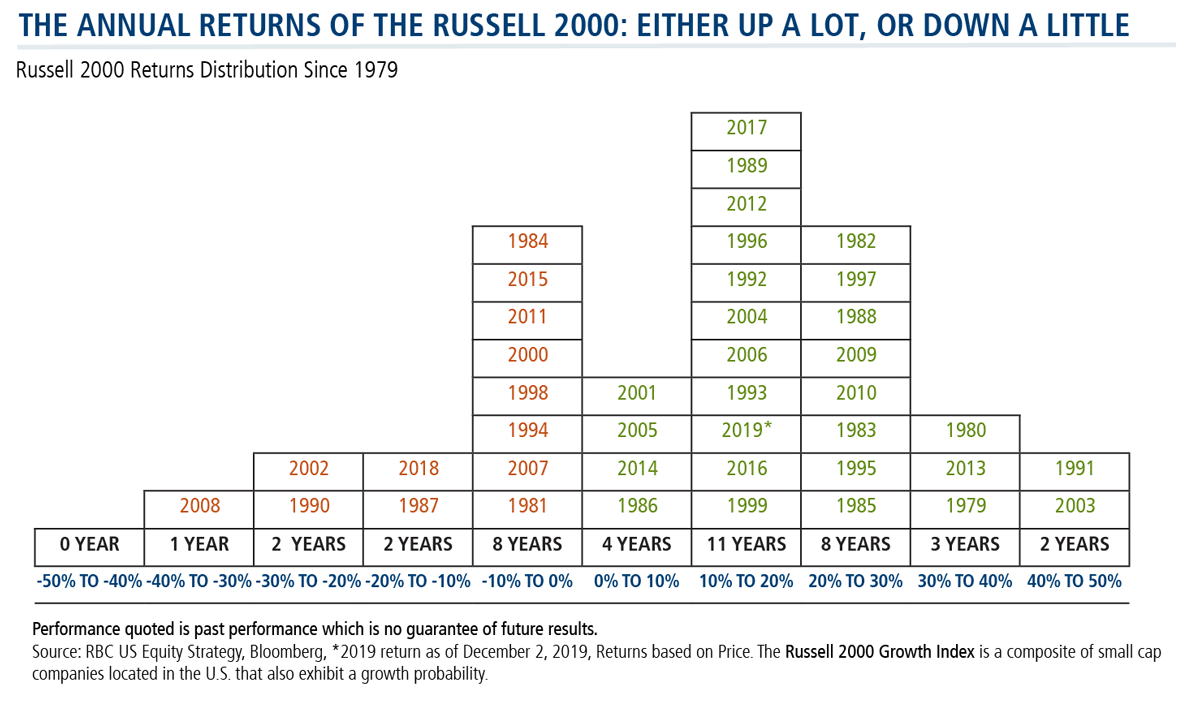
Since 1979, small caps have delivered what Nelson calls “lopsided” results—“In any given year,” he says, "the Russell 2000 tends to be up a lot or down a little.” While there have been five out of 41 years when the Russell 2000 generated a negative 10% or worse return, there have been 24 years when Russell stocks produced 10% or better.
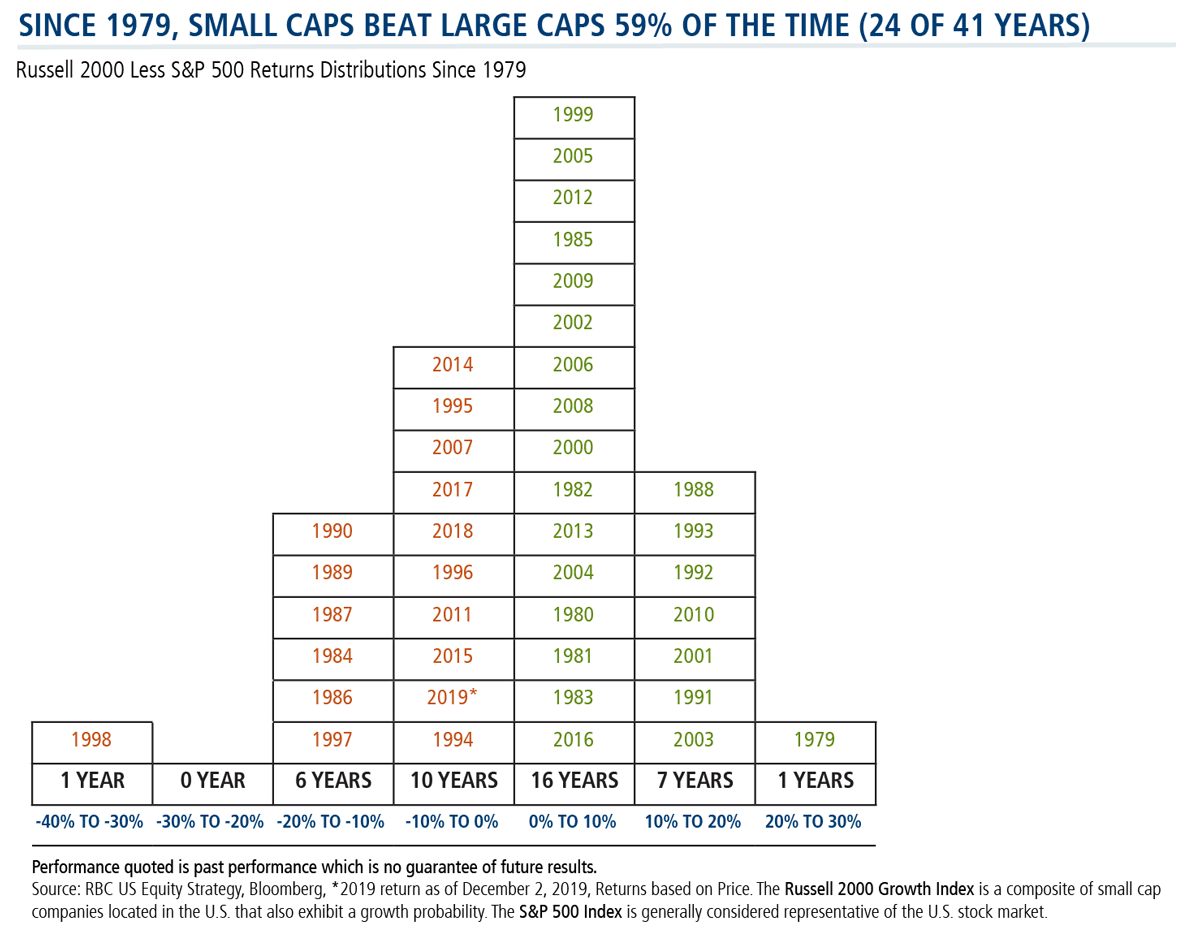
And here’s what the distribution looks like when comparing the relative performance of large caps (S&P 500) to small (Russell 2000). Small caps outperformed 24 of 41 years, or 59% of the time.
Current Small Cap Vs. Large Cap Performance
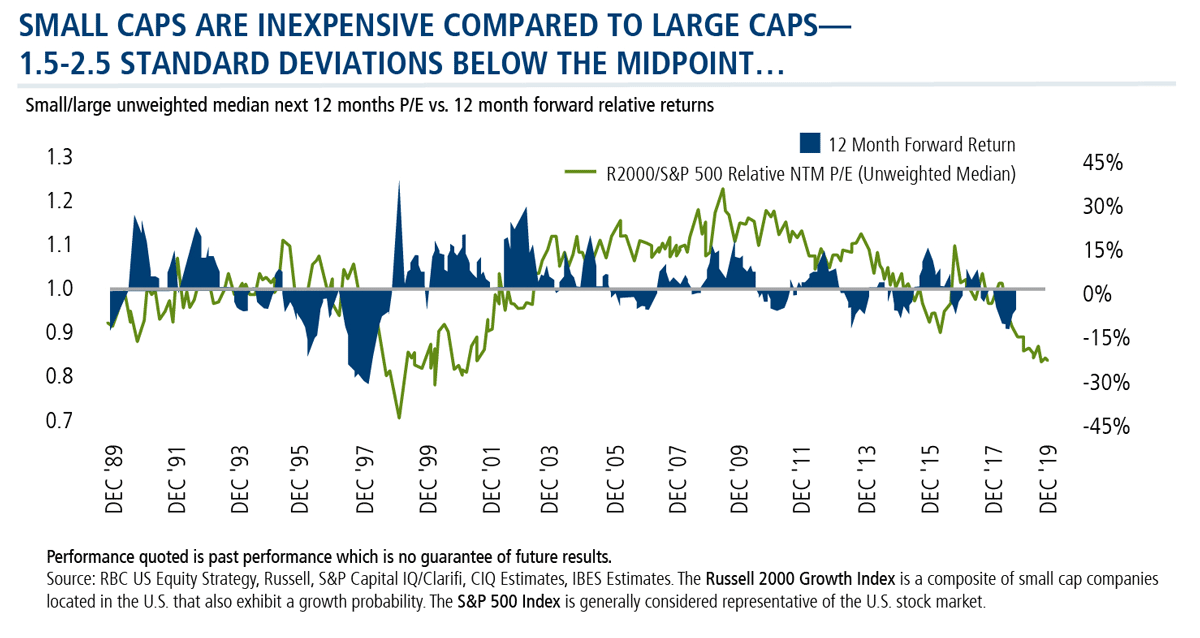
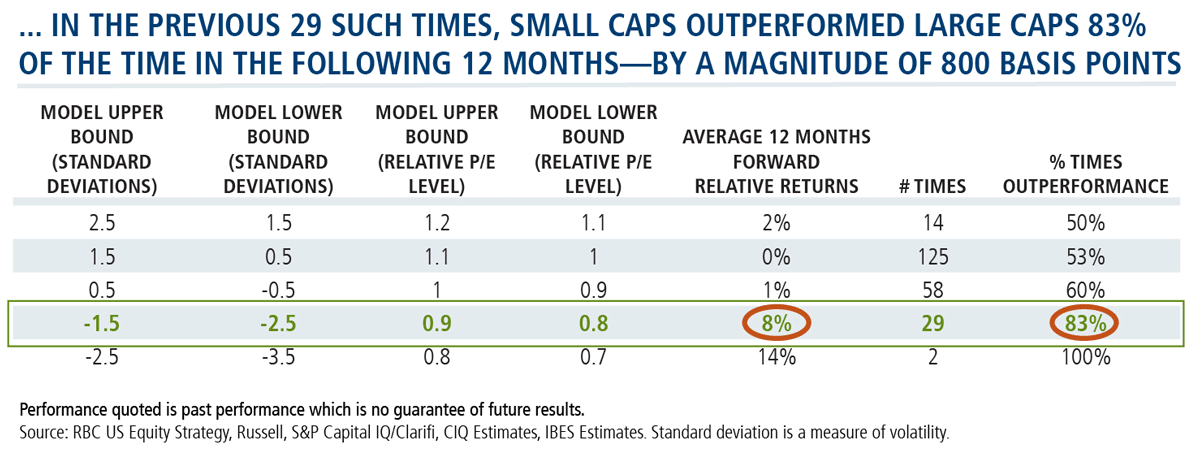
The chart below shows what Nelson has been saying for months—that small caps are inexpensive relative to large caps. They’re in the range of 0.8 to 0.9, or 1.5 to 2.5 standard deviations below the midpoint.
Next look at the table that shows what has historically happened when small caps have been at 1.5 to 2.5 points below the midpoint in the range. As you can see, going forward from that point, small caps have outperformed large caps 83% of the time, and by a magnitude of eight percentage points or 800 basis points.
And here’s a look at the 300-day performance of small cap growth versus large cap growth. Again, small cap growth is so stretched to the downside that Nelson suggests investors could be approaching a “historic opportunity.”

Taken together, today’s factors look like an irresistible set-up to Nelson.
“We look for the asset class, now stretched to the downside, to mean-revert higher. CTSIX, also stretched to the downside, has historically mean-reverted higher,” he says. “Are there any ballplayers out there? We believe what we’re looking at right now is a fat pitch, an opportunity that could be worth swinging at.”
Financial advisors, if you’re doing the work now in anticipation of a small cap rally, talk to your Calamos Investment Consultant about CTSIX’s process for identifying companies with high, sustainable growth potential. Call 888-571-2567 or caminfo@calamos.com.
Click here to view CTSIX's standardized performance.
Before investing, carefully consider the fund’s investment objectives, risks, charges and expenses. Please see the prospectus and summary prospectus containing this and other information which can be obtained by calling 1-866-363-9219. Read it carefully before investing.
Opinions and estimates offered constitute our judgment and are subject to change without notice, as are statements of financial market trends, which are based on current market conditions. We believe the information provided here is reliable, but do not warrant its accuracy or completeness. This material is not intended as an offer or solicitation for the purchase or sale of any financial instrument. The views and strategies described may not be suitable for all investors. This material has been prepared for informational purposes only, and is not intended to provide, and should not be relied on for, accounting, legal or tax advice. References to future returns are not promises or even estimates of actual returns a client portfolio may achieve. Any forecasts contained herein are for illustrative purposes only and are not to be relied upon as advice or interpreted as a recommendation.
An investment in the Fund(s) is subject to risks, and you could lose money on your investment in the Fund(s). There can be no assurance that the Fund(s) will achieve its investment objective. Your investment in the Fund(s) is not a deposit in a bank and is not insured or guaranteed by the Federal Deposit Insurance Corporation (FDIC) or any other government agency. The risks associated with an investment in the Fund(s) can increase during times of significant market volatility. The Fund(s) also has specific principal risks, which are described below. More detailed information regarding these risks can be found in the Fund's prospectus.
The principal risks of investing in the Calamos Timpani Small Cap Growth Fund include: equity securities risk consisting of market prices declining in general, growth stock risk consisting of potential increased volatility due to securities trading at higher multiples, and portfolio selection risk. The Fund invests in small capitalization companies, which are often more volatile and less liquid than investments in larger companies. As a result of political or economic instability in foreign countries, there can be special risks associated with investing in foreign securities, including fluctuations in currency exchange rates, increased price volatility and difficulty obtaining information. In addition, emerging markets may present additional risk due to potential for greater economic and political instability in less developed countries.
The Russell 2000 Growth Index is a composite of small cap companies located in the U.S. that also exhibit a growth probability.
The S&P 500 Index is generally considered representative of the U.S. stock market.
The Russell 1000 Growth Index measures the performance of those Russell 1000 companies with higher price-to-book ratios and higher forecasted growth values.
Price-to-earnings ratio (P/E) is a valuation ratio of a company's current share price compared to its per-share earnings.
Standard deviation is a measure of volatility.
801846 0120
Archived material may contain dated performance, risk and other information. Current performance may be lower or higher than the performance quoted in the archived material. For the most recent month-end fund performance information visit www.calamos.com. Archived material may contain dated opinions and estimates based on our judgment and are subject to change without notice, as are statements of financial market trends, which are based on current market conditions at the time of publishing. We believed the information provided here was reliable, but do not warrant its accuracy or completeness. This material is not intended as an offer or solicitation for the purchase or sale of any financial instrument. The views and strategies described may not be suitable for all investors. This material has been prepared for informational purposes only, and is not intended to provide, and should not be relied on for, accounting, legal or tax advice. References to future returns are not promises or even estimates of actual returns a client portfolio may achieve. Any forecasts contained herein are for illustrative purposes only and are not to be relied upon as advice or interpreted as a recommendation.
Performance data quoted represents past performance, which is no guarantee of future results. Current performance may be lower or higher than the performance quoted. The principal value and return of an investment will fluctuate so that your shares, when redeemed, may be worth more or less than their original cost. Performance reflected at NAV does not include the Fund’s maximum front-end sales load. Had it been included, the Fund’s return would have been lower.
Archived on January 05, 2021