What Could An Income and Equity Alternative Do for a 60/40 Portfolio? Meet the Half Caff
First published: November 11, 2021
We get it. It’s hard to quit something that’s been reliable for so many years, and a concept that’s straightforward to explain to clients. But at this point can we all agree that the traditional 60% stock/40% bond portfolio's days are numbered?
Investment professionals we talk to are looking for new ideas as they’re rebalancing. To reset back to a 60% allocation of unhedged long-only equity and a 40% allocation likely to generate just the skinniest of fixed income returns is to ignore today’s inflationary environment.
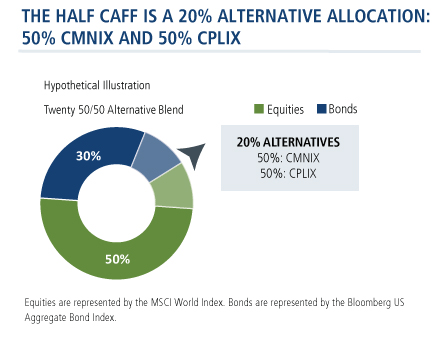
Instead, we propose a different sort of blend that we call the Half Caff, as inspired by coffee drinkers who like the jolt that caffeine provides but want to dial back on the accompanying jumpiness.
While it doesn’t have the storied history of the 60/40, the Half Caff is a combination of our alternatives (fixed income alt Calamos Market Neutral Income Fund/CMNIX and equity alt Calamos Phineus Long/Short Fund/CPLIX), introduced a few years ago that has stood the test of recent markets. (See this 2017 post, its sequel and this review of its 2020 resilience).
Here’s how it works:
- We take 10% from a traditional portfolio with 40% allocated to bonds (using the Bloomberg US Aggregate Bond Index as proxy).
- We take 10% from a traditional portfolio with 60% allocated to equities (using the MSCI World Index as proxy).
- From that 20%, we allocate half to CMNIX as the fixed income alternative and half to CPLIX as the equity alternative.
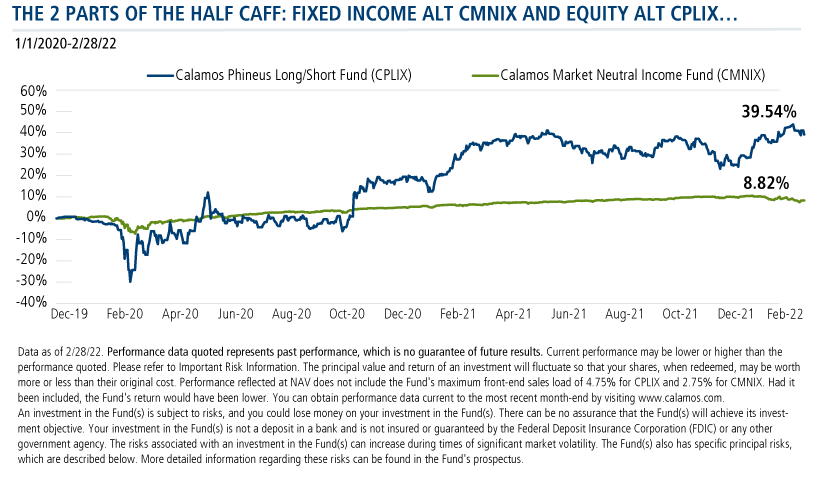
Below are the very different performance paths of the two funds over the last two years.
Fixed income alternative Calamos Market Neutral Income Fund (CMNIX) is distinguished by the slope of its line, particularly after the COVID-19 shock to the market in March 2020. Calamos Phineus Long/Short Fund (CPLIX)’s objective, though, is to engage equity risk—and outperform over time. Both funds lived up to their billing.
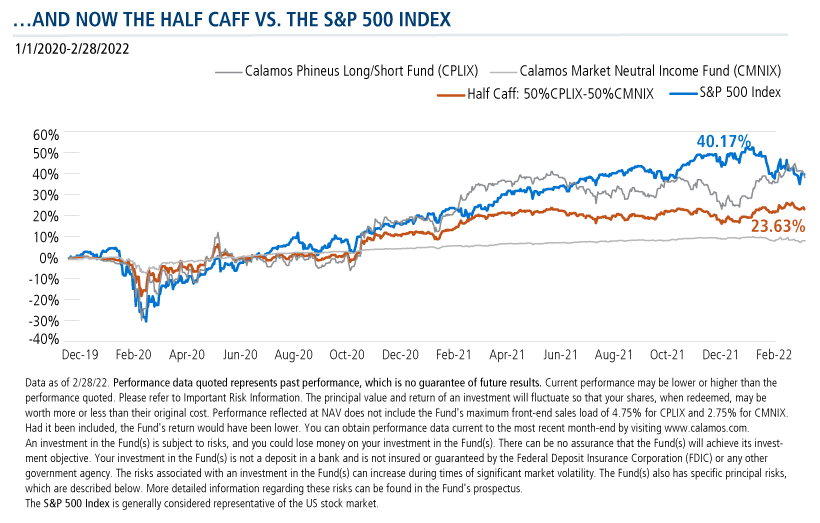
We've added two more lines to the chart below—one tracks the S&P 500 Index and the other the performance of an investment that was 50/50 CMNIX/CPLIX. The client in the Half Caff, as you can see, was subject to shallower drawdowns and fewer dips. A less caffeinated ride via the alternative blend resulted in a 23.63% gain for the period, and may have not interfered with the client’s sleeping at night.
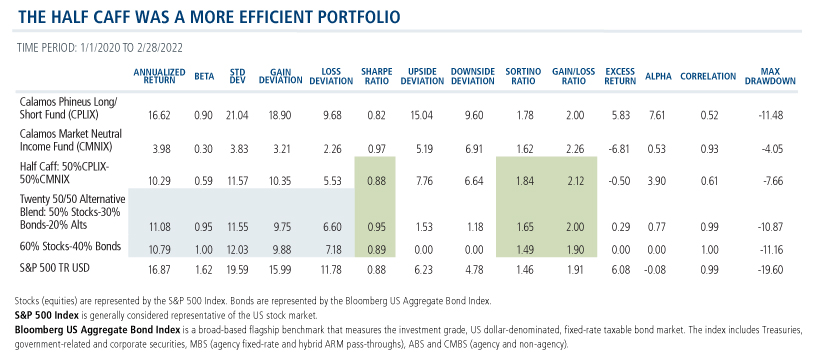
The benefits of portfolio diversification come from adding assets that have lower correlations to one another to reduce risk concentration. That's the underlying premise of using liquid alts that deviate some way from a traditional stock and bond portfolio. But some alternative allocations are more efficient than others. In our view, alternatives used to diversify a portfolio should better shield it from market volatility, ultimately leading to more favorable risk-adjusted returns.
Below we draw on the work of Elise Pondel, CFA, Calamos AVP, Director of Product Analytics, to explore some of the assumptions of the hypothetical illustration. We provide performance data, but also evaluate the combination following the standards the Product team recommends when evaluating an alt (see this post).

Does the blend:
- Meet the portfolio objective for implementation?
- Perform as expected?
- Diversify risks?
- Improve the efficient frontier of portfolio?
(A fifth important question—Does it complement current managers?—we can’t answer here, but contact your Calamos Investment Consultant for customized follow-up.)
Before we look at the power of the Half Caff, let’s first look at what each fund has accomplished on its own.
Fixed Income Diversifier: CMNIX
Calamos Market Neutral Income Fund (CMNIX) is a diversifier. Prior to 2021, bonds had been a significant contributor to the performance of the 60/40 portfolio. However, last year traditional asset allocation didn’t carry the portfolio as it has previously (see post), and few expect fixed income investments to provide the level of returns they have historically.
Adding a fixed income alternative can provide diversification against fixed income exposures, such as duration and credit risk, while providing returns and a risk profile consistent with the characteristics of an intermediate-term bond fund.
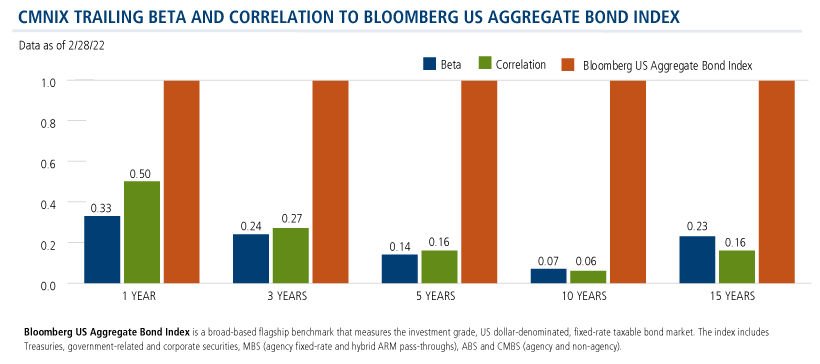
Depending on the time period, CMNIX has had lower beta and correlations with the Bloomberg US Aggregate Bond Index.
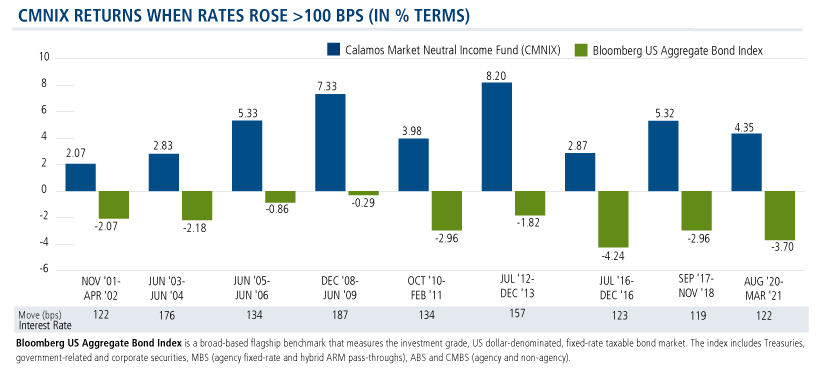
And what’s especially relevant today: CMNIX’s alternative sources of returns have generated positive performance during past periods of rising interest rates.
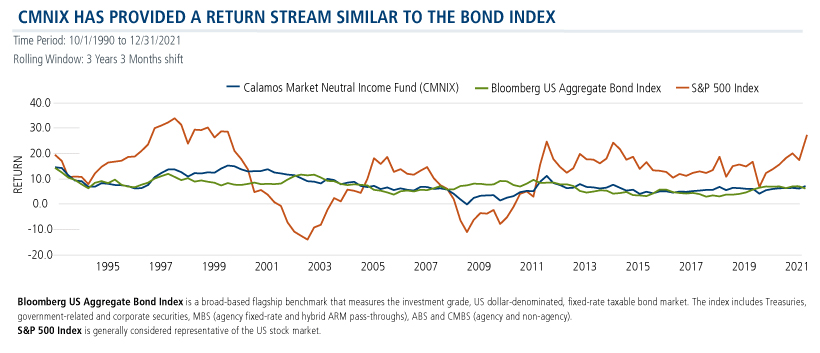
A fixed income alternative must do more than hedge against duration risk. It’s imperative to find in the alternative a consistent performer capable of providing a similar return stream. As shown in the three-year rolling returns below, since its inception, CMNIX provided a return stream similar to that of the bond index.
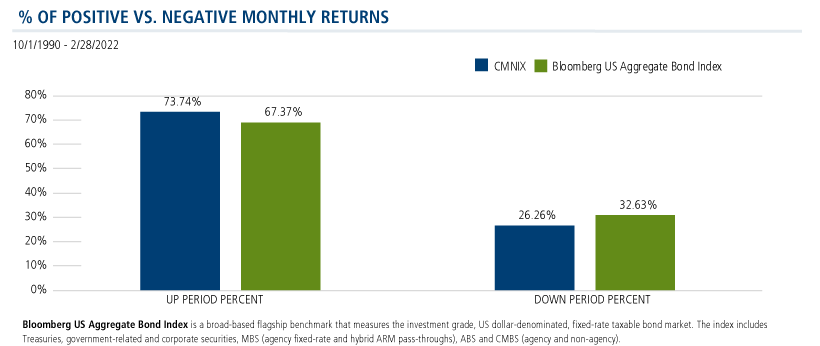
What’s more, CMNIX enjoyed a greater number of positive months and fewer negative months.
Equity Hedge: CPLIX
Equity risk is the dominant risk in most portfolios. During periods of market stress especially, correlations between asset classes increase—which exposes the portfolio to potentially large drawdowns. CPLIX can be used to address the market risk from long-only equity strategies because it has the ability to benefit from both stocks that are appreciating in price (the long book) and from those that are declining (the short book).
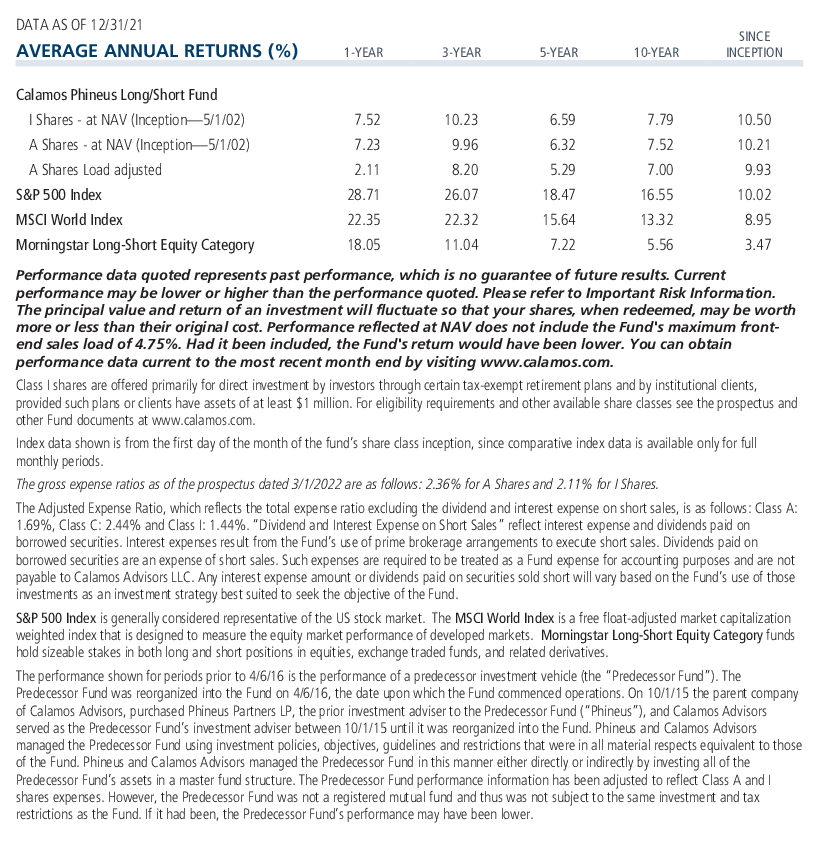
Since CPLIX’s inception, it has provided equity-like returns with lower correlations to equities, diversifying the equity risk in the portfolio while providing strong risk-adjusted returns.
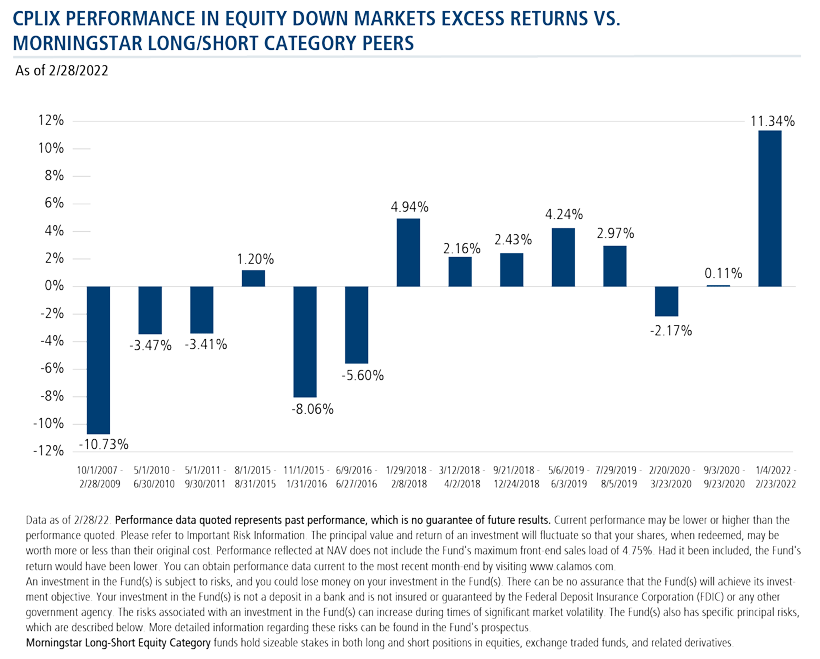
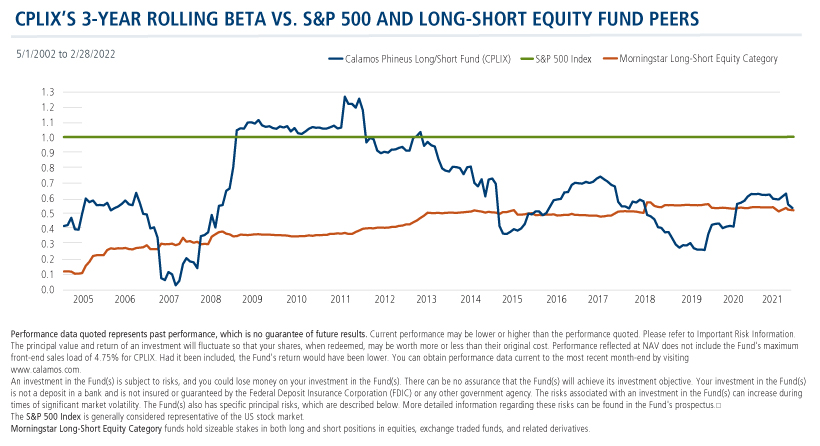
Most funds in the Morningstar Long/Short Equity category are focused on hedging the S&P. CPLIX is not long light as we have repeatedly stressed (see this post). By that we mean that CPLIX differs from its peers in that the fund is active in its management of equity risk.
This has led to both periods of taking on greater market risk and periods where market risk was minimized. Two examples:
- In December 2017, CPLIX had negative beta as the fund prepared for capital preservation and expected heightened market volatility in 2018.
- On the flipside, last March Michael Grant, Calamos Co-CIO, Head of Long/Short Strategies and CPLIX Senior Co-Portfolio Manager, believed it was time to lean into equities, increasing the delta-adjusted average equity exposure to the net 50%-60% range.
- Also, see this post about how CPLIX demonstrated its ability to diversify equity exposure in January 2022. The fund returned 7.39% in a month when the S&P 500 was down -5.17%.
CPLIX’s ability to tactically adjust its market exposure creates opportunities to diversify the alpha generation relative to long-only equities.
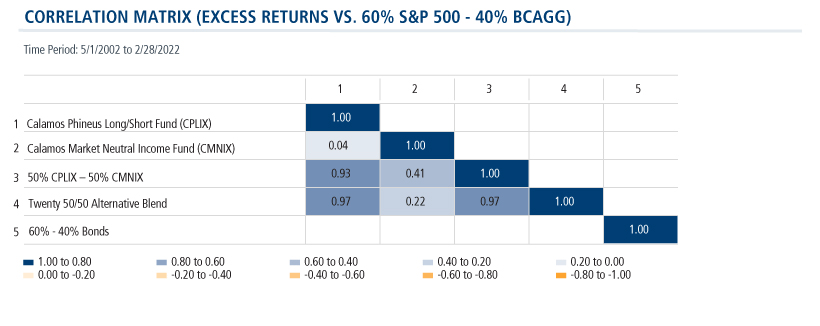
An Uncorrelated Pair
The low to negative excess returns between CMNIX and CPLIX and the blend of CMNIX/CPLIX suggest that adding this pair of funds to a traditional 60/40 portfolio can be additive as these funds earned their excess returns during different market periods.
The table below tells you all you need to know about the benefits of a Half Caff allocation. It can create a more efficient portfolio (improves the risk-adjusted returns—see the Sharpe and Sortino ratios). It can improve the return distribution profile. The Half Caff has provided significantly greater upside potential while reducing the downside (see the Gain vs. Loss Deviation and Gain/Loss Ratio).
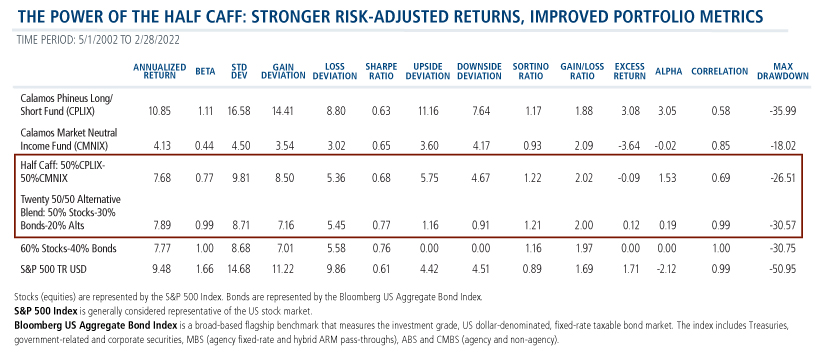
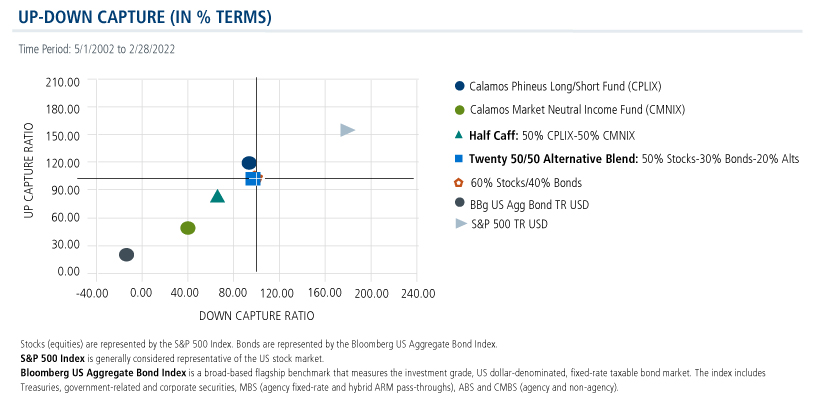
This translates to an improved up/down capture profile.
Added to the Menu
A change of climate often inspires a refresh to the menu, so here’s a Half Caff variation to consider. Investment professionals interested in a bigger boost are adding a bit more “caff” (CPLIX) to their blend, with results as shown below.

Investment professionals, talk to your Calamos Investment Consultant about how the Half Caff—or the new variation—might make a difference in your portfolios. Call 888-571-2567 or email caminfo@calamos.com.
Before investing, carefully consider the fund’s investment objectives, risks, charges and expenses. Please see the prospectus and summary prospectus containing this and other information which can be obtained by calling 1-866-363-9219. Read it carefully before investing.
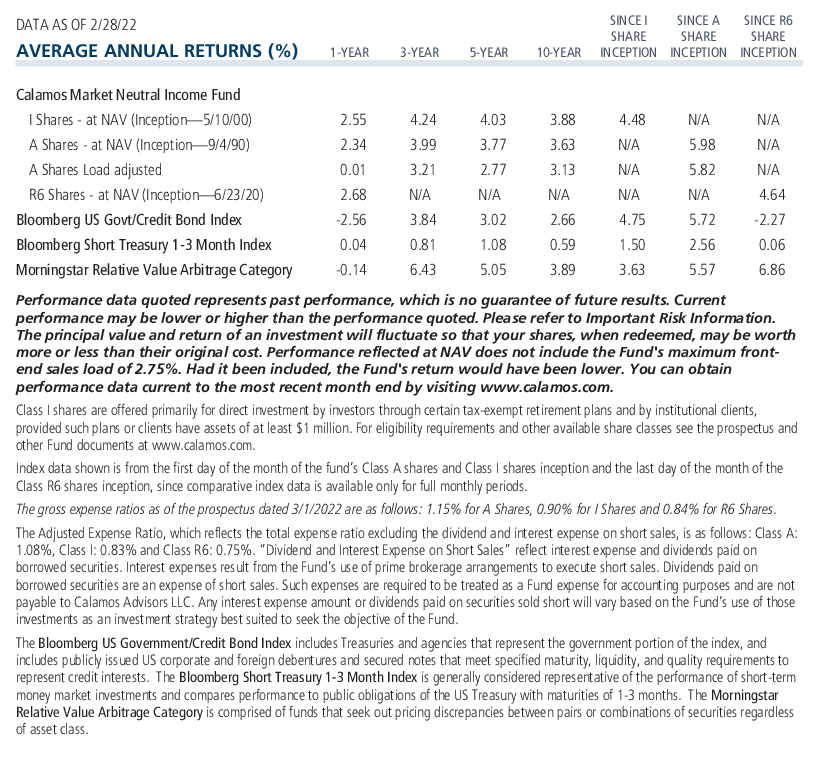
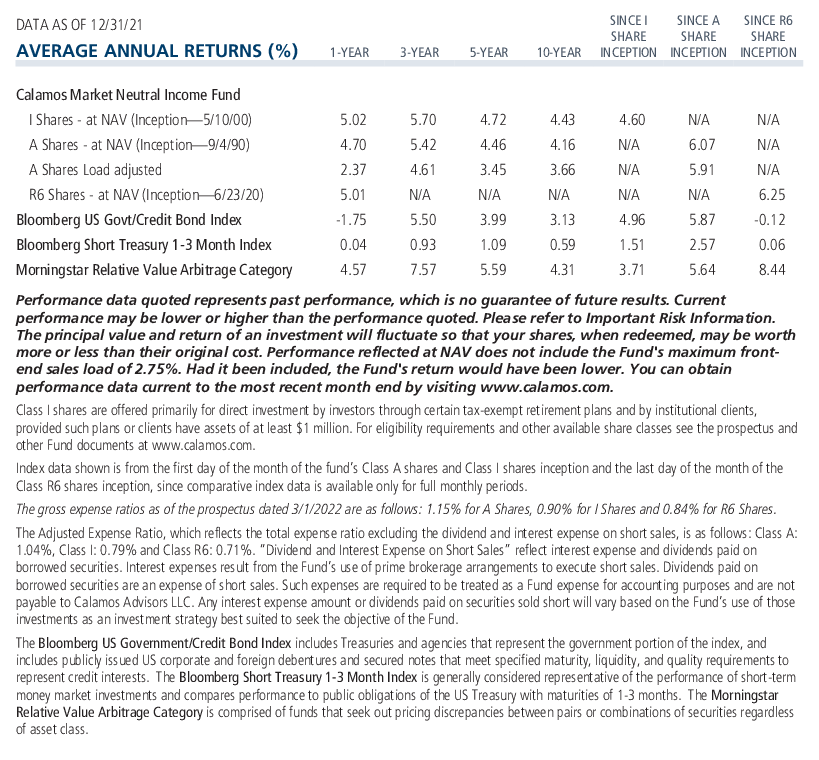
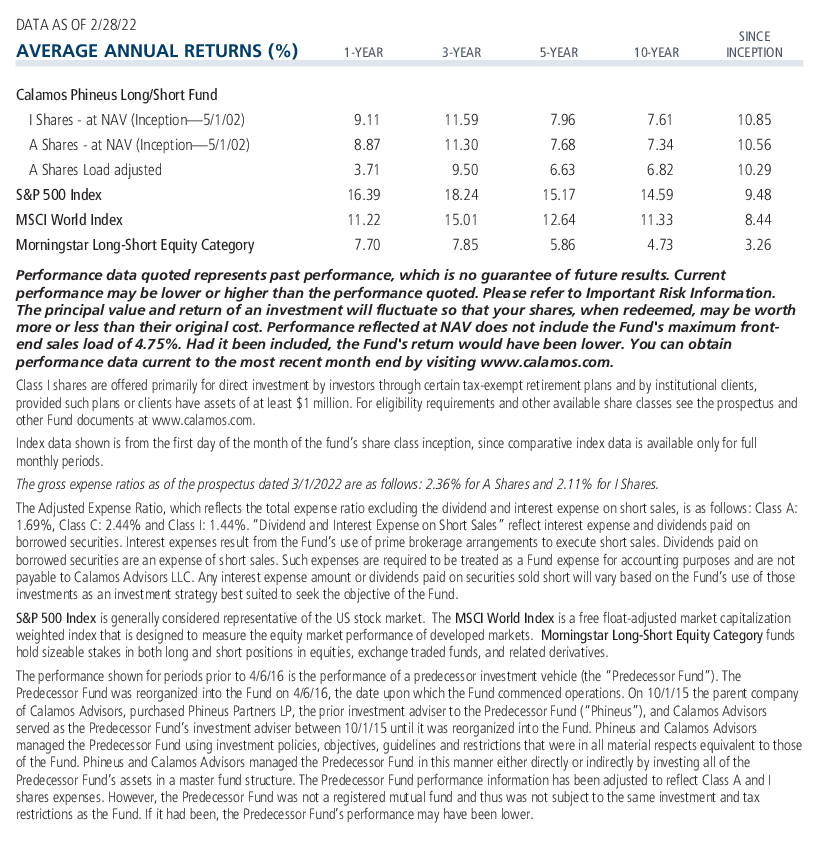
The performance shown in this post is hypothetical in nature and does not represent the performance and/or investment risk characteristics of any specific client. While the performance listed for each respective Investment Professional is based on actual performance, the aggregate portfolio performance, allocations listed and account comparisons shown are hypothetical in nature, as no actual clients are invested in these blended strategies. Hypothetical performance results have many inherent limitations, including those described below:
- Hypothetical performance results are generally prepared with the benefit of hindsight.
- There are limitations inherent in model results, such results do not represent actual trading and that they may not reflect the impact that material economic and market factors might have had on the advisor's decision making if the advisor were actually managing clients' money. In the hypothetical accounts shown actual 3rd party advisor performance has been blended in various allocations.
- The hypothetical performance shown does not involve financial risk, and no hypothetical performance calculation can completely account for the impact of financial risk on an actual investment strategy.
- The ability to withstand actual losses or to adhere to a particular investment strategy in spite of losses are material points which can adversely affect actual performance results.
There are distinct differences between hypothetical performance results and the actual results subsequently achieved by a particular investment portfolio. No representation is being made that an account will or is likely to achieve profits or losses similar to those shown, and any investment may result in loss of principal.
As with any hypothetical illustration there can be additional unforeseen factors that cannot be accounted for within the illustrations included herein.
Hypothetical performance and index returns presented assume reinvestment of any and all earnings/distributions.
Some of the risks associated with investing in alternatives may include hedging risk–hedging activities can reduce investment performance through added costs; derivative risk–derivatives may experience greater price volatility than the underlying securities; short sale risk - investments may incur a loss without limit as a result of a short sale if the market value of the security increases; interest rate risk–loss of value for income securities as interest rates rise; credit risk–risk of the borrower to miss payments; liquidity risk–low trading volume may lead to increased volatility in certain securities; non-US government obligation risk–non-US government obligations may be subject to increased credit risk; portfolio selection risk – investment managers may select securities that fare worse than the overall market. Alternative investments may not be suitable for all investors.
Class I shares are offered primarily for direct investment by investors through certain tax-exempt retirement plans (including 401(k) plans, 457 plans, employer-sponsored 403(b) plans, profit sharing and money purchase pension plans, defined benefit plans and non-qualified deferred compensation plans) and by institutional clients, provided such plans or clients have assets of at least $1 million. Class I shares may also be offered to certain other entities or programs, including, but not limited to, investment companies, under certain circumstances.
An investment in the Fund(s) is subject to risks, and you could lose money on your investment in the Fund(s). There can be no assurance that the Fund(s) will achieve its investment objective. Your investment in the Fund(s) is not a deposit in a bank and is not insured or guaranteed by the Federal Deposit Insurance Corporation (FDIC) or any other government agency. The risks associated with an investment in the Fund(s) can increase during times of significant market volatility. The Fund(s) also has specific principal risks, which are described below. More detailed information regarding these risks can be found in the Fund’s prospectus.
The principal risks of investing in the Calamos Market Neutral Income Fund include: equity securities risk consisting of market prices declining in general, convertible securities risk consisting of the potential for a decline in value during periods of rising interest rates and the risk of the borrower to miss payments, synthetic convertible instruments risk, convertible hedging risk, covered call writing risk, options risk, short sale risk, interest rate risk, credit risk, high yield risk, liquidity risk, portfolio selection risk, and portfolio turnover risk.
Covered call writing: As the writer of a covered call option on a security, the fund foregoes, during the option’s life, the opportunity to profit from increases in the market value of the security, covering the call option above the sum of the premium and the exercise price of the call.
Convertible hedging risk: If the market price of the underlying common stock increases above the conversion price on a convertible security, the price of the convertible security will increase. The fund’s increased liability on any outstanding short position would, in whole or in part, reduce this gain.
Convertible securities risk: The value of a convertible security is influenced by changes in interest rates, with investment value declining as interest rates increase and increasing as interest rates decline. The credit standing of the issuer and other factors also may have an effect on the convertible security’s investment value.
The principal risks of investing in the Calamos Phineus Long/Short Fund include: equity securities risk consisting of market prices declining in general, short sale risk consisting of potential for unlimited losses, foreign securities risk, currency risk, geographic concentration risk, other investment companies (including ETFs) risk, derivatives risk, options risk, and leverage risk.
The Bloomberg Short Treasury 1-3 Month Index is generally considered representative of the performance of short-term money market investments and is provided to show how the Fund’s performance compares to public obligations of the US Treasury with maturities of 1-3 months.
Bloomberg US Government/Credit Index comprises long-term government and investment grade corporate debt securities and is generally considered representative of the performance of the broad US bond market. Unlike convertible bonds, US Treasury bills are backed by the full faith and credit of the US government and offer a guarantee as to the timely repayment of principal and interest.
Bloomberg US Aggregate Bond Index is a broad-based flagship benchmark that measures the investment grade, US dollar-denominated, fixed-rate taxable bond market. The index includes Treasuries, government-related and corporate securities, MBS (agency fixed-rate and hybrid ARM pass-throughs), ABS and CMBS (agency and non-agency).
The Morningstar Relative Value Arbitrage Category is comprised of funds that seek out pricing discrepancies between pairs or combinations of securities regardless of asset class.
Morningstar Large Blend Category funds are fairly representative of the overall US stock market in size, growth rates, and price. Stocks in the top 70% of the capitalization of the US equity market are defined as large-cap. The blend style is assigned to portfolios where neither growth nor value characteristics predominate. These portfolios tend to invest across the spectrum of US industries, and owing to their broad exposure, the portfolios' returns are often similar to those of the S&P 500 Index.
Morningstar Long-Short Equity Category funds hold sizeable stakes in both long and short positions in equities, exchange traded funds, and related derivatives.
S&P 500 Index is generally considered representative of the US stock market.
MSCI World Index is a market capitalization weighted index composed of companies representative of the market structure of 21 developed market countries in North America, Europe, and the Asia/Pacific region. Unmanaged index returns assume reinvestment of any and all distributions and do not reflect fees, expenses or sales charges. Investors cannot invest directly in an index.
Alpha is a historical measure of risk-adjusted performance. Alpha measures how much of a portfolio’s performance is attributable to investment-specific factors versus broad market trends. A positive alpha suggests that the performance of a portfolio was higher than expected given the level of risk in the portfolio. A negative alpha suggests that the performance was less than expected given the risk.
Beta is a historic measure of a fund’s relative volatility, which is one of the measures of risk; a beta of 0.5 reflects 1/2 the market’s volatility as represented by the Fund’s primary benchmark, while a beta of 2.0 reflects twice the volatility.
Correlation is a statistical measure that shows how two securities move in relation to each other. A correlation of 1 implies that if one security moves up or down, the other security will move in lockstep, in the same direction. Alternatively, a correlation of 1 means that if one security moves in either direction, the other security will do the exact opposite.
Credit ratings is a measure of a company’s credit worthiness and ability to service its debt. Ratings are relative, subjective and not absolute standards of quality. Ratings are measured using a scale that typically ranges from AAA (highest) to D (lowest). The security’s credit rating does not eliminate risk.
Duration is a measure of interest rate sensitivity.
Gain deviation Similar to standard deviation, except that this statistic calculates an average (mean) return for only the periods with a gain and then measures the variation of only the gain periods around this gain mean. This statistic measures the volatility of upside performance.
Gain/loss ratio Measures a fund's average gain in a gain period divided by the fund's average loss in a losing period.
Interest rate risk: The value of fixed-income securities generally decreases in periods when interest rates are rising. In addition, interest rate changes typically have a greater effect on prices of longer-term fixed-income securities than shorter-term fixed-income securities. Recent events in the fixed-income market may expose the Fund to heightened interest rate risk and volatility.
Kurtosis is a statistical measure that's used to describe the distribution, or skewness, of observed data around the mean, sometimes referred to as the volatility of volatility.
Loss deviation Similar to standard deviation, except that this statistic calculates an average (mean) return for only the periods with a loss and then measures the variation of only the losing periods around this loss mean. This statistic measures the volatility of downside performance.
Max drawdown A statistical measure that shows the maximum loss that occurred during any subperiod over the time period listed.
Sharpe ratio is a measure of risk-adjusted performance, where higher values are indicative of better investment decisions rather than the result of taking on a higher level of risk. Sharpe ratio is calculated by the difference between a portfolio’s return and a risk-free rate, often that of the 10-year Treasury bond, and dividing the result by the portfolio’s standard deviation.
Short-only equity: The strategy may incur a loss without limit as a result of a short sale if the market value of the security increases.
Short sale risk: The Fund may incur a loss (without limit) as a result of a short sale if the market value of the borrowed security increases between the date of the short sale and the date the Fund replaces the security. The Fund may be unable to repurchase the borrowed security at a particular time or at an acceptable price.
Standard deviation measures the overall risk of a fund.
Sortino ratio is the excess return over the risk-free rate divided by the downside semi-variance, and so it measures the return to "bad" volatility. (Volatility caused by negative returns is considered bad or undesirable by an investor, while volatility caused by positive returns is good or acceptable.)
Upside deviation measures only deviations above a specified benchmark.
Downside deviation measures only deviations below a specified benchmark.
Up-capture ratio is the statistical measure of an investment manager's overall performance in up-markets.
Down-capture ratio is a statistical measure of an investment manager's overall performance in down-markets.
Active management does not guarantee investment returns or eliminate the risk of loss.
As a result of political or economic instability in foreign countries, there can be special risks associated with investing in foreign securities, including fluctuations in currency exchange rates, increased price volatility and difficulty obtaining information. In addition, emerging markets may present additional risk due to potential for greater economic and political instability in less developed countries.
Opinions and estimates offered constitute our judgment and are subject to change without notice, as are statements of financial market trends, which are based on current market conditions. We believe the information provided here is reliable, but do not warrant its accuracy or completeness. This material is not intended as an offer or solicitation for the purchase or sale of any financial instrument. The views and strategies described may not be suitable for all investors. This material has been prepared for informational purposes only, and is not intended to provide, and should not be relied on for, accounting, legal or tax advice. References to future returns are not promises or even estimates of actual returns a client portfolio may achieve. Any forecasts contained herein are for illustrative purposes only and are not to be relied upon as advice or interpreted as a recommendation.
808569 0322
Archived material may contain dated performance, risk and other information. Current performance may be lower or higher than the performance quoted in the archived material. For the most recent month-end fund performance information visit www.calamos.com. Archived material may contain dated opinions and estimates based on our judgment and are subject to change without notice, as are statements of financial market trends, which are based on current market conditions at the time of publishing. We believed the information provided here was reliable, but do not warrant its accuracy or completeness. This material is not intended as an offer or solicitation for the purchase or sale of any financial instrument. The views and strategies described may not be suitable for all investors. This material has been prepared for informational purposes only, and is not intended to provide, and should not be relied on for, accounting, legal or tax advice. References to future returns are not promises or even estimates of actual returns a client portfolio may achieve. Any forecasts contained herein are for illustrative purposes only and are not to be relied upon as advice or interpreted as a recommendation.
Performance data quoted represents past performance, which is no guarantee of future results. Current performance may be lower or higher than the performance quoted. The principal value and return of an investment will fluctuate so that your shares, when redeemed, may be worth more or less than their original cost. Performance reflected at NAV does not include the Fund’s maximum front-end sales load. Had it been included, the Fund’s return would have been lower.
Archived on March 25, 2023Cookies
This website uses cookies. By continuing to use this website, you consent to the use of cookies. Learn more about our cookie usage.

