CMNIX’s Consistent Flows, Low Volatility Make This Alt ‘Easy to Own’
September 2, 2021
As we hope you know by now, Calamos Market Neutral Income Fund (CMNIX) is not your average liquid alternative fund. Marking its 31st birthday Saturday, the fund has a long record of performance over multiple market cycles—and your review of that performance will reveal remarkable consistency and downside risk mitigation (see this post for more).
Here’s a fresh reason to feel confident using CMNIX in your clients’ portfolios: Morningstar’s Mind the Gap study, released Monday, shows that the fund compares favorably not just to other Alternative category funds but to the averages of all other U.S. fund category groups. We explain below.
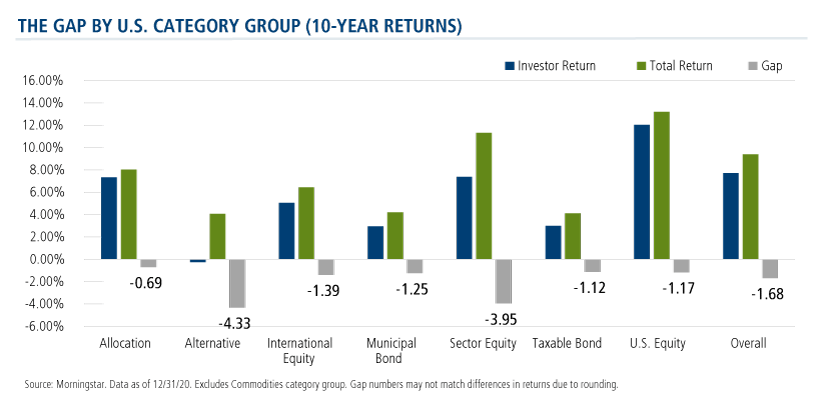
Conducted every year, the Morningstar study reports on the gap between total returns reported by mutual funds and ETFs and their dollar-weighted returns (also known as investor returns) over the 10 years ended December 31, 2020.
While investors earned about 7.7% per year on the average dollar they invested overall, that return was about 1.7 percentage points less than the total returns their fund investments generated over the same period, reported Morningstar.
“This shortfall, or gap, stems from inopportunely timed purchases and sales of fund shares, which cost investors nearly one-sixth the return they would have earned if they had simply bought and held,” according to Morningstar. The annual return gap reported this year is in line with gaps measured over the four previous rolling 10-year periods. Previous gaps ranged from 1.6 to 1.8 percentage points per year.
Alts Funds Can Be Difficult to Use Successfully
Average gaps in individual fund category groups run the gamut. The lowest is the 69 basis point average gap in the Allocation category group, whose investors earned a 7.35% return versus the 8.04% 10-year total return.
“By virtue of their diversified approach,” Morningstar explained, “allocation funds tend to have more stable performance and are easier to own than funds that are subject to more dramatic performance swings. Second, these funds are often used as core holdings for employer-sponsored retirement plans, such as 401(k)s. Retirement plan participants typically invest a set percentage of each paycheck, leading to more consistent cash flows into the underlying funds.”
On the other end of the spectrum, however, is the Alternatives category group. While the category produced a total return of 4.08% over the 10 years ended December 31, 2020, the average dollar invested lost about 0.25% annually—representing a gap of -4.33%.
“Monthly asset flows for alternatives funds have been the most volatile of any category group, but all of this trading activity has been counterproductive. Not only have alternative funds failed to live up to their promise, they've also proved difficult for investors to use effectively,” commented Morningstar about the group as a whole.
Which brings us to why CMNIX is special. Below you’ll see a comparison of its total return and investor return over the 1-, 3-, 5-and 10-year period as of July 31. CMNIX’s gap of 6 basis points over 10 years is a dramatic departure from the Alternatives’ average of 433 basis points.
If such a gap for the Alternatives category as a whole suggests that “investors have struggled to use alternative funds successfully,” and if the Allocation category gap of 69 basis points prompts Morningstar to declare that Allocation funds are “easier to own,” we’d submit that CMNIX’s skinny 6-basis point gap between total return and investor return means that the fund is also “easy to own.”
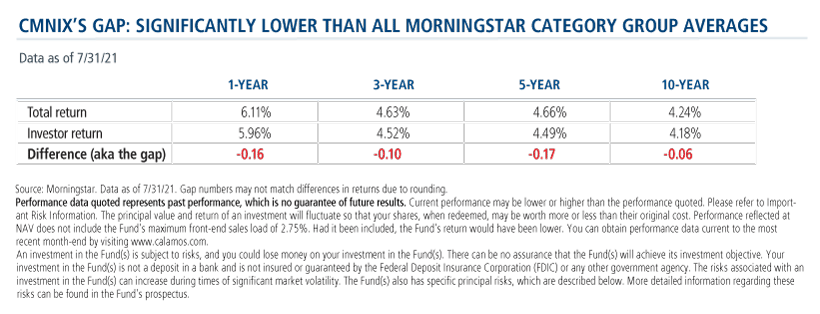
The gap “is exactly what investment professionals should expect,” says Shawn Park, Calamos Vice President, Product Management & Analytics. “CMNIX has been a steady Eddie, with little volatility, whose investors have kept their money invested.”
Investment professionals, for more information about CMNIX, please talk to your Calamos Investment Consultant at 888-571-2567 or caminfo@calamos.com. If you’re interested in tracking weekly flows into Morningstar alternative fund categories and performance data, subscribe to the Calamos Weekly Alternatives Snapshot.
Before investing, carefully consider the fund’s investment objectives, risks, charges and expenses. Please see the prospectus and summary prospectus containing this and other information which can be obtained by calling 1-866-363-9219. Read it carefully before investing.
The principal risks of investing in Calamos Market Neutral Income Fund include: equity securities risk consisting of market prices declining in general, convertible securities risk consisting of the potential for a decline in value during periods of rising interest rates and the risk of the borrower to miss payments, synthetic convertible instruments risk, convertible hedging risk, covered call writing risk, options risk, short sale risk, interest rate risk, credit risk, high yield risk, liquidity risk, portfolio selection risk, and portfolio turnover risk.
807489 921
Archived material may contain dated performance, risk and other information. Current performance may be lower or higher than the performance quoted in the archived material. For the most recent month-end fund performance information visit www.calamos.com. Archived material may contain dated opinions and estimates based on our judgment and are subject to change without notice, as are statements of financial market trends, which are based on current market conditions at the time of publishing. We believed the information provided here was reliable, but do not warrant its accuracy or completeness. This material is not intended as an offer or solicitation for the purchase or sale of any financial instrument. The views and strategies described may not be suitable for all investors. This material has been prepared for informational purposes only, and is not intended to provide, and should not be relied on for, accounting, legal or tax advice. References to future returns are not promises or even estimates of actual returns a client portfolio may achieve. Any forecasts contained herein are for illustrative purposes only and are not to be relied upon as advice or interpreted as a recommendation.
Performance data quoted represents past performance, which is no guarantee of future results. Current performance may be lower or higher than the performance quoted. The principal value and return of an investment will fluctuate so that your shares, when redeemed, may be worth more or less than their original cost. Performance reflected at NAV does not include the Fund’s maximum front-end sales load. Had it been included, the Fund’s return would have been lower.
Archived on September 02, 2022