The Value of a Second Opinion: Review Notes from Our Portfolio Analytics Team
December 14, 2021
First published: August 20, 2019
The stories you are about to read are true. Only the names have been changed to protect the innocent.
When you see as many portfolios in a year as the Calamos Portfolio Analytics team, patterns of portfolio missteps begin to emerge. Our team is always happy to help one-on-one but in this post—and because we’re all friends here—we share some findings recently highlighted by our Elise Pondel, CFA, AVP, Product Management and Analytics.
“Our goal is to provide an independent review of an advisor’s model. Ultimately, we want to help the advisor evaluate the potential trade-offs in their models in order to achieve their desired results,” as Pondel says.
Overlap Analysis
As a first step, the team looks to identify risks, starting with overlap—whether at the strategy, sector or common holding level. Portfolios using ETFs are especially vulnerable to overlap, she says.
There are four ETFs in the common holdings matrix shown below, which comprise one advisor’s entire equity allocation. He had a very concentrated model and he indicated prior to the review that he was interested in low volatility funds that were non-correlated to each other.
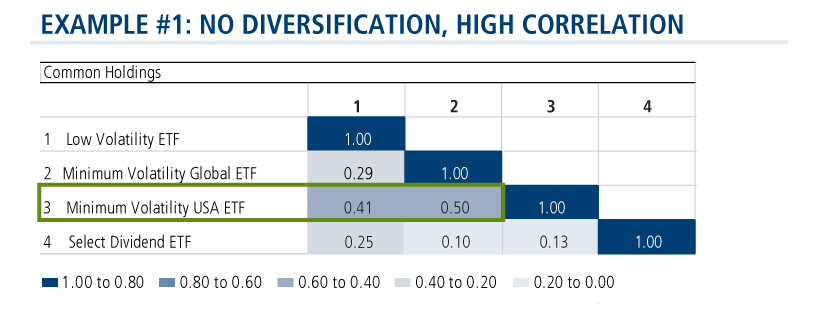
“Right off the bat without doing any analysis, we could identify that there’s definitely going to be high correlation,” Pondel says, “because the first three are minimum volatility ETFs, and they’re all essentially looking to invest in the same group of stocks. The third fund had about a 50% overlap with the first two.”
Findings
- The advisor’s equity portfolio is not as diversified as he thinks it is.
- He wasn’t meeting his own requirements of building a portfolio with non-correlated holdings.
Diversification and Allocation Analysis
We often run into models that are overdiversified or underallocated.
Recently, the team was asked to look at a fixed-income model with the goal of identifying where our fixed income alternative Calamos Market Neutral Income Fund (CMNIX) would fit.
“The model had 22 funds including six strategic income, three floating rate and six core-plus bond funds. The question wasn’t really how to add CMNIX, it was how to consolidate the model,” says Pondel. The greater number of funds in a model the lower the contribution any one fund will have on the allocation.
And then there’s this alternatives review the team conducted. The advisor had a 10% allocation to alternatives and within that he had 1% allocated to the gold ETF (GLD). The advisor was firm about keeping the gold ETF because he was using it as a hedge against equity declines.
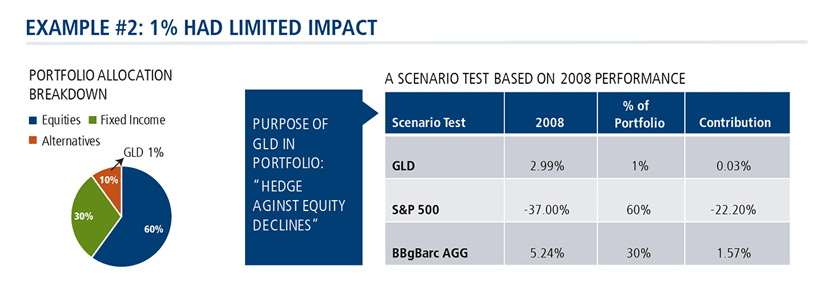
“A 1% allocation to gold did not provide any sort of base to the portfolio when equities fell,” says Pondel. “We used 2008 as an example in the scenario test, and I know it’s a very extreme example, but it helps drive the point home.”
Gold returned 3% in 2008. A 1% allocation in the advisor’s very same portfolio added 3 basis points of performance. That’s a start but when 60% of the portfolio is down 37%, 3 basis points may be close to meaningless, noted Pondel.
Finding: Increase the allocation in order to meet expectations.
Risk Model Disconnect
Given Calamos’ leadership in liquid alternatives, the team often finds itself helping advisors identify sources of return and understand how other funds generate returns.
“Some advisors pick funds based on performance and they don’t really understand the risks that they’re taking in their portfolio,” says Pondel. “We can help identify past ideal market conditions for funds and also when funds underperformed, so we can analyze potentially complementary funds.”
Once in a while the team works with advisors who have risk models but their allocations don’t align with the risk model.
One advisor had three risk models: conservative, moderate and aggressive. The conservative model allocated 30% to fixed income and 70% to equity. Pondel compared that model to the advisor’s firm’s asset allocation model recommendations and found that the firm was recommending the opposite (70% fixed income/30% equity).
To work with the advisor, Pondel created two conservative growth model portfolios, one of the advisor’s and one of the firm’s. She compared the average loss and the maximum drawdown over the past 10 years to highlight that his model experienced loss and drawdowns of more than twice the firm’s recommended model.
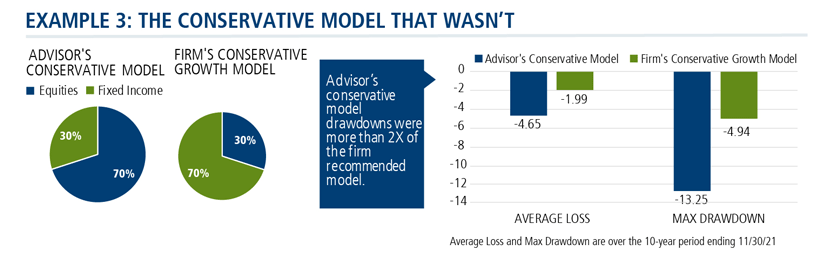
Finding: Increase the fixed income allocation for a conservative model.
Toward a More Efficient Frontier
Pondel describes the analytics team’s ultimate goal as improving the efficient frontier of an advisor’s model, by increasing the Sharpe and Sortino ratios. This can be done by adding funds that have not been correlated to the current model or by adding funds with historical higher risk-adjusted returns.
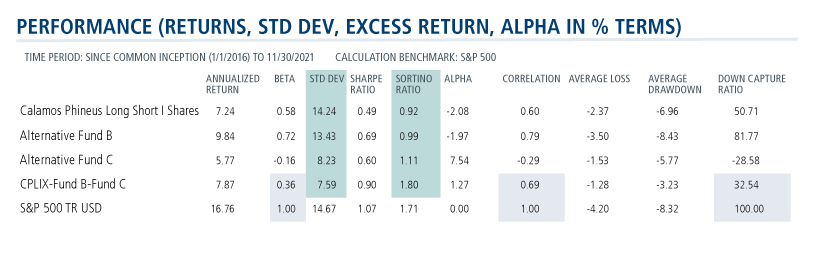
The example below shows an equity alternative portfolio that includes Calamos Phineus Long/Short Fund (CPLIX) at the advisor’s request. She also selected two other equity alternatives, also strong performers in their categories. “They have diverse strategies that have performed really well together when included in a portfolio so I included the correlation matrix to highlight the moderate to negative correlation these funds share with each other."
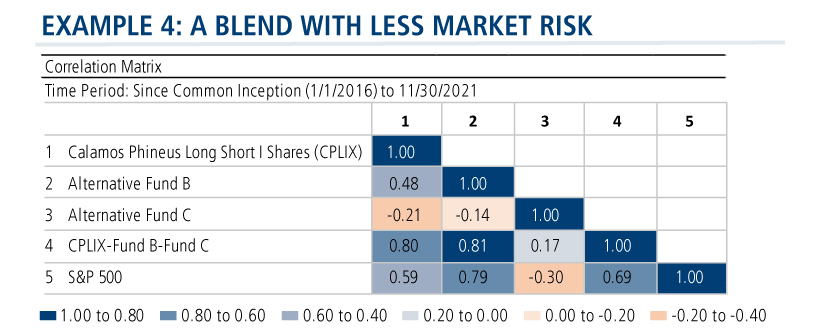
This flows through to the risk-adjusted returns, as demonstrated by the Sortino ratio. This blend demonstrated a more efficient portfolio than equities on their own and it also had a higher Sortino ratio than any of these funds would have achieved on their own. Essentially, according to Pondel, “we created an equity alternative portfolio with potentially one-third of the market risk and only one-third of the down capture.”
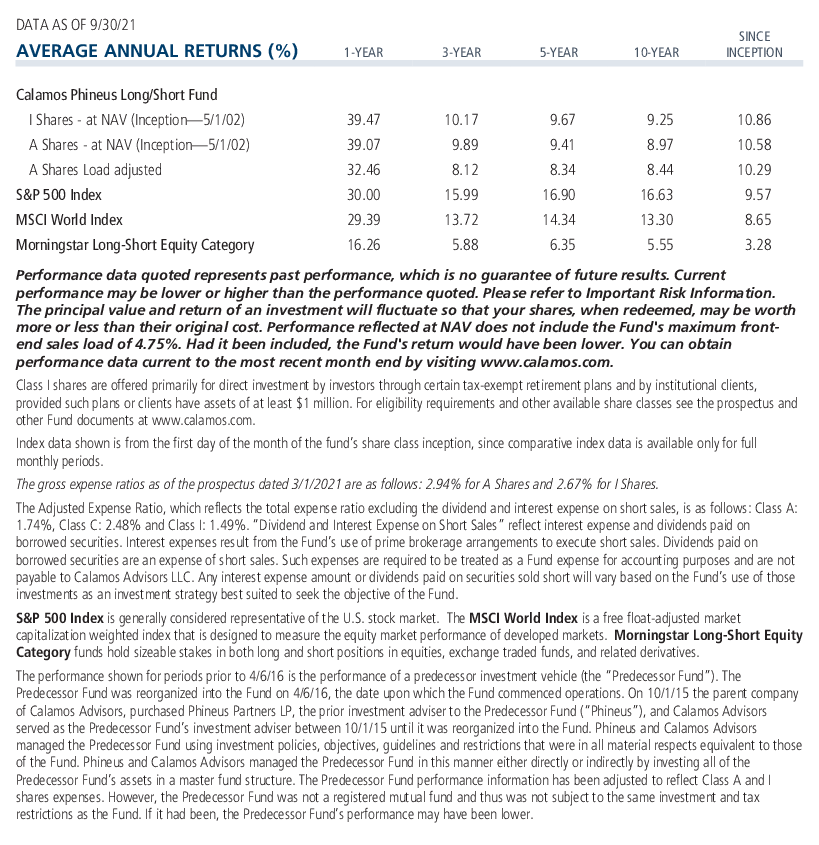
Performance data quoted represents past performance, which is no guarantee of future results. Current performance may be lower or higher than the performance quoted. Please refer to Important Risk Information. The principal value and return of an investment will fluctuate so that your shares, when redeemed, may be worth more or less than their original cost. Performance reflected at NAV does not include the Fund's maximum front-end sales load of 4.75%. Had it been included, the Fund's return would have been lower.
The performance shown for periods prior to 4/6/16 is the performance of a predecessor investment vehicle (the “Predecessor Fund”). The Predecessor Fund was reorganized into the Fund on 4/6/16, the date upon which the Fund commenced operations. On 10/1/15 the parent company of Calamos Advisors, purchased Phineus Partners LP, the prior investment adviser to the Predecessor Fund (“Phineus”), and Calamos Advisors served as the Predecessor Fund’s investment adviser between 10/1/15 until it was reorganized into the Fund. Phineus and Calamos Advisors managed the Predecessor Fund using investment policies, objectives, guidelines and restrictions that were in all material respects equivalent to those of the Fund. Phineus and Calamos Advisors managed the Predecessor Fund in this manner either directly or indirectly by investing all of the Predecessor Fund’s assets in a master fund structure. The Predecessor Fund performance information has been adjusted to reflect Class A and I shares expenses. However, the Predecessor Fund was not a registered mutual fund and thus was not subject to the same investment and tax restrictions as the Fund. If it had been, the Predecessor Fund’s performance may have been lower.
She then highlighted that CPLIX and Fund B both have equity-like volatility—“but because of their diverse strategies and the lower correlation, blending these funds together creates a model with much lower volatility. The results: volatility of the model portfolio was lower than any one fund achieved on its own, with half of the volatility potential of the equity market.”
Finding: Blending funds with diverse strategies and lower correlations can create a more efficient portfolio.
Financial advisors, to learn about how our Portfolio Analytics service may help you, contact your Calamos Investment Consultant at 888-571-2567 or caminfo@calamos.com.
Before investing, carefully consider the fund’s investment objectives, risks, charges and expenses. Please see the prospectus and summary prospectus containing this and other information which can be obtained by calling 1-866-363-9219. Read it carefully before investing.
Opinions and estimates offered constitute our judgment and are subject to change without notice, as are statements of financial market trends, which are based on current market conditions. We believe the information provided here is reliable, but do not warrant its accuracy or completeness. This material is not intended as an offer or solicitation for the purchase or sale of any financial instrument. The views and strategies described may not be suitable for all investors. This material has been prepared for informational purposes only, and is not intended to provide, and should not be relied on for, accounting, legal or tax advice. References to future returns are not promises or even estimates of actual returns a client portfolio may achieve. Any forecasts contained herein are for illustrative purposes only and are not to be relied upon as advice or interpreted as a recommendation.
The principal risks of investing in the Calamos Market Neutral Income Fund include: equity securities risk consisting of market prices declining in general, convertible securities risk consisting of the potential for a decline in value during periods of rising interest rates and the risk of the borrower to miss payments, synthetic convertible instruments risk, convertible hedging risk, covered call writing risk, options risk, short sale risk, interest rate risk, credit risk, high yield risk, liquidity risk, portfolio selection risk, and portfolio turnover risk.
Covered Call Writing: As the writer of a covered call option on a security, the fund foregoes, during the option’s life, the opportunity to profit from increases in the market value of the security, covering the call option above the sum of the premium and the exercise price of the call.
Convertible Securities Risk: The value of a convertible security is influenced by changes in interest rates, with investment value declining as interest rates increase and increasing as interest rates decline. The credit standing of the issuer and other factors also, may have an effect on the convertible security’s investment value.
Convertible Hedging Risk: If the market price of the underlying common stock increases above the conversion price on a convertible security, the price of the convertible security will increase. The fund’s increased liability on any outstanding short position would, in whole or in part, reduce this gain.
Convertible Securities Risk: The value of a convertible security is influenced by changes in interest rates, with investment value declining as interest rates increase and increasing as interest rates decline. The credit standing of the issuer and other factors also may have an effect on the convertible security’s investment value.
The principal risks of investing in Calamos Phineus Long/Short Fund include: equity securities risk consisting of market prices declining in general, short sale risk consisting of potential for unlimited losses, foreign securities risk, currency risk, geographic concentration risk, other investment companies (including ETFs) risk, derivatives risk, options risk, and leverage risk.
Alternative investments are not suitable for all investors.
The S&P 500 Index is generally considered representative of the US stock market.
The Bloomberg US Aggregate Bond Index is a broad-based flagship benchmark that measures the investment grade, US dollar-denominated, fixed-rate taxable bond market. The index includes Treasuries, government related and corporate securities, MBS (agency fixed-rate and hybrid ARM pass-throughs), ABS and CMBS (agency and non-agency).
Alpha is a historical measure of risk-adjusted performance. Alpha measures how much of a portfolio’s performance is attributable to investment-specific factors versus broad market trends. A positive alpha suggests that the performance of a portfolio was higher than expected given the level of risk in the portfolio. A negative alpha suggests that the performance was less than expected given the risk.
Beta is a common measure of historic volatility, beta measures how much of an investment’s performance is attributable to market-wide factors (such as a rising stock market). An investment that goes up or down as much as a broad market measure has a beta of 1. An investment that captures only half of the market’s movements would have a beta of 0.5.
Correlation is a statistical measure that shows how two securities move in relation to each other. A correlation of 1 and -1 implies that if one security moves up or down, the other security will move in lockstep, in the same direction. Alternatively, a correlation of 1 and -1 means that if one security moves in either direction, the other security will do the exact opposite.
Downside capture ratio measures manager’s performance in down markets as defined by the named index. A down-market is defined as those periods (months or quarters) in which named index return is less than 0. In essence, it tells you what percentage of the down-market was captured by the manager. For example, if the ratio is 110%, the manager has captured 110% of the down-market and therefore underperformed the market on the downside.
Sharpe ratio is a calculation that reflects the reward per each unit of risk in a portfolio. The higher the ratio, the better the portfolio's risk-adjusted return is.
Sortino ratio is an excess return over the risk-free rate divided by the downside semi-variance, and so it measures the return to “bad” volatility. (Volatility caused by negative returns is considered bad or undesirable by an investor, while volatility caused by positive returns is good or acceptable.)
Standard deviation measures the overall risk of a fund.
801696 1221
Archived material may contain dated performance, risk and other information. Current performance may be lower or higher than the performance quoted in the archived material. For the most recent month-end fund performance information visit www.calamos.com. Archived material may contain dated opinions and estimates based on our judgment and are subject to change without notice, as are statements of financial market trends, which are based on current market conditions at the time of publishing. We believed the information provided here was reliable, but do not warrant its accuracy or completeness. This material is not intended as an offer or solicitation for the purchase or sale of any financial instrument. The views and strategies described may not be suitable for all investors. This material has been prepared for informational purposes only, and is not intended to provide, and should not be relied on for, accounting, legal or tax advice. References to future returns are not promises or even estimates of actual returns a client portfolio may achieve. Any forecasts contained herein are for illustrative purposes only and are not to be relied upon as advice or interpreted as a recommendation.
Performance data quoted represents past performance, which is no guarantee of future results. Current performance may be lower or higher than the performance quoted. The principal value and return of an investment will fluctuate so that your shares, when redeemed, may be worth more or less than their original cost. Performance reflected at NAV does not include the Fund’s maximum front-end sales load. Had it been included, the Fund’s return would have been lower.
Archived on December 14, 2022