Liquid Alts in 2021: Record AUM, Strongest Flows Since 2013—and Performance to Believe In
Elise Pondel, CFA, AVP, Director of Product Analytics
The last two years couldn’t have been more different, and 2022 is setting up as not just a different environment but one presenting challenges that many investors and even investment professionals have rarely encountered.
The return outlook over the next decade for equities and fixed income is muted. Even with January’s volatility, equities are not far from all-time market highs, with equity risk dominating portfolios. The unique interest rate environment and inflation expectations are challenging future total returns for fixed income and reducing their diversification potential.
It’s these challenges to the 60% stocks/40% bonds model that prompted investors in 2021 to more seriously consider alternatives—and that’s a key difference between 2021 and 2020.
Last year’s annual report was headlined Finally, the Market Test That Many Have Been Waiting For, acknowledging the performance of liquid alts in largely shielding investors from equity declines and keeping clients invested during churning markets. Asked to mitigate a particular risk or diversify sources of returns, alts largely delivered as expected. And yet, liquid alts in 2020 enjoyed a hollow victory as assets under management shrunk overall and negative net flows totaled $41.8 billion.
That is not the story of 2021. In 2021, traditional asset allocation didn’t carry the portfolio as it previously has.
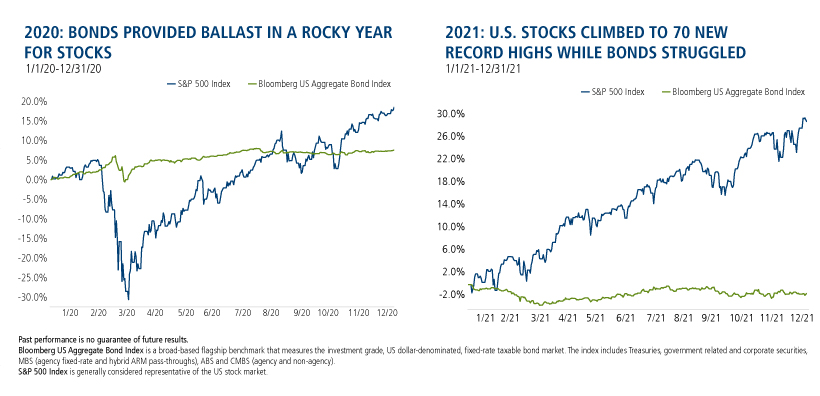
Investors—or more likely, their investment professionals—recognized that liquid alternatives can help diversify today’s market risks. In a reversal of a downward trend that started in 2014, last year there was unprecedented demand. Most important: the products’ performance met the demand. Liquid alternative assets reached a new high watermark in 2021, with almost all Morningstar categories benefiting from positive net flows and positive performance.
2021, we believe, was the market test that liquid alternatives themselves have been waiting for. Liquid alts' success in demonstrating their worth to a receptive marketplace in 2021 is a positive development, especially now that we've experienced almost one full month of 2022. Investors and the investment professionals who serve them are likely to need what the best alts have to offer in what promises to be a turbulent year.
Below is our fifth annual report on liquid alts. It's a closer look at the past year's asset growth, flows and performance by category—something we also cover every Monday in our weekly Alternative Snapshot (subscribe).
Liquid Alternatives 2021 Performance Review
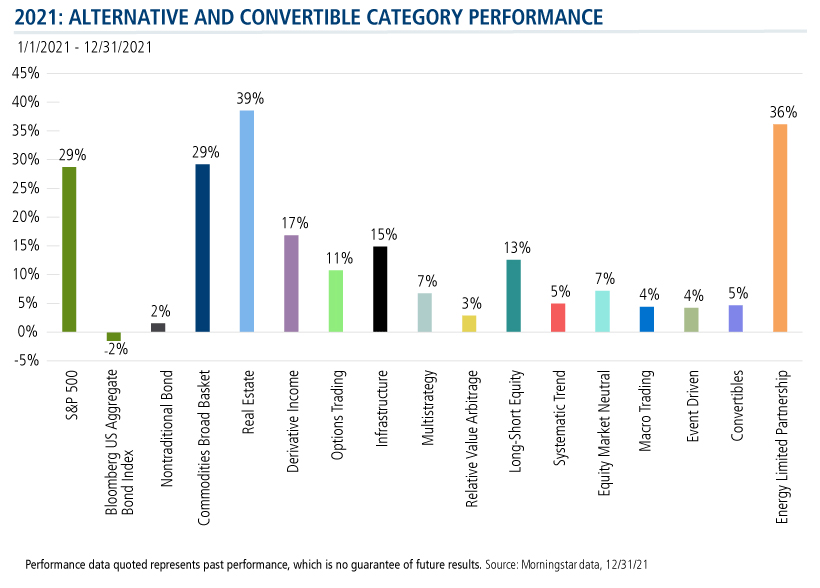
While 2021 wasn’t defined by one large market event as in 2020, it nonetheless endured its fair share of market volatility. All Morningstar liquid alternative categories reviewed below ended the year on a positive note. The Morningstar Commodities Broad Basket, Energy Limited Partnership and Real Estate Categories outperformed the S&P 500’s 28.7% gain.
Morningstar’s Category Changes
No review of liquid alternatives in 2021 would be complete without a mention of Morningstar’s reorganization of the categories midway through 2021. Morningstar explained that the changes were made to “better define the ever-evolving alternatives landscape and improve the information available to investors when considering these investments for their portfolios.” For more on the change, and their impact on Calamos alts, see this post.
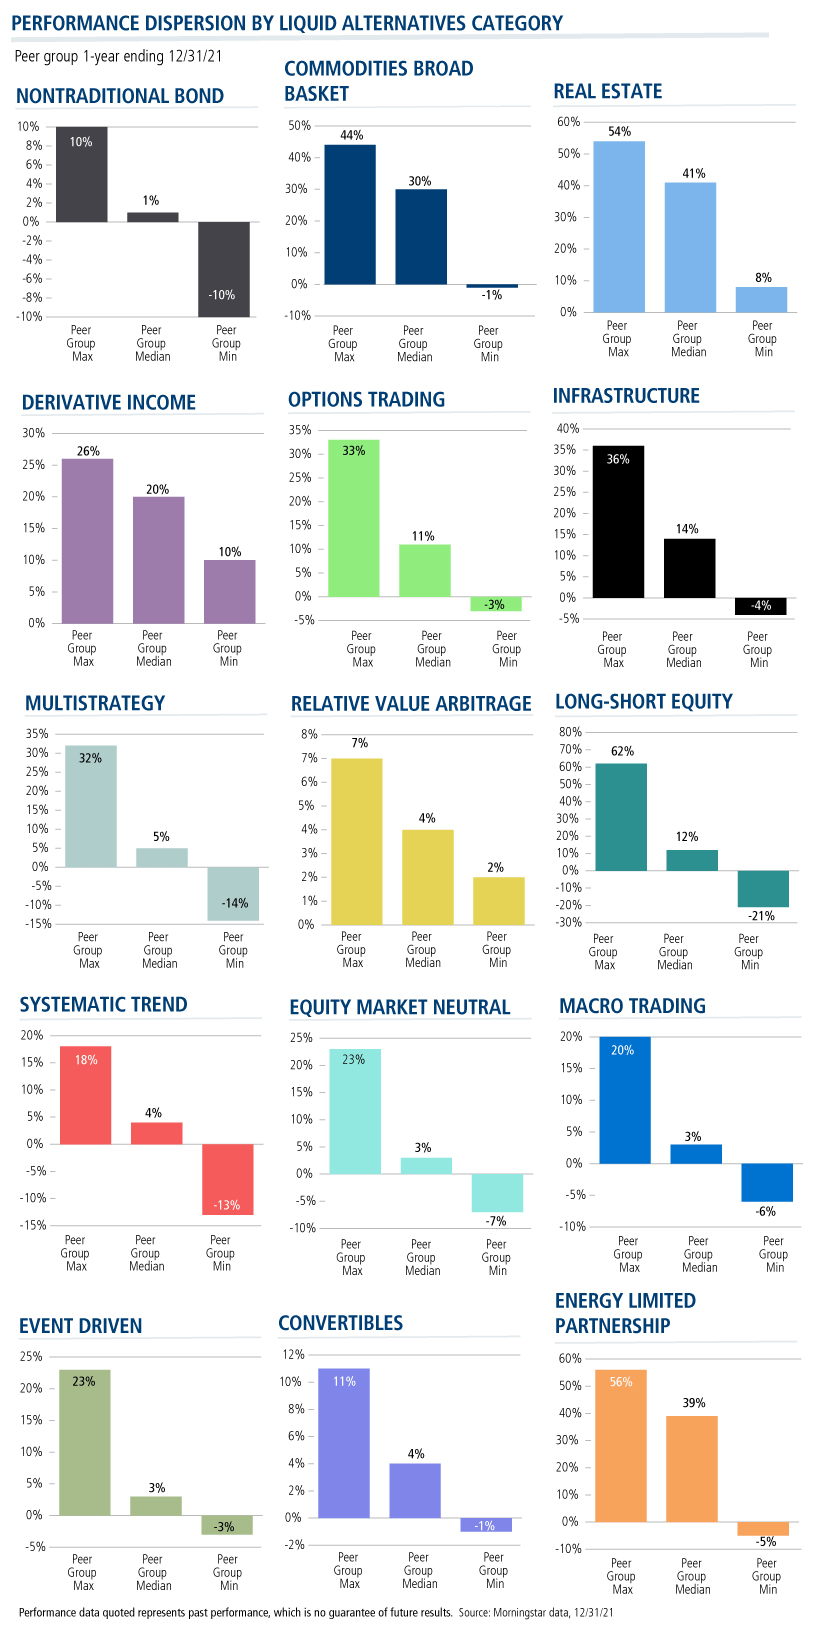
The importance of due diligence for liquid alternatives is imperative given the vast universe and options within a category. Within the categories there was wide dispersion in performance. Note the Long-Short Equity category experienced the greatest dispersion in performance. Funds in that category ended the year up 62% and down 21%, a difference of 83%. The top three performing categories, Commodities Broad Basket, Energy Limited Partnership, and Real Estate, all experienced high performance dispersion as well.
AUM Jumps in Liquid Alts
Thank You, Investment Professionals
Thanks to the confidence and support of investment professionals, fixed income alternative Calamos Market Neutral Income Fund (CMNIX) was 2021’s top-selling liquid alternative fund. Net inflows totaled $6.1 billion, according to Morningstar, helping Calamos rank as the third largest alternative fund provider.
All categories increased their Total Net Assets from last year with an overall 33% increase in assets totaling $707.4 billion on December 31, 2021. Real Estate, the largest category, ended the year with $239 billion in assets, up almost 50%.
Weekly flow-gathering was equally impressive. Options Trading, Relative Value Arbitrage, and Derivative Income categories enjoyed positive flows each week in 2021. Flows into Nontraditional Bond and Multistrategy categories were positive for 50 weeks with Event Driven, Equity Market Neutral, and Long-Short Equity Categories positive for 48 weeks. These flows confirm investors’ need for products providing portfolio diversification, performance consistency, alternative sources of income, and an equity hedge.
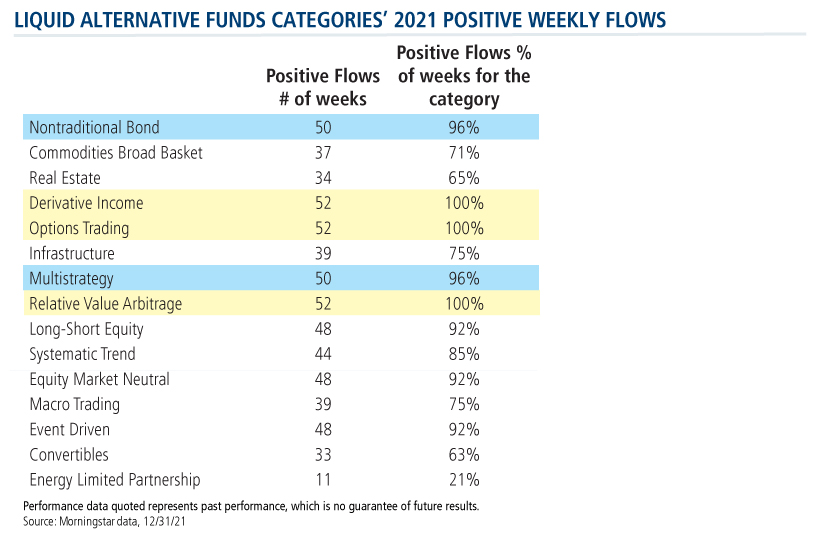
In aggregate, estimated net flows totaled $102.7 billion in 2021. A positive year after three consecutive years of negative net flows and the strongest positive year since 2013.
Without any further ado, and for your interactive analysis, we present the year in charts.
Performance quoted is past performance which is no guarantee of future results. Source: Morningstar data, 12/31/21.
Performance quoted is past performance which is no guarantee of future results. Source: Morningstar data, 12/31/21.
Performance quoted is past performance which is no guarantee of future results. Source: Morningstar data, 12/31/21.
Performance quoted is past performance which is no guarantee of future results. Source: Morningstar data, 12/31/21.
Investment professionals, from our Weekly Alternatives Snapshot to our Continuing Education presentations to our blog posts to our portfolio analytics services and our liquid alternatives suite, we are eager to be your resource on liquid alternatives. Contact your Calamos Investment Consultant at 888-571-2567 or caminfo@calamos.com and let us know how we can help.
- Liquid Alts in 2020: Finally, the Market Test That Many Have Been Waiting For
- Liquid Alternatives: 2019 Year in Review
- Liquid Alternatives: 2018 Year-end Review
- 2017: A Look Back at the Year in Liquid Alts
Past performance is not necessarily indicative of future results.
Before investing, carefully consider the fund’s investment objectives, risks, charges and expenses. Please see the prospectus and summary prospectus containing this and other information which can be obtained by calling 1-866-363-9219. Read it carefully before investing.
Opinions and estimates offered constitute our judgment and are subject to change without notice, as are statements of financial market trends, which are based on current market conditions. We believe the information provided here is reliable, but do not warrant its accuracy or completeness. This material is not intended as an offer or solicitation for the purchase or sale of any financial instrument. The views and strategies described may not be suitable for all investors. The opinions and views of third parties do not represent the opinions or views of Calamos Investments LLC.
Alternative investments may not be suitable for all investors.
Commodities Broad Basket portfolios can invest in a diversified basket of commodity goods including but not limited to grains, minerals, metals, livestock, cotton, oils, sugar, coffee, and cocoa.
Convertible portfolios are designed to offer some of the capital-appreciation potential of stock portfolios while also supplying some of the safety and yield of bond portfolios.
Derivative Income strategies primarily use an options overlay to generate income while maintaining significant exposure to equity market risk.
Energy Limited Partnership strategies invest a significant amount of their portfolio in energy master limited partnerships, also known as MLPs.
Equity Market Neutral strategies attempt to profit from long and short stock selection decisions while minimizing systematic risk created by exposure to factors such as overall equity market beta, sectors, market-cap ranges, investment styles, or countries.
Event Driven strategies attempt to profit when security prices change in response to certain corporate actions, such as bankruptcies, mergers and acquisitions, emergence from bankruptcy, shifts in corporate strategy, and other atypical events.
Infrastructure equity funds invest more than 60% of their assets in stocks of companies engaged in infrastructure activities. Industries considered to be part of the infrastructure sector include: oil & gas midstream; waste management; airports; integrated shipping; railroads; shipping & ports; trucking; engineering & construction; infrastructure operations; and the utilities sector.
Long-Short Equity funds hold sizeable stakes in both long and short positions in equities, exchange traded funds, and related derivatives.
Macro Trading strategies, using either systematic or discretionary methods, look for investment opportunities by studying such factors as the global economy, government policies, interest rates, inflation, and market trends.
Multistrategy portfolios offer investors exposure to two or more alternative investment strategies, as defined by Morningstar’s alternative category classifications, through either a single-manager or multi-manager approach.
The Nontraditional Bond category contains funds that pursue strategies divergent in one or more ways from conventional practice in the broader bond-fund universe.
Options Trading strategies use a variety of options trades, including put writing, options spreads, options-based hedged equity, and collar strategies, among others.
Relative Value Arbitrage strategies seek out pricing discrepancies between pairs or combinations of securities regardless of asset class.
Real Estate portfolios invest primarily in real estate investment trusts of various types.
Systematic Trend funds primarily trade liquid global futures, options, swaps, and foreign exchange contracts, both listed and over-the-counter.
Bloomberg US Aggregate Bond Index is a broad-based flagship benchmark that measures the investment grade, US dollar-denominated, fixed-rate taxable bond market. The index includes Treasuries, government related and corporate securities, MBS (agency fixed-rate and hybrid ARM pass-throughs), ABS and CMBS (agency and non-agency).
S&P 500 Index is generally considered representative of the US stock market.
The principal risks of investing in Calamos Market Neutral Income Fund include: equity securities risk consisting of market prices declining in general, convertible securities risk consisting of the potential for a decline in value during periods of rising interest rates and the risk of the borrower to miss payments, synthetic convertible instruments risk, convertible hedging risk, covered call writing risk, options risk, short sale risk, interest rate risk, credit risk, high yield risk, liquidity risk, portfolio selection risk, and portfolio turnover risk.
809639 122
Archived material may contain dated performance, risk and other information. Current performance may be lower or higher than the performance quoted in the archived material. For the most recent month-end fund performance information visit www.calamos.com. Archived material may contain dated opinions and estimates based on our judgment and are subject to change without notice, as are statements of financial market trends, which are based on current market conditions at the time of publishing. We believed the information provided here was reliable, but do not warrant its accuracy or completeness. This material is not intended as an offer or solicitation for the purchase or sale of any financial instrument. The views and strategies described may not be suitable for all investors. This material has been prepared for informational purposes only, and is not intended to provide, and should not be relied on for, accounting, legal or tax advice. References to future returns are not promises or even estimates of actual returns a client portfolio may achieve. Any forecasts contained herein are for illustrative purposes only and are not to be relied upon as advice or interpreted as a recommendation.
Performance data quoted represents past performance, which is no guarantee of future results. Current performance may be lower or higher than the performance quoted. The principal value and return of an investment will fluctuate so that your shares, when redeemed, may be worth more or less than their original cost. Performance reflected at NAV does not include the Fund’s maximum front-end sales load. Had it been included, the Fund’s return would have been lower.
Archived on January 25, 2023Cookies
This website uses cookies. By continuing to use this website, you consent to the use of cookies. Learn more about our cookie usage.


