In the Top 1% of the EM Category, CNWIX Looks for Continued Upside Through 2021
August 18, 2020
On August 6, Calamos hosted an Emerging Markets Review and Outlook with Nick Niziolek, CFA, Co-CIO, Head of International and Global Strategies and Senior Co-Portfolio Manager of the Calamos Evolving World Growth Fund (CNWIX). To listen to the call in its entirety, go to www.calamos.com/CIOglobalequity-8-6.
It’s been a volatile year for emerging markets (EM), and one that’s demanded a great deal of adaptation from active EM managers. Among the top performers in the Morningstar diversified emerging markets category year-to-date through July 31 is the Calamos Evolving World Growth Fund (CNWIX).
On the August 6 call with investment professionals, Co-CIO Nick Niziolek described CNWIX’s dynamic investment process, highlighting four critical pieces: top-down cyclical views, top-down secular thematics, deep-dive fundamental research, and rigorous quantitative screens. Niziolek said these factors give CNWIX “four shots on goal” in an environment that he believes is positive for global risk assets in general, and emerging markets in particular. The CNWIX team anticipates significant upside for the rest of this year and heading into 2021.
In Niziolek’s view, catalysts for EM outperformance include the influence of the Federal Reserve’s stimulus programs, valuation differences between EM and non-EM markets, regional variations in recovery from the coronavirus, and the level of cash investors currently hold on the sidelines.
Regarding the Fed stimulus, Niziolek said, “We’re seeing the impact of [those programs] through a weak dollar, [and] the correlation between a weak dollar and emerging market outperformance is very tight.” From a valuation standpoint, he stressed, “There are attractive valuations in emerging markets. There are discounts there.”
While the U.S. continues to struggle with the coronavirus, he noted that Asia was “first in, first out,” and that Europe “seems to be a little bit more of a sustainable recovery.”
Finally, Niziolek highlighted the amount of cash that investors currently hold, emphasizing the idea that, “Ultimately, when you look at the overweight most investors [have toward] U.S. markets—and especially a very concentrated number of names—there are a lot of opportunities overseas. And when you start to see that capital shift, that's a long tailwind for [EM].”
Nuance in Emerging Markets
Emerging markets involve nuances that an active manager can pick up on early, Niziolek added. This enables the team to invest in growing companies long before they’re added to passive benchmarks.
“As of June 30, five of the top 10 names [in our portfolio] were not in the emerging markets benchmark,” Niziolek said. “But I'm going to posit that in the next year or two they will probably all be.”
Examples of these holdings include MercadoLibre, which he described as the Amazon and PayPal of Latin America, and Sea Limited, an Asian e-commerce gaming and payments platform.
A passive approach to emerging markets, Niziolek said, provides exposure to what index managers (such as MSCI) have already deemed an emerging market—not what's about to become an emerging market. “MSCI is very backward-looking, but ultimately, some of the greatest emerging market opportunities are newer companies that have not yet met the requirements to be added to the benchmark.”
As an example, he pointed to MSCI’s approach in China, where, "they're slowly ramping up exposure [to the A-share market]. Ultimately, it's going to be 15% of the emerging market benchmark. Today it's less than 5%.”
Performance Reflects Process
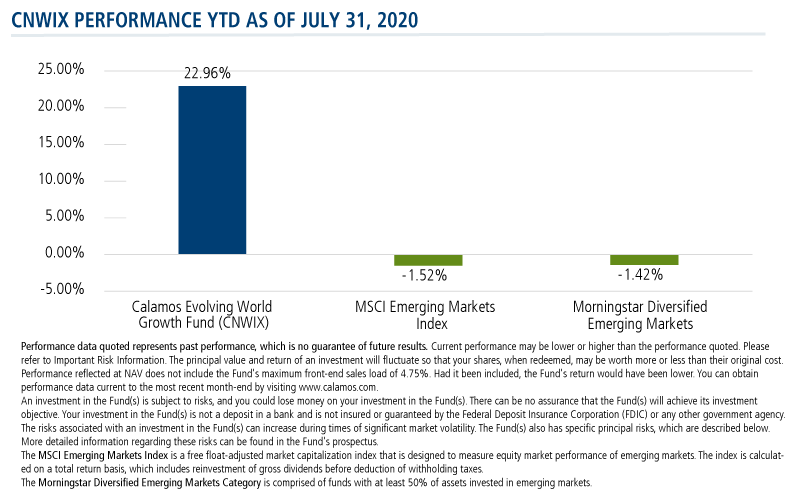
The call also included a performance review, with Niziolek explaining that CNWIX’s year-to-date return of 22.96% (vs. -1.52% for the MCSI Emerging Markets Index and -1.42% for the Morningstar Diversified Emerging Markets Category, as of 7/31/20) derived from an investment process that draws on global macroeconomic analysis and a keen eye toward the interplay between asset classes.
CNWIX may be an EM fund, but Niziolek emphasized, “We're also looking at global and international [data]. The insights we gain from covering the changes in the U.S., [Asia] and Europe ultimately have an impact in the emerging markets. We can leverage those insights to think about what areas of the [EM] market can outperform.”
Additionally, Niziolek noted, “Our team looks at the full capital structure when we're investing. So we'll look at equities, but we're also looking at convertibles and fixed income.” As he said, ”It's that intertwined information flow between the fixed income and the equity asset class that can really drive significant value through time.”
Case in point this year: “There was a significant seizing in the credit markets that we started to see in late February and early March. That was another key [indicator] to take risk down. But when we saw companies come into the market in late March and early April with significant new [fixed income] issuance, that gave us the confidence to re-risk the portfolio.”
Niziolek estimated that about 25% of the fund’s value-add year to date has come from top-down cyclical views. Although the CNWIX team entered the year bullish on EM and global risk assets, the global spread of COVID-19 convinced the team to de-risk the portfolio during most of the first quarter. On the other hand, he said, “When we saw [the Federal Reserve’s] monetary response in late March, that gave us the green light to take more risk and add to the exposure we'd taken down.”
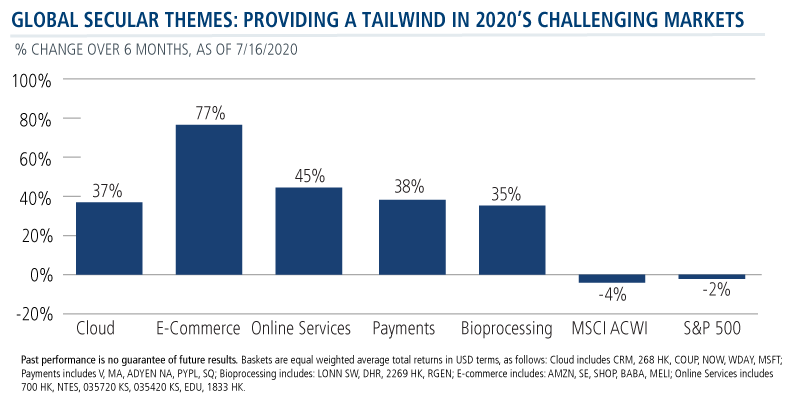
Niziolek estimated that approximately 50% of the fund’s year-to-date outperformance has come from exposure to secular themes like e-commerce, virtual payments, and telemedicine. He stressed that, “These are themes that we've had [in the portfolio] for multiple years. But what happened over the last six months is [that the] adoption cycles that we anticipated would be three to five years in the making got pulled forward.”
CNWIX’s demonstrated outperformance in many of these areas reflects their outperformance in the broader market.
The remaining 25% of the fund’s year-to-date outperformance came from "leveraging quantitative tools to quickly identify those companies that benefitted from global disruptions,” with fundamental research incorporating insights from the team’s cyclical, secular and quantitative views.
Investment professionals, for more on CNWIX, listen to the call replay, read the latest quarterly commentary or contact your Calamos Investment Consultant at 888-571-2567 or caminfo@calamos.com.
Before investing, carefully consider the fund’s investment objectives, risks, charges and expenses. Please see the prospectus and summary prospectus containing this and other information which can be obtained by calling 1-866-363-9219. Read it carefully before investing.
Top 10 Holdings
As of 6/30/20
| Company | Security Type | Industry | % |
|---|---|---|---|
| Tencent Holdings, Ltd. | Stocks | Interactive Media & Services | 8.0% |
| Sea, Ltd. | Convertible Bonds | Interactive Home Entertainment | 7.0% |
| Taiwan Semiconductor Mfg Co. | Stocks | Semiconductors | 5.7% |
| Reliance Industries, Ltd. | Stocks | Oil & Gas Refining & Marketing | 4.3% |
| HDFC Bank, Ltd. | Stocks | Diversified Banks | 4.0% |
| Samsung Electronics Company, Ltd. | Stocks | Technology Hardware, Storage & Peripherals | 3.2% |
| Alibaba Group Holding, Ltd. | Stocks | Internet & Direct Marketing Retail | 2.9% |
| MercadoLibre, Inc. | Stocks | Internet & Direct Marketing Retail | 2.8% |
| Hong Kong Exchanges & Clearing, Ltd. | Stocks | Financial Exchanges & Data | 2.3% |
| Yandex, NV | Convertible Bonds | Interactive Media & Services | 2.3% |
| Total | 42.5% |
The principal risks of investing in the Calamos Evolving World Growth Fund include: equity securities risk consisting of market prices declining in general, growth stock risk consisting of potential increased volatility due to securities trading at higher multiples, foreign securities risk, emerging markets risk, convertible securities risk consisting of the potential for a decline in value during periods of rising interest rates and the risk of the borrower to miss payments, and portfolio selection risk. As a result of political or economic instability in foreign countries, there can be special risks associated with investing in foreign securities, including fluctuations in currency exchange rates, increased price volatility and difficulty obtaining information. In addition, emerging markets may present additional risk due to potential for greater economic and political instability in less developed countries.
The MSCI Emerging Markets Index is a free float-adjusted market capitalization index that is designed to measure equity market performance of emerging markets. The index is calculated on a total return basis, which includes reinvestment of gross dividends before deduction of withholding taxes.
The Morningstar Diversified Emerging Markets Category is comprised of funds with at least 50% of assets invested in emerging markets.
802110 0820
Archived material may contain dated performance, risk and other information. Current performance may be lower or higher than the performance quoted in the archived material. For the most recent month-end fund performance information visit www.calamos.com. Archived material may contain dated opinions and estimates based on our judgment and are subject to change without notice, as are statements of financial market trends, which are based on current market conditions at the time of publishing. We believed the information provided here was reliable, but do not warrant its accuracy or completeness. This material is not intended as an offer or solicitation for the purchase or sale of any financial instrument. The views and strategies described may not be suitable for all investors. This material has been prepared for informational purposes only, and is not intended to provide, and should not be relied on for, accounting, legal or tax advice. References to future returns are not promises or even estimates of actual returns a client portfolio may achieve. Any forecasts contained herein are for illustrative purposes only and are not to be relied upon as advice or interpreted as a recommendation.
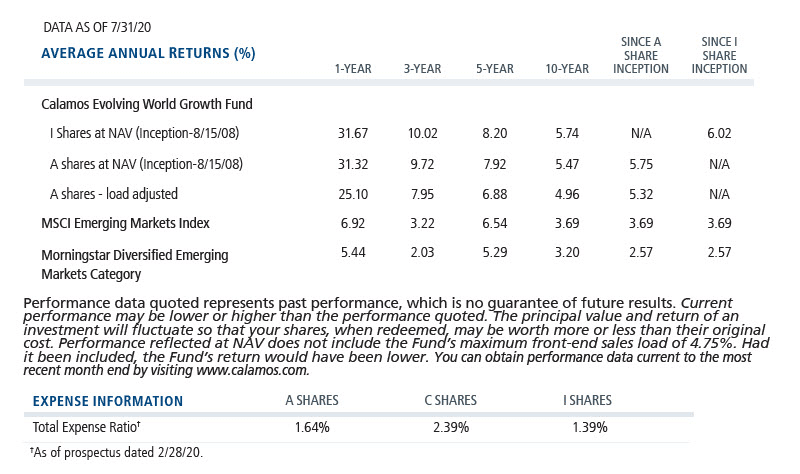
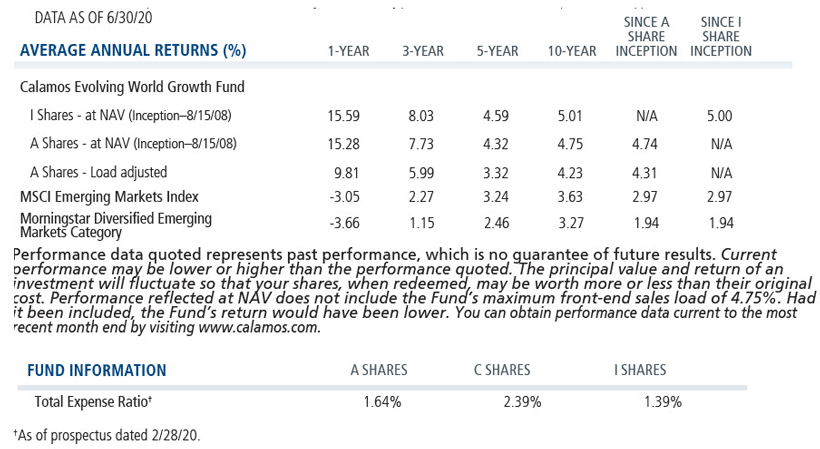
Performance data quoted represents past performance, which is no guarantee of future results. Current performance may be lower or higher than the performance quoted. The principal value and return of an investment will fluctuate so that your shares, when redeemed, may be worth more or less than their original cost. Performance reflected at NAV does not include the Fund’s maximum front-end sales load. Had it been included, the Fund’s return would have been lower.
Archived material may contain dated performance, risk and other information. Current performance may be lower or higher than the performance quoted in the archived material. For the most recent month-end fund performance information visit www.calamos.com. Archived material may contain dated opinions and estimates based on our judgment and are subject to change without notice, as are statements of financial market trends, which are based on current market conditions at the time of publishing. We believed the information provided here was reliable, but do not warrant its accuracy or completeness. This material is not intended as an offer or solicitation for the purchase or sale of any financial instrument. The views and strategies described may not be suitable for all investors. This material has been prepared for informational purposes only, and is not intended to provide, and should not be relied on for, accounting, legal or tax advice. References to future returns are not promises or even estimates of actual returns a client portfolio may achieve. Any forecasts contained herein are for illustrative purposes only and are not to be relied upon as advice or interpreted as a recommendation.
Performance data quoted represents past performance, which is no guarantee of future results. Current performance may be lower or higher than the performance quoted. The principal value and return of an investment will fluctuate so that your shares, when redeemed, may be worth more or less than their original cost. Performance reflected at NAV does not include the Fund’s maximum front-end sales load. Had it been included, the Fund’s return would have been lower.
Archived on August 18, 2021