Active Management, Flexibility Led to CNWIX Outperformance in Emerging Markets ‘Mini-cycle’
May 11, 2020
First published: April 8, 2020
Calamos Evolving World Growth Fund (CNWIX)
Morningstar Overall RatingTM Among 718 Diversified Emerging Mkts funds. The Fund's risk-adjusted returns based on load-waived Class I Shares had 3 stars for 3 years, 5 stars for 5 years and 4 stars for 10 years out of 718, 646 and 423 Diversified Emerging Mkts Funds, respectively, for the period ended 6/30/2024.
During the period from October 2018 to April 2020, global and emerging markets confronted a high degree of uncertainty and concern involving:
- Prolonged trade conflict between the U.S. and China.
- The Fed rate policy pivot.
- Slowing global economic growth in China, Europe and other key regions.
Below, we report on how the Calamos Evolving World Growth Fund (CNWIX) provided resilience during this mini-cycle relative to emerging markets as a whole.
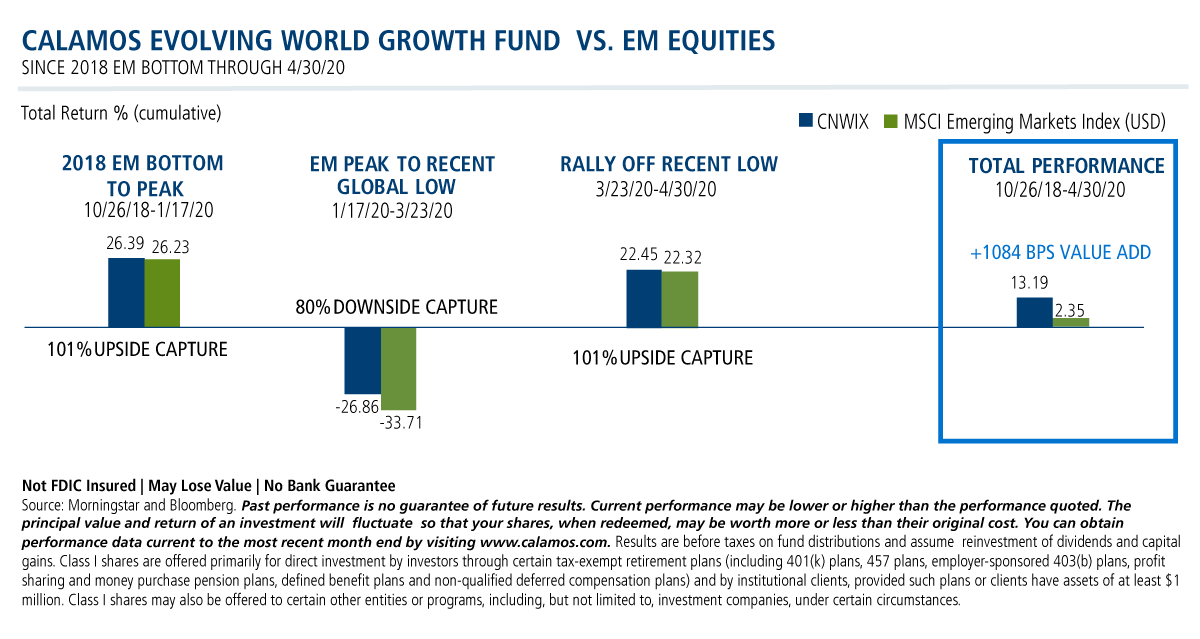
Active management of the fund’s risk profile involved the Calamos Global Team taking full advantage of the fund’s flexible approach and broader investable universe of equities, convertibles and options strategies. The objectives: to capture the upside in emerging markets when markets were rising, and to seek to mitigate risk on the downside when conditions worsened and markets corrected.
The result: Almost 1100 basis points of value added, as shown below. The fund outperformed on the upside during the market recovery from October 2018 through early 2020. During the global market drawdown that occurred from mid-January to late-March 2020, the goal was to preserve capital, with the fund's focus on quality companies and the use of convertibles to provide positive skew (see footnotes for definition). In the subsequent rally since the March lows in equities, we actively adjusted the fund risk profile to increase equity sensitivity, which resulted in strong upside capture.
Investment professionals, for more information on how Calamos Evolving World Growth Fund (CNWIX) seeks risk-managed emerging market participation, contact your Calamos Investment Consultant at 888-571-2567 or caminfo@calamos.com.
Before investing, carefully consider the fund’s investment objectives, risks, charges and expenses. Please see the prospectus and summary prospectus containing this and other information which can be obtained by calling 1-866-363-9219. Read it carefully before investing.
Opinions, estimates, forecasts, and statements of financial market trends that are based on current market conditions constitute our judgment and are subject to change without notice. The views and strategies described may not be suitable for all investors. References to specific companies, securities, asset classes and financial markets are for illustrative purposes only and are not intended to be, and should not be interpreted as, recommendations to buy or sell. Investing in non-U.S. markets entails greater investment risk, and these risks are greater for emerging markets. The above commentary for informational and educational purposes only and shouldn’t be considered investment advice.
The principal risks of investing in the Calamos Evolving World Growth Fund include: equity securities risk consisting of market prices declining in general, growth stock risk consisting of potential increased volatility due to securities trading at higher multiples, foreign securities risk, emerging markets risk, convertible securities risk consisting of the potential for a decline in value during periods of rising interest rates and the risk of the borrower to miss payments, and portfolio selection risk.
As a result of political or economic instability in foreign countries, there can be special risks associated with investing in foreign securities, including fluctuations in currency exchange rates, increased price volatility and difficulty obtaining information. In addition, emerging markets may present additional risk due to potential for greater economic and political instability in less developed countries.
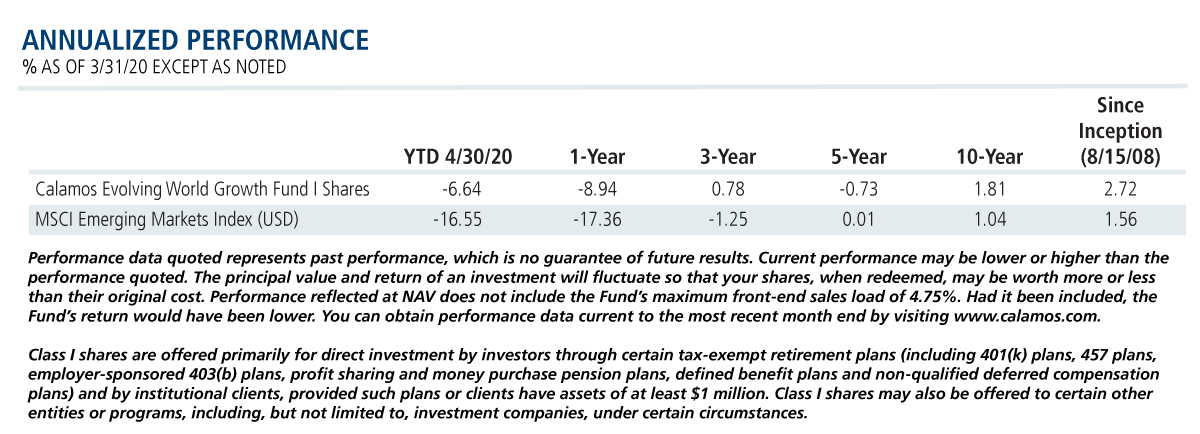
Total return assumes reinvestment of dividends and capital gains distributions and reflects the deduction of any sales charges, where applicable. Performance may reflect the waiver of a portion of the Fund's advisory or administrative fees for certain periods since the inception date. If fees had not been waived, performance would have been less favorable.
The MSCI Emerging Markets Index is a free float adjusted market capitalization index. It includes market indexes of Brazil, Chile, China, Colombia, Czech Republic, Egypt, Hungary, India, Indonesia, Israel, Korea, Malaysia, Mexico, Morocco, Peru, Philippines, Poland, Russia, South Africa, Taiwan, Thailand, and Turkey. Unmanaged index returns assume reinvestment of any and all distributions and do not reflect any fees, expenses or sales charges. Investors cannot invest directly in an index.
The Morningstar Diversified Emerging Markets Category portfolios tend to divide their assets among 20 or more nations, although they tend to focus on the emerging markets of Asia and Latin America rather than on those of the Middle East, Africa, or Europe. These portfolios invest predominantly in emerging market equities, but some funds also invest in both equities and fixed income investments from emerging markets.
Morningstar RatingsTM are based on risk-adjusted returns for Class I shares and will differ for other share classes. Morningstar ratings are based on a risk-adjusted return measure that accounts for variation in a fund’s monthly historical performance (reflecting sales charges), placing more emphasis on downward variations and rewarding consistent performance. Within each asset class, the top 10%, the next 22.5%, 35%, 22.5%, and the bottom 10% receive 5, 4, 3, 2 or 1 star, respectively. Each fund is rated exclusively against U.S. domiciled funds. The information contained herein is proprietary to Morningstar and/or its content providers; may not be copied or distributed; and is not warranted to be accurate, complete or timely. Neither Morningstar nor its content providers are responsible for any damages or losses arising from any use of this information. Source: ©2020 Morningstar, Inc. All rights reserved.
Positive skew indicates asymmetry from the normal distribution in a set of statistical data. In statistics, a positively skewed (or right-skewed) distribution is a type of distribution in which most values are clustered around the left tail of the distribution while the right tail of the distribution is longer. The positively skewed distribution is a direct opposite of the negatively skewed distribution.
NOT FDIC INSURED | NO BANK GUARANTEE | MAY LOSE VALUE
801975 0520
Archived material may contain dated performance, risk and other information. Current performance may be lower or higher than the performance quoted in the archived material. For the most recent month-end fund performance information visit www.calamos.com. Archived material may contain dated opinions and estimates based on our judgment and are subject to change without notice, as are statements of financial market trends, which are based on current market conditions at the time of publishing. We believed the information provided here was reliable, but do not warrant its accuracy or completeness. This material is not intended as an offer or solicitation for the purchase or sale of any financial instrument. The views and strategies described may not be suitable for all investors. This material has been prepared for informational purposes only, and is not intended to provide, and should not be relied on for, accounting, legal or tax advice. References to future returns are not promises or even estimates of actual returns a client portfolio may achieve. Any forecasts contained herein are for illustrative purposes only and are not to be relied upon as advice or interpreted as a recommendation.
Performance data quoted represents past performance, which is no guarantee of future results. Current performance may be lower or higher than the performance quoted. The principal value and return of an investment will fluctuate so that your shares, when redeemed, may be worth more or less than their original cost. Performance reflected at NAV does not include the Fund’s maximum front-end sales load. Had it been included, the Fund’s return would have been lower.
Archived on April 07, 2021