Liquid Alts in 2020: Finally, the Market Test That Many Have Been Waiting For
January 28, 2021
Every Monday, we publish the Calamos Alternatives Snapshot, a newsletter that tracks the returns and flows of the Morningstar alternative and convertible categories. This annual review presents full-year data and summarizes the year’s highlights.
The Relentless Volatility of 2020
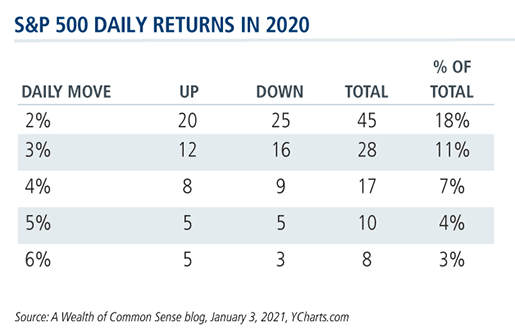
The number of daily moves of 1% or more in 2020 was, according to an analysis by A Wealth of Common Sense blog, roughly double the long-term historical average for the S&P 500 in a given year. One out of every 10 days in 2020 saw a >3% gain or loss—which is more than four times the historical average.
Since liquid alternatives hit their highwater mark in 2014, there’s been a consistent theme to commentary about the funds. The focus has been on the downward trajectory of category flows and category returns, as both languished as risk assets flourished in the extended bull market.
Many viewed last year’s market correction—featuring a historically quick 34% S&P 500 drawdown—and extended volatility as a decisive test. Would liquid alts prove themselves capable of shielding investors from equity declines and keeping clients invested during churning markets? Would assets gravitate to liquid alts as risk management solutions?
Here’s a sampling of leading publications’ takeaways last spring on how alts performed:
- “Liquid Alts Have Offered a (Relatively) Safer Haven,” Morningstar.com reported on March 23, the day of the market bottom. “Whether such outperformance drives sustained investor interest will depend on the length and shape of the downturn,” the article said. Persistent volatility or an L-shaped recovery could drive demand for alts, according to the article. A V-shaped recovery, though, is likely to find investors—whose memories tend to be short—more eager to participate fully in equities.
-
“The Past Month Has Been a ‘Wake-up Call’ on Traditional Portfolio Diversifiers,” proclaimed an April 13 All About Alpha post. Noting that traditional portfolio diversifiers struggled during the most recent drawdown, the post expected “conventional safe haven assets” to continue to fail to protect from both equity and bond beta and volatility. However, the author wrote, liquid alternative funds—“mindful of beta, volatility and correlation whether markets are down, flat or up”—are proving their worth.
“These funds may capture exposures that are unique and robust but also sustainable through many market environments by investing in nontraditional ways.” -
“How to Protect Your Portfolio With—and From—Liquid Alts,” headlined a May 26 Barron’s article.
“Liquid alts were supposed to provide diversification and protection during the next great crisis. And yet, when that crisis flared up this year, they didn’t,” concluded the article, citing the “average liquid-alt” decline of 7.9% Feb. 19 to May 6 or about half the 15% decline of the S&P 500.
Don’t give up on liquid alts yet, Barron’s told readers, and went so far as to suggest that demand for alts may rise, given their liquidity and expense advantages versus hedge funds. The article offered tips on finding “the diamonds amid all this cubic zirconia.” Among the funds given a nod: Calamos Market Neutral Income Fund (CMNIX).
“Such a high level and broad sweep [of much alts' coverage] runs the risk of overlooking the diversity of liquid alternatives,” believes Shawn Park, CFA, Calamos Vice President of Product Management and Analytics. "The risk in generalizations about alts is that they may discourage use. Today’s alts offer unique value, if you’re willing to look."
Indeed, to consider one challenging market period—in this case, 22 days long—as proof of the viability of an investment solution may not be the way to go.
“The majority of alternative categories outperformed the S&P 500 during the drawdown last year [see below]. But,” says Elise Pondel, CFA, in Calamos Strategic Product Management & Analytics, “keep in mind that it’s not every alternative’s goal to outperform the market during extreme drawdowns.”
It’s a common mistake Pondel sees in her work analyzing investment professionals’ portfolio allocations. Alternatives are being evaluated over too short of a time period, such as singling out one market drawdown or a one-year period of blockbuster performance.
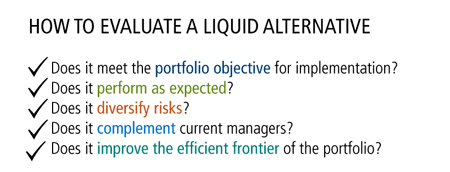
Sometimes, she says, funds are evaluated incorrectly. One example: Making an assumption that alts need to have negative correlation to the S&P 500 and expecting positive performance when the S&P is negative—which is generally not the case. “Due diligence is extremely important in understanding a particular alternative strategy and for evaluating an alternative over an appropriate time period,” she adds.
Alts can add value to a portfolio by mitigating a particular market risk or diversifying sources of returns.
Mindful of the caveats that one-year performance is just one input in evaluating an alternative, let’s consider how alts did in aggregate last year.
Liquid Alternatives 2020 Performance Review
Below we present three views of alts’, including convertibles’, performance in 2020: for the full year, during the drawdown of February 20-March 23, and then in the snapback that started on March 24 and continued to the year’s end.
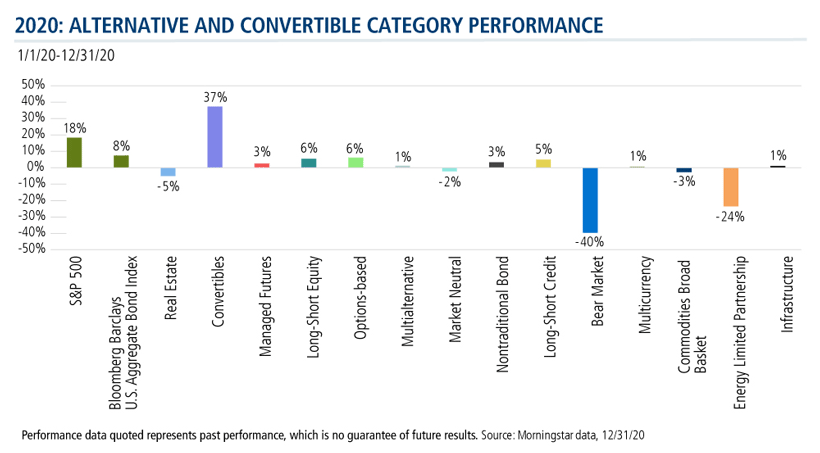
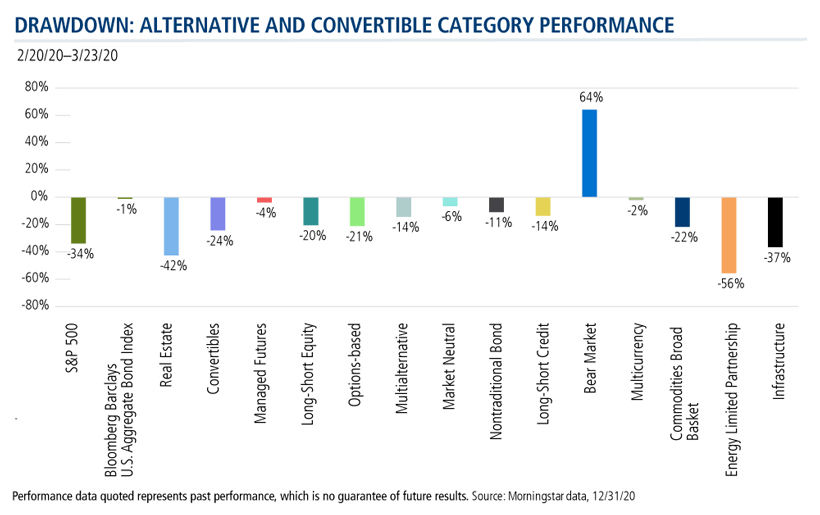
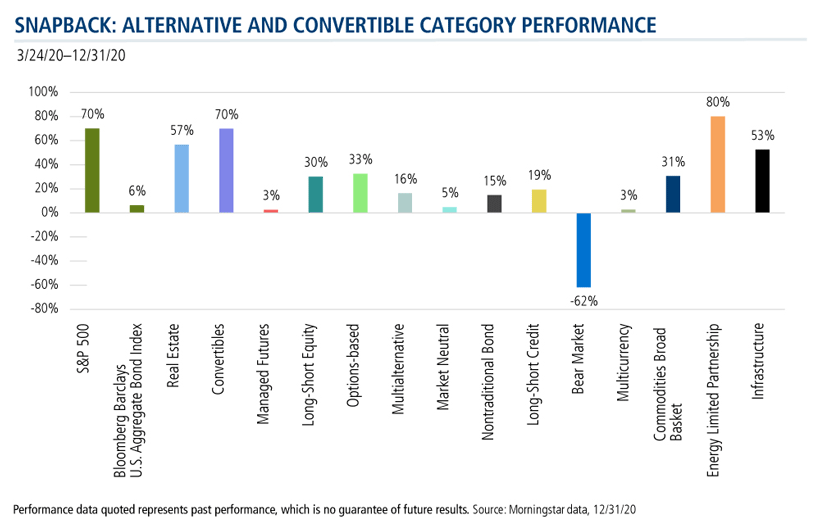
Predictably, only the Bear Market was positive during the drawdown. Many categories staged strong rebounds during the snapback. Options-based, Long-Short Equity and Long-Short Credit categories posted the highest full year returns but well short of the S&P 500. Only funds in Morningstar’s Convertibles category outperformed the S&P—and by twice as much.
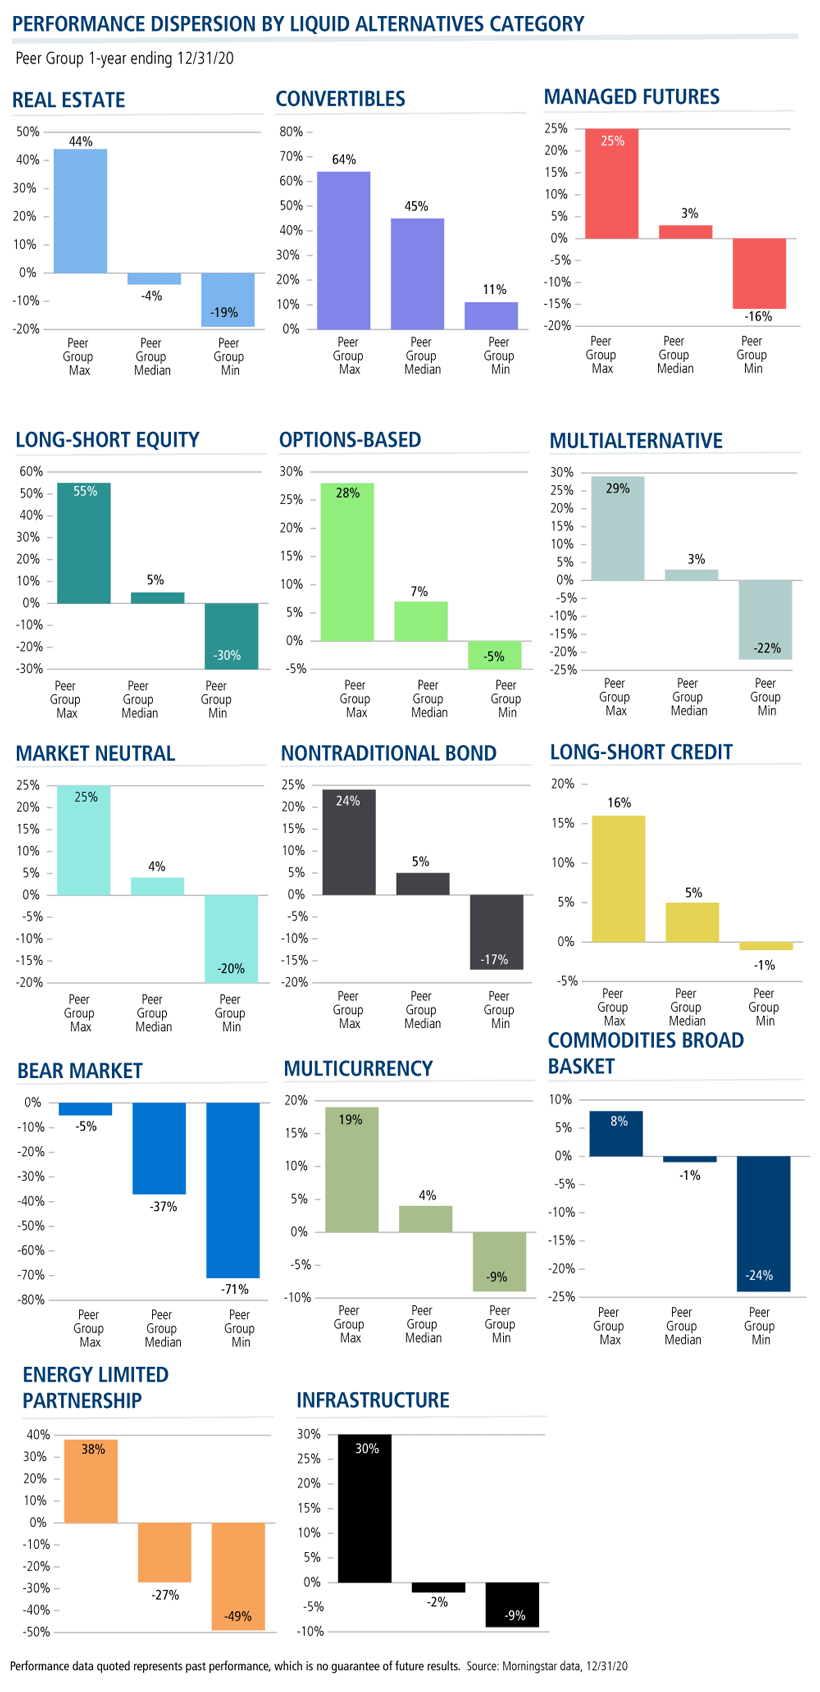
Within the categories there was wide divergence in performance. Note the Long-Short Equity category, which included funds that ended the year up 55% and down 30%.
Another Down Year in AUM
Adoption and flows are yet another matter. As they have every year since 2014, assets in liquid alts categories shrunk in 2020. At the most (we include the $21.4 billion Convertibles category), alts funds totaled $436.2 billion in assets on December 31—a 10% drop from the year before.
Categories shrunk across the board with few noteworthy exceptions:
- A 32% increase in assets—to $27.9 billion—in Option-based funds. This continues a trend we noted a few times (see this post and this post) last year.
- An 11% increase in the $29 billion in the Market Neutral category.
- A 50% increase—to $21.4 billion in the Convertibles category.
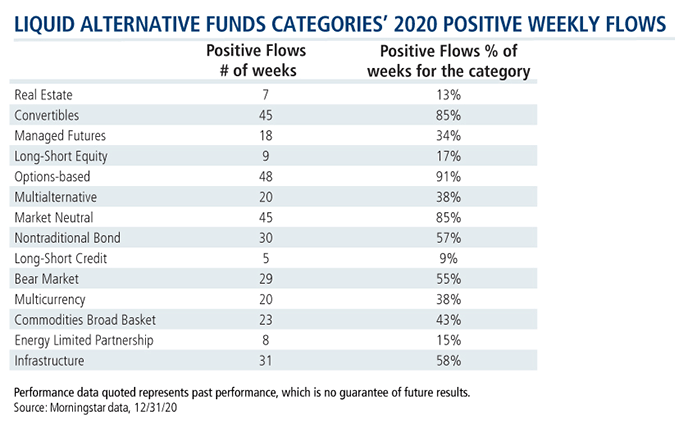
In weekly flows-gathering, the story was slightly different. Options-based, Market Neutral and Convertible funds enjoyed positive flows for most weeks of the year, reflecting continuous investor interest. One of the better performing categories in 2021, the Long-Short Equity category saw negative flows in all but nine weeks last year.
For this report, in 2020 and previous years, the Calamos Alternatives Snapshot reported on the performance and flows of open-end mutual funds. Starting in January 2021, the Snapshot now includes ETF data, as well.
In aggregate, estimated net flows are off 46%, with negative net flows totaling $41.8 billion versus $28.6 billion in 2019. In the interactive chart below, you can't miss the outflows in the third and fourth week of March.
As volatility increases, alts categories with equity hedging characteristics (Options-based and Market Neutral) have gained in popularity, Park says. Demand for Nontraditional Bond and Real Estate funds is heightening, thanks to the “search for yield,” rising rate scenarios and inflation concerns.
Based on heightened demand for portfolio reviews from investment professionals, Park predicts liquid alts are headed for another growth spurt. The search for solutions in this continued low yield/high volatility environment invariably leads to the “right” alts, says Park.
It’s this diversity—in breadth of category objectives, flows and performance—that we report on weekly in the Calamos Alternatives Snapshot (subscribe here).
Without any further ado, and for your interactive analysis, we present the year in charts.
Investment professionals, for more information on this report or for help analyzing how alts could work in your clients' portfolios, contact your Calamos Investment Consultant at 888-571-2567 or caminfo@calamos.com.
net assets year-end interactive chart
Performance quoted is past performance which is no guarantee of future results. Source: Morningstar data, 12/31/20
interactive chart
Performance quoted is past performance which is no guarantee of future results. Source: Morningstar data, 12/31/20
weekly flows interactive chart
Performance quoted is past performance which is no guarantee of future results. Source: Morningstar data, 12/31/20
weekly returns interactive chart
Performance quoted is past performance which is no guarantee of future results. Source: Morningstar data, 12/31/20
Past performance is not necessarily indicative of future results.
Opinions and estimates offered constitute our judgment and are subject to change without notice, as are statements of financial market trends, which are based on current market conditions. We believe the information provided here is reliable, but do not warrant its accuracy or completeness. This material is not intended as an offer or solicitation for the purchase or sale of any financial instrument. The views and strategies described may not be suitable for all investors. The opinions and views of third parties do not represent the opinions or views of Calamos Investments LLC.
Alternative investments may not be suitable for all investors.
The Nontraditional Bond category contains funds that pursue strategies divergent in one or more ways from conventional practice in the broader bond-fund universe.
Multialternative funds offer investors exposure to several different alternative investment tactics. Funds in this category have a majority of their assets exposed to alternative strategies.
Bear Market funds dedicate a majority of the fund’s assets to equities. Most of the portfolio is dedicated to short stock positions in an attempt to take advantage of anticipated market or stock declines.
Managed Futures funds primarily trade liquid global futures, options, swaps, and foreign exchange contracts, both listed and over-the-counter.
Commodities Broad-basket portfolios can invest in a diversified basket of commodity goods including but not limited to grains, minerals, metals, livestock, cotton, oils, sugar, coffee, and cocoa.
Energy Limited Partnership strategies invest a significant amount of their portfolio in energy master limited partnerships, also known as MLPs.
Multicurrency portfolios invest in multiple currencies through the use of short-term money market instruments; derivative instruments including and not limited to forward currency contracts, index swaps, and options; and cash deposits.
Market Neutral funds attempt to reduce systematic risk created by factors such as exposures to sectors, market-cap ranges, investment styles, currencies, and/or countries.
Real Estate portfolios invest primarily in real estate investment trusts of various types. REITs are companies that develop and manage real estate properties.
Convertible-bond portfolios are designed to offer some of the capital-appreciation potential of stock portfolios while also supplying some of the safety and yield of bond portfolios.
Options-based funds use options as a central component of their investment strategies.
Long-short Credit funds seek to profit from changes in the credit conditions of individual bond issuers and credit market segments represented by credit indexes.
Long-short Equity funds hold sizeable stakes in both long and short positions in equities, exchange traded funds, and related derivatives.
Infrastructure equity funds invest more than 60% of their assets in stocks of companies engaged in infrastructure activities. Industries considered to be part of the infrastructure sector include: oil & gas midstream; waste management; airports; integrated shipping; railroads; shipping & ports; trucking; engineering & construction; infrastructure operations; and the utilities sector.
The S&P 500 Index is considered generally representative of the U.S. equity market.
The Bloomberg Barclays U.S. Aggregate Bond Index covers the U.S.-denominated, investment-grade, fixed-rate, taxable bond market of SEC registered securities.
The Bloomberg Barclays U.S. Government/Credit Index is comprised of long-term government and investment-grade corporate debt securities and is generally considered representative of the performance of the broad U.S. bond market.
The principal risks of investing in Calamos Market Neutral Income Fund include: equity securities risk consisting of market prices declining in general, convertible securities risk consisting of the potential for a decline in value during periods of rising interest rates and the risk of the borrower to miss payments, synthetic convertible instruments risk, convertible hedging risk, covered call writing risk, options risk, short sale risk, interest rate risk, credit risk, high yield risk, liquidity risk, portfolio selection risk, and portfolio turnover risk.
802297 0121
Archived material may contain dated performance, risk and other information. Current performance may be lower or higher than the performance quoted in the archived material. For the most recent month-end fund performance information visit www.calamos.com. Archived material may contain dated opinions and estimates based on our judgment and are subject to change without notice, as are statements of financial market trends, which are based on current market conditions at the time of publishing. We believed the information provided here was reliable, but do not warrant its accuracy or completeness. This material is not intended as an offer or solicitation for the purchase or sale of any financial instrument. The views and strategies described may not be suitable for all investors. This material has been prepared for informational purposes only, and is not intended to provide, and should not be relied on for, accounting, legal or tax advice. References to future returns are not promises or even estimates of actual returns a client portfolio may achieve. Any forecasts contained herein are for illustrative purposes only and are not to be relied upon as advice or interpreted as a recommendation.
Performance data quoted represents past performance, which is no guarantee of future results. Current performance may be lower or higher than the performance quoted. The principal value and return of an investment will fluctuate so that your shares, when redeemed, may be worth more or less than their original cost. Performance reflected at NAV does not include the Fund’s maximum front-end sales load. Had it been included, the Fund’s return would have been lower.
Archived on January 28, 2022