Liquid Alternatives: 2019 Year in Review
January 13, 2020
2019 wasn’t the year that liquid alts proved their value via superior investment returns. The stock market (S&P 500) gained 31.49% and the bond market 8.72% (Bloomberg Barclays Capital U.S. Aggregate Bond Index). The garden variety 60% stock and 40% bond portfolio posted a 22% return, its best year since 1997.
Thank You, Advisors
While the market environment has been challenging for alternatives fund providers overall, Calamos continues to buck the trend. Calamos’ progress in the alts category is the result of both a commitment to educate financial advisors on how alts can be used to manage risk in clients’ portfolios and investment performance results in categories that advisors continue to embrace.
As of December 2019, Calamos is now the second largest liquid alternative funds provider by assets under management—after having just broken into the top 10 in 2017 (see post).
Such year-long strength in the markets meant that risk-managed alts weren’t needed to mute the impact of a sustained drawdown—to lose less than the overall equity market, for example. The year presented just two tests, one in May when trade uncertainty drove the S&P down 6.62% and the other the early August sell-off, again over the China tariffs (see related post).
Rather, where alts worked in 2019 was to help keep clients invested.
Well into the unloved bull market of 2019, the Wall Street Journal reported that “nervous investors have socked $3.4 trillion away in cash.” That included $1 trillion in money market funds the last three years alone, according to Lipper data cited.
Few at the start of the year—after the tumultuous December 2018—could have imagined 30% returns in 2019. Double-digit returns 10 years into a market expansion seemed too good to believe, and all but the most confident of investors were focused on the potential for imminent risk and loss. Unfortunately, investors who sat out in 2019 missed all of the upside—and still have the risk of timing their re-entry ahead of them.
So, here’s the proper role that liquid alts played in 2019. An allocation to an options-based alt, for example, may have returned half of the S&P 500 (14.59% Options-based category average), but compare that to the 2.20% return on a Treasury bill. And, if equities turned volatile or ugly or both? A plan to minimize the downside was in place for the continuously invested client.
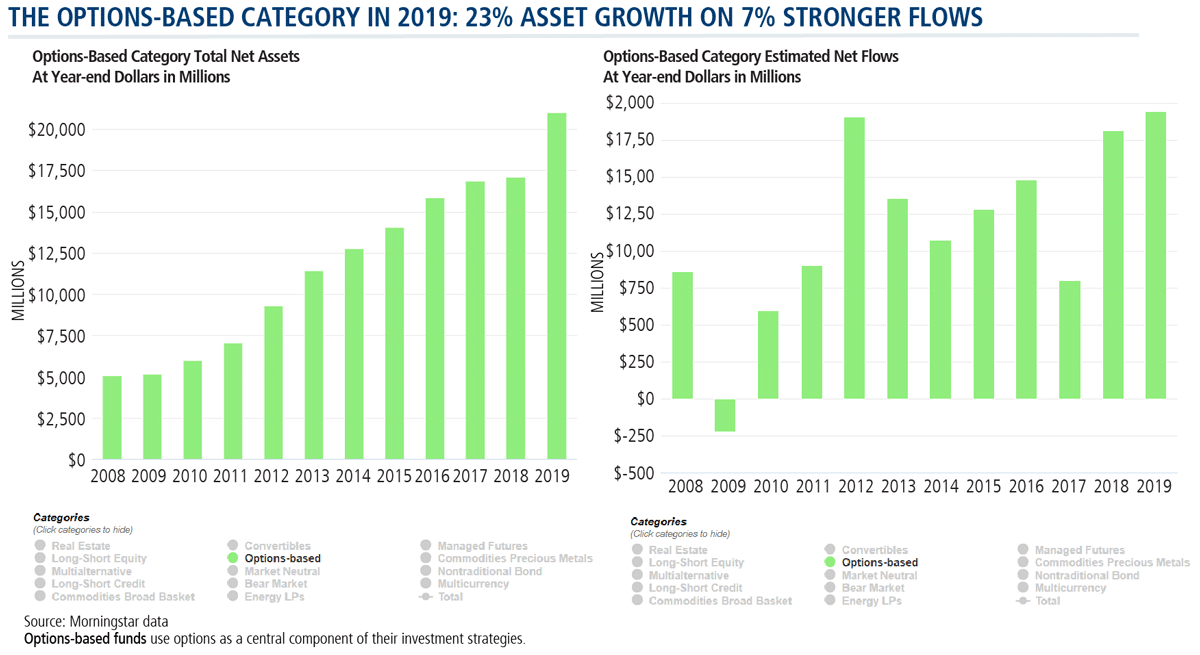
It was this asymmetric approach that made the Options-based category a stand-out alternative category in 2019, reaching new asset and flow levels.
Overall, however, asset growth and flows both slowed in 2019, continuing a trend that’s been true since 2014. In all, alternatives represent $476 billion in total assets, representing a 4% increase from year-end 2018 but 16% off from the high water mark of $568 billion at year-end 2014.
net assets year-end interactive chart
Source: Morningstar data, 12/31/19
interactive chart
Source: Morningstar data, 12/31/19
Advisors’ Use of Liquid Alts
Financial advisor demand for liquid alternative funds has been muted by the strength of the stock and bond markets but by disappointing absolute performance too.
And, in 2019, asset managers continued to urge advisors to be purposeful in their alts’ use. “Some advisors pick funds based on performance and they don’t really understand the risks that they’re taking in their portfolio,” said our Elise Pondel, CFA, Calamos Product Manager, Strategic Product Management & Analytics in August (see The Value of a Second Opinion: Review Notes from Our Portfolio Analytics Team.)
BlackRock’s analysis of advisor use of alternative funds in its models on its risk management platform suggested the same, as reported in a November Ignites article headlined, “Advisors Don’t Know How to Use Alts.”
“Many advisors heavily emphasize past returns when picking funds. The strong recent returns of the stock market have meant top-performing alternative funds typically have significant equity exposure,” according to BlackRock. (For a related post, see Why You Want to Be Long/Short—and Not ‘Long/Short Light:’ CPLIX.)
“And, when advisors pick less correlated funds, the quote we often hear from advisors is, ‘I got the risk reduction I was looking for, but I didn’t necessarily get the return I was seeking.'”
Educating advisors on alts use is something Calamos is committed to. Our weekly Alternatives Snapshot tracks flows and returns of Morningstar U.S. fund alternative categories as well as the Convertibles category.
Below we present our annual review of the year in liquid alts, starting first with alts’ categories flows and returns. For a closer look at specific categories in the charts, click on categories in the legend to show or hide. After the charts we’ll visit some recurring themes of our weekly coverage in the Alternatives Snapshot.
Download the Snapshot now and subscribe here to start your own weekly subscription.
The Year in Charts
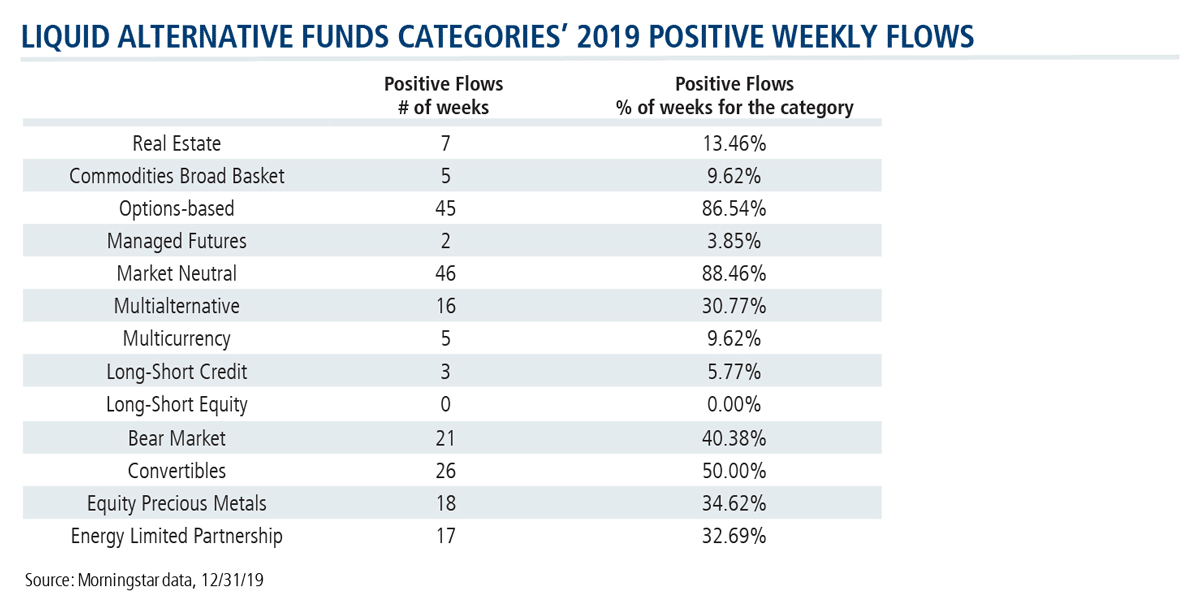
- The alternative categories as a whole experienced negative flows in 2019, with just four categories (Market Neutral, Options-based, Commodities Broad Basket and Commodities Precious Metals) experiencing positive flows for the year. One category—Long-Short Equity—experienced only negative flows every week of the year.
weekly flows interactive chart
Source: Morningstar data, 12/31/19
- In flows-gathering, the Market Neutral category enjoyed positive flows 46 weeks of the year and ultimately saw a 65% increase in flows year-over-year to surpass $2.8 billion. The Options-based category was positive 45 weeks, with estimated net flows totaling $1.9 billion.
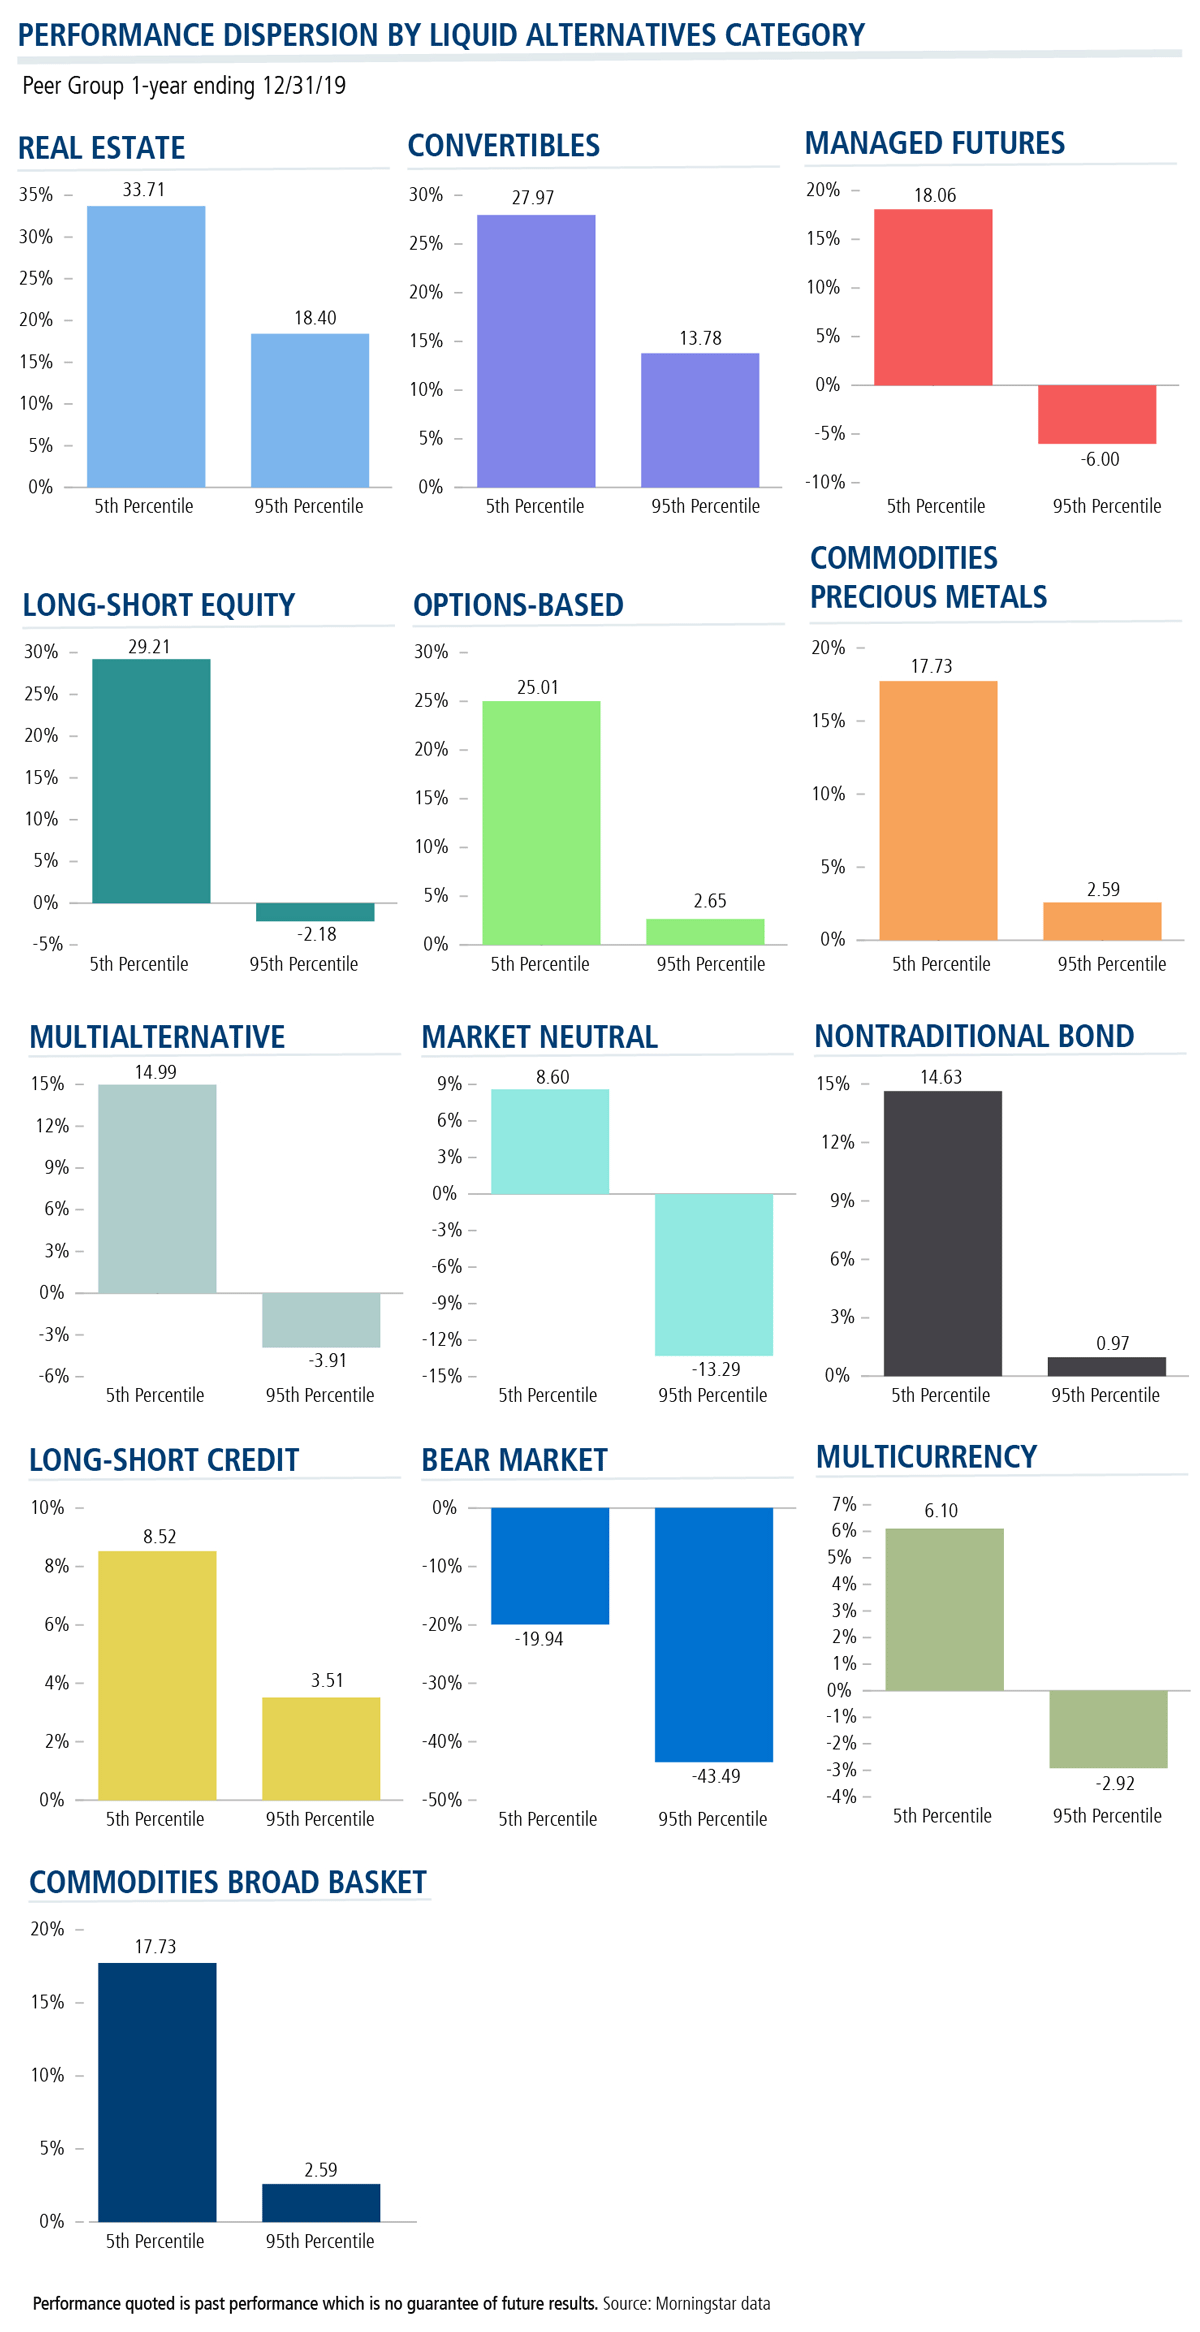
- The top-performing liquid alts category was Real Estate with its 27.36% return, followed by Commodities Precious Metals and Convertibles neck and neck with 21.32% and 21.08% returns, respectively.
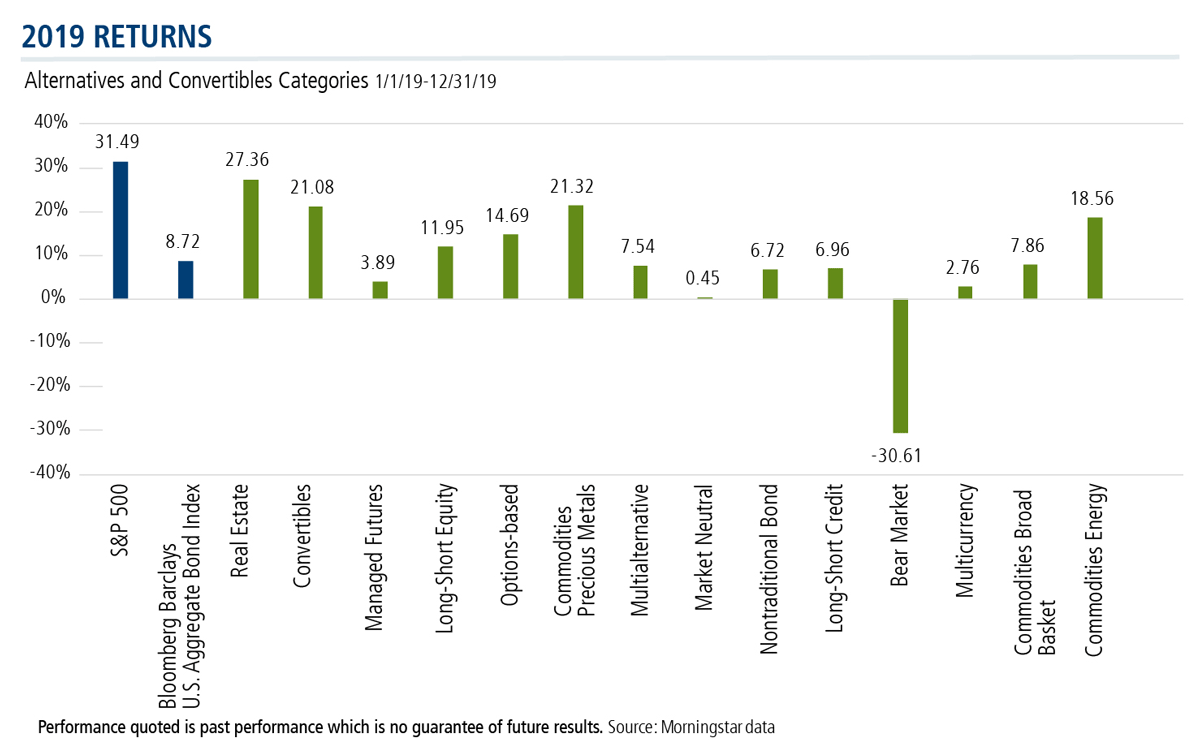
weekly returns interactive chart
Performance quoted is past performance which is no guarantee of future results. Source: Morningstar data, 12/31/19
- Within the alternative categories are funds pursuing a wide array of strategies, as suggested by these one-year performance dispersion charts.
And now, a review of some news and research highlights of 2019.
The Demand for Liquid Alts
- The likeliest demographic to rely on liquid alts to protect against market risk? More than half (53%) of millennials favor alts over “traditional diversification.” This was in response to an Advisor Authority Study commissioned by Nationwide Advisory Solutions, reported on by PlanAdviser.com and cited by the Snapshot in March.
- Liquid alts—including mutual funds, closed-end funds and ETFs—represent about 4% of institutional assets and total $882 billion. This compares to an estimated $5 trillion invested in alternatives that now represent 26% of institutional assets, according to a November study by Greenwich Associates. The study called liquid alts ETFs the next frontier.
- Low bond yields, favorable regulatory changes and vibrant product development explain the popularity of liquid alts in Europe, where assets under management are more than twice those in the U.S. The fastest growing asset class has launched 324 new funds each year since 2009, and Morningstar now counts 2,663 alts (vs. the U.S.’s 540), according to HedgeWeek coverage of Morningstar’s Cross-Border Liquid Alternative Fund Landscape published in March.
Expenses Are Declining
Liquid alternative funds still cost more than other types of mutual funds and ETFs, but their expense ratios are declining, according to Morningstar’s U.S. Fund Fee Study, published in April. At 20 basis points more than passive alts, active alts showed the largest percentage change drop (7%) to 2018 from 2017 among active funds on an equal-weighted basis.
Market Risks
-
Back in April when commentators were weighing in on the risk of a bond bubble, A Wealth of Common Sense blog post offered a reality check: “Stocks will always be the bigger risk,” the post said.
Since 1928, stocks experienced 11 double-digit down years, including six different years of losses in excess of 20%—and 51 double-digit up years. By comparison, intermediate-term government bonds experienced just one double-digit down year and 18 double-digit positive returns over the 90-year period. - Debate continued throughout the year regarding the influence of algorithm-driven trading on markets and volatility. CNBC reported in July that J.P. Morgan says passive investments (e.g., exchange-traded funds) control 60% of the equity assets and model-following quantitative funds account for 20%. However, Vanguard pushed back. Their research showed that index funds hold 15% of the value of the U.S. stock market and represent just 5% of trading volume.
- A majority of stocks—37,195 or 60.9%—were net money losers over the last three decades, Bloomberg reported in July based on an analysis by a research team from the Carey School of Business at Arizona State University. Just 1.3% of the world’s public companies account for all the market gains during the past three decades.
- Perceived safety with a stated return and an emphasis on a stream of payments with scant attention to underlying risk—those were the characteristics of crowded trades that the Dash of Insight blog warned about in September. The post’s candidates for crowded trades included: cash, bonds, products designed for high yield (business development companies [BDCs], master limited partnerships [MLPs], REITs), structured products with complex payoff calculations, annuities and even passive investing.
- Despite overwhelming satisfaction with their model portfolios, almost one out of two (46%) financial advisors lacks confidence about both their ability to assess risk with model portfolios and about their models’ effectiveness in challenging and volatile markets. This was according to a May 2019 survey of advisors, “Distribution in a model-driven age,” by Broadridge Financial Solutions, Inc.
The Legacy of the 10-year Bull Market
- “Clients tend to believe that the strong market performance is bound to continue for the foreseeable future”—such recency bias is the top challenge investors face, according to a July survey of 300 financial advisors conducted by Cerulli Associates for Charles Schwab Investment Management (PDF of the research).
- In its Q3 2019 Retirement Analysis, Fidelity in November raised the alarm that some investors are overallocated to stocks through their 401(k)s. One-quarter (23.1%) of 401(k) savers have a higher percentage of equities than is recommended based on an equity glide path. Among Baby Boomers, the overallocation of stock was even higher—37.6% were found to have “too much equity.”
The 60/40 Portfolio
The Snapshot published several takes on the 60/40 portfolio, including:
-
The risk in not rebalancing: Left alone for 10 years, the 60% equity/40% fixed income portfolio from 2009 had evolved to 78%/22% by September—and was due for a rebalancing.
At this point, relative to the initial allocation, “your client is subject to a 34% increase in volatility and a 46% increase in potential loss to the portfolio he or she has built over the last 10 years,” explained an October Calamos blog post. - A strategy described in a September Irrelevant Investor blog post involved flipping back and forth between 60% equities/40% fixed income to 60% fixed income/40% equities as an alternative to being all in or all out of the market.
- Forty percent fixed income will likely be too much in the future, a Bank of America Securities research note commented in October, as reported on by MarketWatch. “The relationship between asset classes has changed so much that many investors now buy equities not for future growth but for current income, and buy bonds to participate in price rallies,” the note said.
What Was Different About 2019
The year distinguished itself on a few fronts, as reported in the Snapshot:
- The divergence between equity outflows of $155 billion and $182 billion in bond inflows through May 31 was the largest it had been in more than 15 years. This was according to a senior analyst at Bernstein in a research note cited by Investopedia.
- The overlap in the top 50 stock holdings of hedge funds and mutual funds was at near-record levels in July, prompting a Bank of America Merrill Lynch analyst to tell The Wall Street Journal that “the huge world of investible assets has shrunk to a small cohort.” Such a concentration “could exacerbate market declines if bad news sparks a rush to the exits,” predicted the paper.
-
In the 2010s—a decade whose earnings growth was the highest on record—the vast majority of the gains in the S&P 500 were attributed to spiking earnings “and not from investors’ willingness to pay more for stocks,” noted a December Bloomberg post. Of the S&P 500’s 13.3% annual return since 2010, 10.2% is from earnings growth. But earnings are “extraordinarily” volatile. The post quantified the volatility of yearly changes in earnings per share, as measured by annualized standard deviation since 1871, at a “whopping 52%” versus 19% for stock prices.
If earnings growth is unsustainable, the other two sources of stock returns may not make up the difference. The dividend yield is expected to remain around 2%. With the 12-month trailing P/E ratio about 50% higher than the long-term average of 16, “future changes in the market’s valuation are more likely to eat into returns than enhance them.”
Revisiting and Recrunching
In 2019 a few commentators challenged conventional wisdom:
- Retirement portfolios typically become increasingly conservative as clients age. But maybe, said Michael Kitces, financial planner and author of the Nerd’s Eye View blog, the time to minimize equity exposure is when a client is first transitioning and has the largest asset base. This was covered in an InvestmentNews article in May.
-
Stocks outperform bonds over the long term—or do they? With the exception of 40 of the past 220 years—from 1942 through 1982—stocks and bonds have produced essentially equal returns, concluded an October report.
“Either asset can outperform the other over intervals of arbitrary length, intervals which may equal or exceed an individual investor’s life horizon,” was one of the findings of a professor emeritus at the Leavey School of Business at Santa Clara University in California. - A February Of Dollars and Data analysis post sought to address once and for all the effectiveness of dollar cost averaging all versus a lump sum.
In a review of the performance of the two approaches in a 60/40 portfolio each month from 1960-2018, the blog found that DCA underperformed lump sum 80% of the time. In a 5-year DCA buying period, there’s a 95% chance of underperforming a lump sum and the average underperformance is 17%.
Volatility
-
Research released in August found a connection between investor age and response to market declines.
According to research conducted by Schroders and included in a Visual Capitalist infographic, more than eight out of 10 (82%) millennial and almost seven out of 10 (69%) Generation X investors made changes to their portfolios after the December 2018 market drop. At the other end of the spectrum, less than one-third (32%) of “Silent Generation” investors and less than half (47%) of baby boomers made a move. - Intraday equity volatility is likely to be lower than price swings on a close-to-close basis, according to a Bloomberg post in July. Approximately 23% of New York Stock Exchange equities trading volume happens in the last half-hour of a trading day—such is the effect of programmatic players creating “wild markets” by executing orders en masse.
- From DataTrek Research in November, as reported on by MarketWatch, came a new measure for measuring volatility. Absolute daily returns track what a buy-and-hold investor sees in terms of daily perceived stock market volatility.
Financial advisors, to learn more about using alts or our alternative funds, please talk to your Calamos Investment Consultant at 888-571-2567 or email caminfo@calamos.com.
Past performance is not necessarily indicative of future results.
Opinions and estimates offered constitute our judgment and are subject to change without notice, as are statements of financial market trends, which are based on current market conditions. We believe the information provided here is reliable, but do not warrant its accuracy or completeness. This material is not intended as an offer or solicitation for the purchase or sale of any financial instrument. The views and strategies described may not be suitable for all investors. The opinions and views of third parties do not represent the opinions or views of Calamos Investments LLC.
Alternative investments may not be suitable for all investors.
The Nontraditional Bond category contains funds that pursue strategies divergent in one or more ways from conventional practice in the broader bond-fund universe.
Multialternative funds offer investors exposure to several different alternative investment tactics. Funds in this category have a majority of their assets exposed to alternative strategies.
Bear Market funds dedicate a majority of the fund’s assets to equities. Most of the portfolio is dedicated to short stock positions in an attempt to take advantage of anticipated market or stock declines.
Managed Futures funds primarily trade liquid global futures, options, swaps, and foreign exchange contracts, both listed and over-the-counter.
Commodities Broad-basket portfolios can invest in a diversified basket of commodity goods including but not limited to grains, minerals, metals, livestock, cotton, oils, sugar, coffee, and cocoa.
Commodities Precious Metals can invest in precious metals such as gold, silver, platinum, and palladium.
Energy Limited Partnership strategies invest a significant amount of their portfolio in energy master limited partnerships, also known as MLPs.
Multicurrency portfolios invest in multiple currencies through the use of short-term money market instruments; derivative instruments including and not limited to forward currency contracts, index swaps, and options; and cash deposits.
Market Neutral funds attempt to reduce systematic risk created by factors such as exposures to sectors, market-cap ranges, investment styles, currencies, and/or countries.
Real Estate portfolios invest primarily in real estate investment trusts of various types. REITs are companies that develop and manage real estate properties.
Convertible-bond portfolios are designed to offer some of the capital-appreciation potential of stock portfolios while also supplying some of the safety and yield of bond portfolios.
Options-based funds use options as a central component of their investment strategies.
Long-short credit funds seek to profit from changes in the credit conditions of individual bond issuers and credit market segments represented by credit indexes.
Long-short equity funds hold sizeable stakes in both long and short positions in equities, exchange traded funds, and related derivatives.
The S&P 500 Index is considered generally representative of the U.S. equity market.
The Bloomberg Barclays U.S. Aggregate Bond Index covers the U.S.-denominated, investment-grade, fixed-rate, taxable bond market of SEC registered securities.
The Bloomberg Barclays U.S. Government/Credit Index is comprised of long-term government and investment-grade corporate debt securities and is generally considered representative of the performance of the broad U.S. bond market.
801850 0120
Archived material may contain dated performance, risk and other information. Current performance may be lower or higher than the performance quoted in the archived material. For the most recent month-end fund performance information visit www.calamos.com. Archived material may contain dated opinions and estimates based on our judgment and are subject to change without notice, as are statements of financial market trends, which are based on current market conditions at the time of publishing. We believed the information provided here was reliable, but do not warrant its accuracy or completeness. This material is not intended as an offer or solicitation for the purchase or sale of any financial instrument. The views and strategies described may not be suitable for all investors. This material has been prepared for informational purposes only, and is not intended to provide, and should not be relied on for, accounting, legal or tax advice. References to future returns are not promises or even estimates of actual returns a client portfolio may achieve. Any forecasts contained herein are for illustrative purposes only and are not to be relied upon as advice or interpreted as a recommendation.
Performance data quoted represents past performance, which is no guarantee of future results. Current performance may be lower or higher than the performance quoted. The principal value and return of an investment will fluctuate so that your shares, when redeemed, may be worth more or less than their original cost. Performance reflected at NAV does not include the Fund’s maximum front-end sales load. Had it been included, the Fund’s return would have been lower.
Archived on January 07, 2021