Investor-Friendlier Closed-End Fund IPOs Broaden Advisor Interest
November 1, 2019
Long distinguished by their ability to provide more attractive yields than other income-generating options, closed-end funds are now enjoying a revival that’s broadening both their appeal to financial advisors and their appropriateness for clients.
“Closed-end funds continue to be a source of income and total return in a prolonged low interest rate/dividend environment—not predicated on overweighting in overbought sectors or regions, high duration bonds or riskier credits,” said Calamos Senior Vice President and Director of Closed-End Fund Products Bob Bush at Calamos' recent Closed-end Fund webcast (financial advisors, listen on-demand).
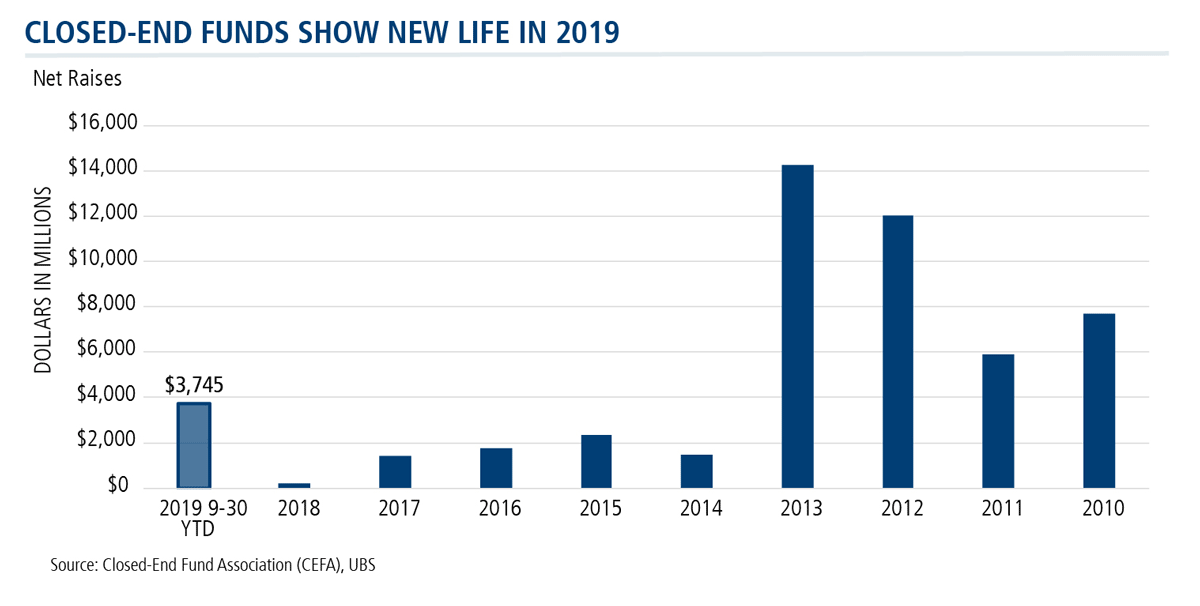
What’s new in 2019, according to Bush, is the enthusiasm being shown in the closed-end fund initial public offering (IPO) market. “Strong markets, no upfront buyer costs on the IPO and a term structure have propelled issuance and supported aftermarket performance as NAVs on these offerings are not subject to issuance costs under the contemporary structure,” said Bush.
Six new funds raised $3.7 billion through September 30, with one fund left on the calendar for 2019.
Barron’s last week took note of the trend (see A New Crop of Closed-End Funds Are Worth a Look), commenting on “more investor-friendly” closed-end fund structures.
Previously, Barron’s reported, “Underwriting fees, including sales commissions to financial advisors, were paid out of fund assets. This meant that a fund with an offering price of $20 a share might start with $19.20 a share in assets after absorbing offering costs…The new funds take a different approach. Sponsors have paid the underwriting fees so that a fund issued at $20 a share starts with $20 in assets."
“Another plus,” the October 25 publication continued, “is that this year’s funds are due to terminate—or give investors the option to redeem shares at asset value—in 12 years. This is intended to limit the discounts at which the funds trade to net asset value.”
2 Powerful Advantages of Closed-end Funds
Overall, it’s been a very healthy market for closed-end fund performance, according to Bush. “Closed-end stock prices have been correlated historically to short-term interest rates because of the relationship to borrowing costs associated with short-term interest rates. With short-term rates at low levels, investors have confidence that the leverage is going to be accretive to returns, especially during bullish equity and fixed income markets,” he said.
“Leverage can really offer outsize returns during this scenario,” said Bush.
“Having firepower—meaning being a buyer when everyone else is a seller or conversely pulling back on the leverage so you’re a seller when everybody else is a buyer—is a huge advantage.”
Matt Freund, Calamos Co-CIO, Head of Fixed Income Strategies and Senior Co-Portfolio Manager
In fact, some of the renewed interest in the closed-end fund product type focuses on the advantage of leverage—something that’s not available to the management of open-end fund portfolios. Calamos Co-CIO, Head of Fixed Income Strategies and Senior Co-Portfolio Manager Matt Freund, CFA calls leverage one of the two most powerful advantages that closed-end funds have over open-end funds.
“I’ve been managing open-ended funds since 1999. And one of the disconnects is that sometimes when the opportunities are greatest you can’t take advantage of them because you have outflows of your own that have to be met. Unless you have maintained enormous levels of liquidity, you have to be a little bit hesitant.
“Think of the fourth quarter of last year,” says Freund, who oversees both open-end and closed-end fund portfolios. “The closed-end funds were at a huge advantage. Why were the bond prices so low? Other funds were seeing outflows and we weren’t because the closed-end fund’s space is closed. We’re not worried about seeing significant outflows during market turmoil. That’s the first lever.
“The second lever is leverage itself,” Freund continues. “Keep in mind that leverage is not a static concept. If there are tremendous opportunities in the market, leverage can be increased. If there are limited opportunities in the market, leverage can be decreased.
“But I will tell you that having firepower—meaning being a buyer when everyone else is a seller or conversely pulling back on the leverage so you’re a seller when everybody else is a buyer—is a huge advantage.”
Strong Secondary Market Performance
About Calamos closed-end funds, in particular:
-
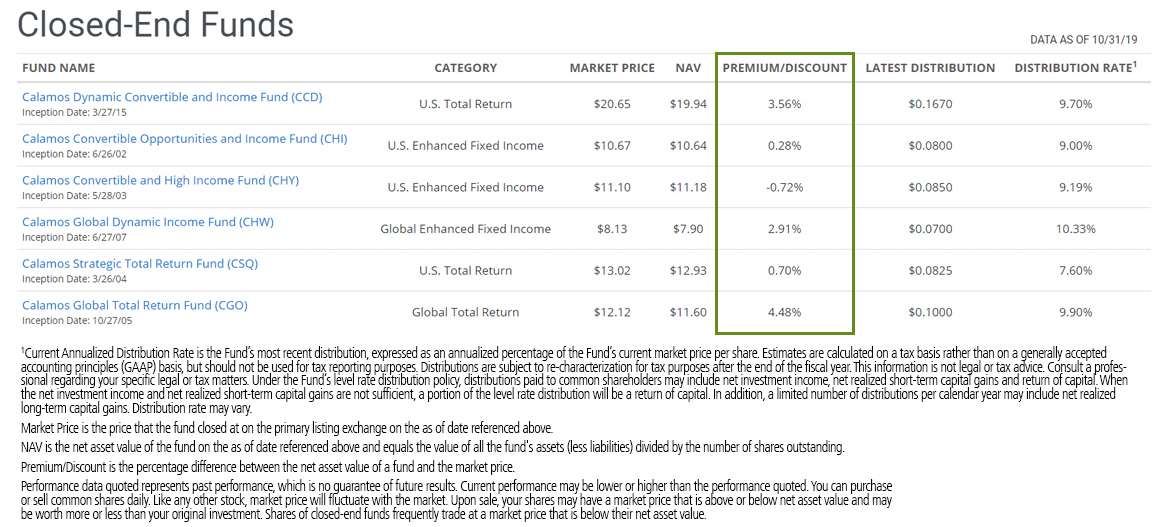
Five of Calamos’ six CEFs traded at a premium to NAV as of October 31. The other, CHY, traded at a discount less than 0.75% at the month’s end. “Our funds traded well in the secondary market due to how they’re constructed, their performance and aftermarket support,” said Bush.
By way of reference, of the 499 U.S. closed-end funds, just 23% traded at a premium (Morningstar, 10/31/19). - All Calamos CEFs have operationally earned their distribution levels YTD.
- Calamos LIBOR-based leverage continues to be accretive to returns as the reinvestment rate has been in excess of the borrowing costs YTD.
- This dynamic benefits the NAV, also driving the price performance of the fund.
Financial advisors, for more information about Calamos closed-end funds, talk to a Calamos Investment Consultant at 888-571-2567 or email caminfo@calamos.com.
Click here to view standardized performance of:
- Calamos Dynamic Convertible and Income Fund (CCD)
- Calamos Convertible Opportunities and Income Fund (CHI)
- Calamos Convertible and High Income Fund (CHY)
- Calamos Global Dynamic Income Fund (CHW)
- Calamos Strategic Total Return Fund (CSQ)
- Calamos Global Total Return Fund (CGO)
Performance data quoted represents past performance, which is no guarantee of future results. Current performance may be lower or higher than the performance quoted. You can purchase or sell common shares daily. Like any other stock, market price will fluctuate with the market. Upon sale, your shares may have a market price that is above or below net asset value and may be worth more or less than your original investment. Shares of closed-end funds frequently trade at a market price that is below their net asset value.
Information contained herein is derived from sources believed to be reliable, but we cannot guarantee its accuracy, completeness, or timeliness.
Opinions and estimates offered constitute our judgment and are subject to change without notice, as are statements of financial market trends, which are based on current market conditions. We believe information provided here is reliable, but do not warrant its accuracy or completeness. The material is not intended as an offer or solicitation for the purchase of any financial instrument. The views and strategies described may not be suitable for all investors. This material has been prepared for informational purposes only and is not intended to provide—and should not be relied on for—accounting, legal or tax advice. References to future returns are not promises or even estimates of actual returns a client may achieve. Any forecasts contained herein are for illustrative purposes only and are not to be relied upon as advice or interpreted as a recommendation. The securities highlighted are discussed for illustrative purposes only. They are not recommendations.
Shares of closed-end funds frequently trade at a market price that is below their net asset value. Leverage creates risks which may adversely affect return, including the likelihood of greater volatility of net asset value and market price of common shares; and fluctuations in dividend rates on any preferred shares.
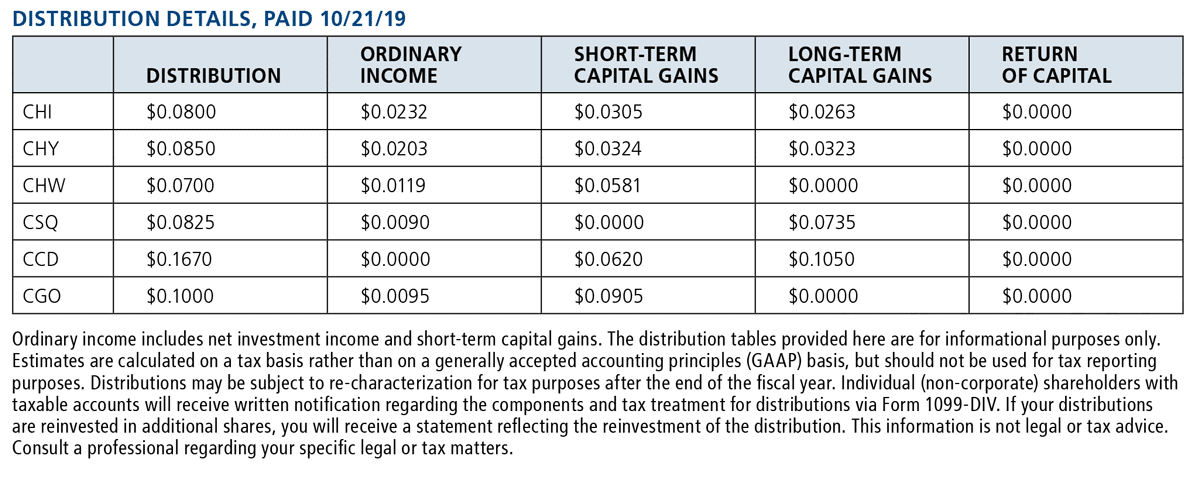
The Calamos Closed-end Funds maintain a level distribution policy. Under the Fund's level rate distribution policy, distributions paid to common shareholders typically include net investment income and net realized short-term capital gains. When the net investment income and net realized short-term capital gains are not sufficient, a portion of the level rate distribution will be a return of capital. In addition, a limited number of distributions per calendar year may include net realized long-term capital gains. Distributions are subject to re-characterization for tax purposes after the end of the fiscal year.
Investment policies, management fees and other matters of interest to prospective investors may be found in each closed-end fund prospectus.
Current Annualized Distribution Rate is the Fund’s most recent distribution, expressed as an annualized percentage of the Fund’s cur- rent market price per share. The Fund’s most recent distribution was $0.1000 per share. Based on our current estimates, we anticipate that approximately $0.1000 is paid from ordi- nary income or capital gains and $0.0000 of the distribution represents a return of capital. Estimates are calculated on a tax basis rather than on a generally accepted accounting principles (GAAP) basis, but should not be used for tax reporting purposes. Distributions are subject to re-characterization for tax purposes after the end of the fiscal year. This information is not legal or tax advice. Consult a professional regarding your specific legal or tax matters. Under the Fund’s managed distribution policy, distributions paid to com- mon shareholders may include net investment income, net realized short-term capital gains, net realized long-term capital gains and return of capital. When the net investment income and net realized capital gains are not sufficient, a portion of the level rate distribu- tion will be a return of capital. In addition, a limited number of distributions per calendar year may include net realized long-term capital gains. Distribution rate may vary. There is no assurance that the Fund will achieve or maintain its investment objective.
Leverage creates risks which may adversely affect return, including the likelihood of greater volatility of net asset value and market price of common shares; and fluctuations in the variable rates of the leverage financing. The ratio is the percent of borrowing to total assets.
801798 1119
Archived material may contain dated performance, risk and other information. Current performance may be lower or higher than the performance quoted in the archived material. For the most recent month-end fund performance information visit www.calamos.com. Archived material may contain dated opinions and estimates based on our judgment and are subject to change without notice, as are statements of financial market trends, which are based on current market conditions at the time of publishing. We believed the information provided here was reliable, but do not warrant its accuracy or completeness. This material is not intended as an offer or solicitation for the purchase or sale of any financial instrument. The views and strategies described may not be suitable for all investors. This material has been prepared for informational purposes only, and is not intended to provide, and should not be relied on for, accounting, legal or tax advice. References to future returns are not promises or even estimates of actual returns a client portfolio may achieve. Any forecasts contained herein are for illustrative purposes only and are not to be relied upon as advice or interpreted as a recommendation.
Performance data quoted represents past performance, which is no guarantee of future results. Current performance may be lower or higher than the performance quoted. The principal value and return of an investment will fluctuate so that your shares, when redeemed, may be worth more or less than their original cost. Performance reflected at NAV does not include the Fund’s maximum front-end sales load. Had it been included, the Fund’s return would have been lower.
Archived on October 30, 2020