CPZ Outpaces S&P 500, VXA0 and MSCI World in Q1
April 9, 2021
The following post was written by Robert Bush, Calamos Senior Vice President and Director of Closed-End Fund Products.
As of last night, Calamos Long/Short Equity & Dynamic Income Trust (CPZ) was trading at a 10.72% discount to NAV, offering compelling value not only relative to the performance of its underlying portfolio, but also in the context of what it has offered.
| Investment | Q1 2021 Returns |
|---|---|
| Calamos Long/Short Equity & Dynamic Income Trust (CPZ) | |
| CPZ Price | 16.95% |
| CPZ NAV | 10.98% |
| S&P 500 Index | 6.17% |
| MSCI World Index | 5.04% |
| ICE BofA All U.S. Convertibles Index (VXA0) | 2.86% |
| ICE BofA U.S. High Yield Index | 0.82% |
Source: Morningstar
- Through its asset allocation to sectors that have offered value in 2021, CPZ’s NAV and price returns YTD are outpacing major stock and bond indexes, with returns of 16.95%, and 10.98%, respectively as of 3/31/21.
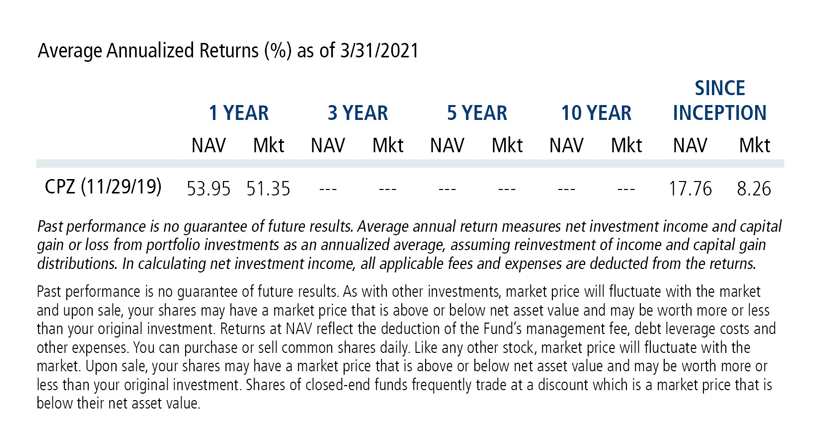
- CPZ’s performance since inception has improved considerably, with returns of 8.26% on price and 17.76% on NAV as of 3/31/21.
- In spite of market volatility and the inherent challenges of a new fund in 2020, CPZ had no return of capital associated with its distribution in 2020 or 2021 YTD estimates (for more, see this post).
- CPZ has increased its distribution rate 18% since inception in November 2019, an outstanding accomplishment given the extreme market turmoil experienced during its first year of existence.
- CPZ is uniquely positioned in the closed-end fund arena to offer risk-managed equity exposure in global stock markets through a time-tested long/short strategy.
- The active asset allocation allows for investments in income-producing securities, such as preferred stock and high yield bonds to support monthly distributions.
Co-CIO and Senior Co-Portfolio Manager Michael Grant’s insight into financial markets is reflected in the equity investments related to CPZ:
- Positioning. Expecting that the markets’ ultimate recovery would not be as synchronized as its steep decline in 2020, Grant structured the equity side of the portfolio in a “barbell format” to allow optimal participation in a relatively disjointed recovery. While he believed that sectors that were especially susceptible to the pandemic would recover, he expected defensive quality growth names would continue to perform well.
- Sector weightings. While value and cyclical-oriented sectors (e.g., Industrials, Financials and Energy) widely underperformed last year, they led S&P 500 performance in the first quarter. Each contributed double-digit returns for the period. Grant was resolute in his conviction that these sectors, the ultimate beneficiaries of the economic recovery from COVID-19, would be best poised to perform. The overweighting in these sectors proved beneficial, especially over the last six months.
- U.S.-centric Focus. While emerging markets had a stellar performance in 2020, they have underperformed relative to the U.S. in the first quarter (S&P 500 6.17% vs. MSCI Emerging Markets Index 2.34%). Although Grant is keeping an open mind to the consensus that EM should perform well this year, he is not compelled at this time to meaningfully take on exposure.
- Conviction. The first quarter presents another illustration of Grant’s conviction. While there were concerns early in the period regarding the ability of the vaccine to be broadly distributed, thereby potentially slowing the process of the world returning to a greater sense of “normalization,” Grant’s conviction that the “recovery trade” would ultimately prevail led to strong performance in the first quarter.
At its current price discount (4/08/21) to NAV of 10.72%, CPZ offers compelling value. However, the increased distributions and the recent performance has attracted interest in the product and motivated return on price, which has helped narrow the discount over the past several months.
| Quarter-end | Quarter-end Discount | Monthly Distribution Per Share | NAV Returns for Previous Quarter | Price Returns for Previous Quarter |
|---|---|---|---|---|
| 9/30/2020 | -18.01% | $0.11 | -2.06% | -4.09% |
| 12/31/2020 | -15.22% | $0.12 | 18.15% | 22.43% |
| 3/31/2021 | -10.66% | $0.13 | 10.98% | 16.95% |
CPZ may make an excellent addition to a client who is concerned about equity market volatility and high current market valuations, and in search of income that is not necessarily tied to high duration or low credit fixed income securities. In addition, CPZ currently is not emphasizing emerging markets or small cap stocks, which have come under pressure recently. In spite of outstanding recent performance, for now, CPZ still offers a compelling value for investors.
Investment professionals, for more information on CPZ or any of our seven closed-end funds, contact your Calamos Investment Consultant at 888-571-2567 or caminfo@calamos.com
Before investing, carefully consider the fund’s investment objectives, risks, charges and expenses. Please see the prospectus and summary prospectus containing this and other information which can be obtained by calling 1-866-363-9219. Read it carefully before investing.
Performance data quoted represents past performance, which is no guarantee of future results. Current performance may be lower or higher than the performance quoted. You can purchase or sell common shares daily. Like any other stock, market price will fluctuate with the market. Upon sale, your shares may have a market price that is above or below net asset value and may be worth more or less than your original investment. Shares of closed-end funds frequently trade at a market price that is below their net asset value.
Opinions and estimates offered constitute our judgment and are subject to change without notice, as are statements of financial market trends, which are based on current market conditions. We believe information provided here is reliable, but do not warrant its accuracy or completeness. The material is not intended as an offer or solicitation for the purchase of any financial instrument. The views and strategies described may not be suitable for all investors. This material has been prepared for informational purposes only and is not intended to provide—and should not be relied on for—accounting, legal or tax advice. References to future returns are not promises or even estimates of actual returns a client may achieve. Any forecasts contained herein are for illustrative purposes only and are not to be relied upon as advice or interpreted as a recommendation. The securities highlighted are discussed for illustrative purposes only. They are not recommendations.
Shares of closed-end funds frequently trade at a market price that is below their net asset value. Leverage creates risks which may adversely affect return, including the likelihood of greater volatility of net asset value and market price of common shares; and fluctuations in dividend rates on any preferred shares.
The Calamos Closed-end Funds maintain a level distribution policy. Under the Fund's level rate distribution policy, distributions paid to common shareholders typically include net investment income and net realized short-term capital gains. When the net investment income and net realized short-term capital gains are not sufficient, a portion of the level rate distribution will be a return of capital. In addition, a limited number of distributions per calendar year may include net realized long-term capital gains. Distributions are subject to re-characterization for tax purposes after the end of the fiscal year.
Investment policies, management fees and other matters of interest to prospective investors may be found in each closed-end fund prospectus.
Current Annualized Distribution Rate is the Fund’s most recent distribution, expressed as an annualized percentage of the Fund’s current market price per share. The Fund’s most recent distribution was $0.1300 per share. Estimates are calculated on a tax basis rather than on a generally accepted accounting principles (GAAP) basis, but should not be used for tax reporting purposes. Distributions are subject to re-characterization for tax purposes after the end of the fiscal year. This information is not legal or tax advice. Consult a professional regarding your specific legal or tax matters. Under the Fund’s managed distribution policy, distributions paid to common shareholders may include net investment income, net realized short-term capital gains, net realized long-term capital gains and return of capital. When the net investment income and net realized capital gains are not sufficient, a portion of the level rate distribution will be a return of capital. In addition, a limited number of distributions per calendar year may include net realized long-term capital gains. Distribution rate may vary.
Current Annualized Distribution Rate is the Fund’s most recent distribution, expressed as an annualized percentage of the Fund’s current market price per share. Information regarding the Fund’s most recent distribution can be found in the table titled “Distribution Details,” which appears above. Estimates are calculated on a tax basis rather than on a generally accepted accounting principles (GAAP) basis but should not be used for tax reporting purposes. Distributions are subject to re-characterization for tax purposes after the end of the fiscal year. This information is not legal or tax advice. Consult a professional regarding your specific legal or tax matters. Under the managed rate distribution policy of CPZ, the distributions paid to common shareholders may include net investment income, net realized short-term capital gains and return of capital. When the net investment income and net realized short-term capital gains are not sufficient, a portion of the level rate distribution will be a return of capital. In addition, a limited number of distributions per calendar year may include net realized long-term capital gains. Distribution rate may vary.
The MSCI World Index is a free float-adjusted market capitalization weighted index that is designed to measure the equity market performance of developed markets.
The ICE BofA All U.S. Convertibles Index (VXA0) measures the return of all U.S. convertibles.
The ICE BofA U.S. High Yield Index is an unmanaged index of U.S. high yield debt securities.
The S&P 500 Index is generally considered representative of the U.S. stock market.
The MSCI Emerging Markets Index is a free float-adjusted market capitalization index that is designed to measure equity market performance of emerging markets. The index is calculated on a total return basis, which includes reinvestment of gross dividends before deduction of withholding taxes.
802357 421
Archived material may contain dated performance, risk and other information. Current performance may be lower or higher than the performance quoted in the archived material. For the most recent month-end fund performance information visit www.calamos.com. Archived material may contain dated opinions and estimates based on our judgment and are subject to change without notice, as are statements of financial market trends, which are based on current market conditions at the time of publishing. We believed the information provided here was reliable, but do not warrant its accuracy or completeness. This material is not intended as an offer or solicitation for the purchase or sale of any financial instrument. The views and strategies described may not be suitable for all investors. This material has been prepared for informational purposes only, and is not intended to provide, and should not be relied on for, accounting, legal or tax advice. References to future returns are not promises or even estimates of actual returns a client portfolio may achieve. Any forecasts contained herein are for illustrative purposes only and are not to be relied upon as advice or interpreted as a recommendation.
Performance data quoted represents past performance, which is no guarantee of future results. Current performance may be lower or higher than the performance quoted. The principal value and return of an investment will fluctuate so that your shares, when redeemed, may be worth more or less than their original cost. Performance reflected at NAV does not include the Fund’s maximum front-end sales load. Had it been included, the Fund’s return would have been lower.
Archived on April 08, 2022