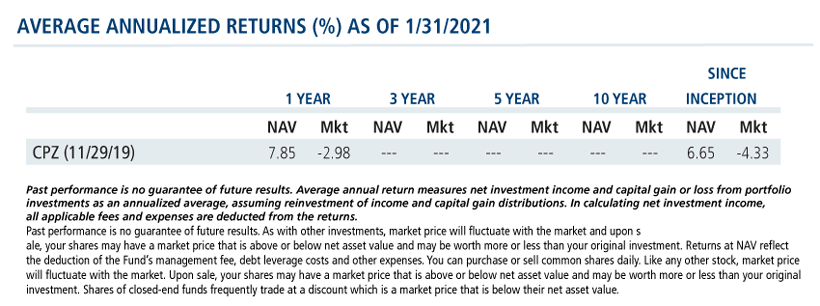
CPZ’s NAV Performance YTD Has Beaten the S&P 500, VXA0 and MSCI World Indexes
February 26, 2021
As of Thursday evening, Calamos Long/Short Equity & Dynamic Income Trust (CPZ) was trading at a 14.5% discount to NAV, offering compelling value not only relative to the performance of its underlying portfolio, but also in the context of what it has offered.
- Through its asset allocation to sectors that have offered value in 2021, CPZ’s NAV returns YTD are outpacing major stock and bond indexes.
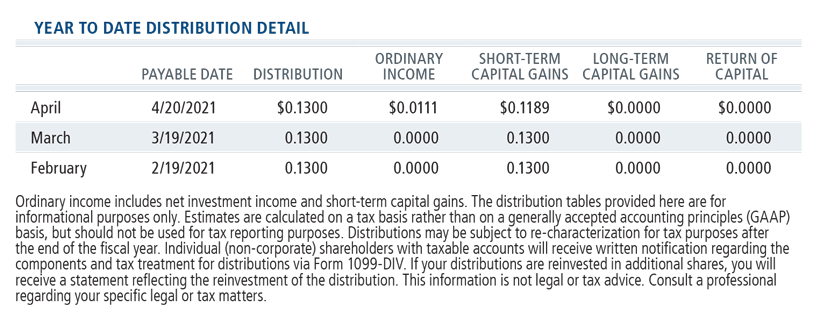
- In spite of market volatility and the inherent challenges of being a new closed-end fund in 2020, CPZ had no return of capital associated with its distribution.
- CPZ has increased its distribution rate 18% since inception in November 2019.
CPZ is uniquely positioned in the closed-end fund arena to offer risk-managed equity exposure in global stock markets through a time-tested long/short strategy. Its active asset allocation allows for investments in income-producing securities, such as preferred stock and high yield bonds, to support monthly distributions.
At its current price discount to NAV of 14.5%, CPZ offers compelling value. It may make an excellent addition for clients who are concerned about equity market volatility and high current market valuations—but in search of income that is not necessarily tied to high duration or low credit fixed income securities.
| Investment | 2/25/21 YTD Returns |
|---|---|
| Calamos Long/Short Equity & Dynamic Income Trust (CPZ) | 6.21% |
| S&P 500 Index | 2.19% |
| MSCI World Index | 2.83% |
| ICE BofA All U.S. Convertibles Index (VXA0) | 5.26% |
| ICE BofA U.S. High Yield Index | 0.90% |
Source: Morningstar
Investment professionals, for more information on CPZ or any of our seven closed-end funds, contact your Calamos Investment Consultant at 888-571-2567 or caminfo@calamos.com.
Before investing, carefully consider the fund’s investment objectives, risks, charges and expenses. Please see the prospectus and summary prospectus containing this and other information which can be obtained by calling 1-866-363-9219. Read it carefully before investing.
Performance data quoted represents past performance, which is no guarantee of future results. Current performance may be lower or higher than the performance quoted. You can purchase or sell common shares daily. Like any other stock, market price will fluctuate with the market. Upon sale, your shares may have a market price that is above or below net asset value and may be worth more or less than your original investment. Shares of closed-end funds frequently trade at a market price that is below their net asset value.
Opinions and estimates offered constitute our judgment and are subject to change without notice, as are statements of financial market trends, which are based on current market conditions. We believe information provided here is reliable, but do not warrant its accuracy or completeness. The material is not intended as an offer or solicitation for the purchase of any financial instrument. The views and strategies described may not be suitable for all investors. This material has been prepared for informational purposes only and is not intended to provide—and should not be relied on for—accounting, legal or tax advice. References to future returns are not promises or even estimates of actual returns a client may achieve. Any forecasts contained herein are for illustrative purposes only and are not to be relied upon as advice or interpreted as a recommendation. The securities highlighted are discussed for illustrative purposes only. They are not recommendations.
Shares of closed-end funds frequently trade at a market price that is below their net asset value. Leverage creates risks which may adversely affect return, including the likelihood of greater volatility of net asset value and market price of common shares; and fluctuations in dividend rates on any preferred shares.
The Calamos Closed-end Funds maintain a level distribution policy. Under the Fund's level rate distribution policy, distributions paid to common shareholders typically include net investment income and net realized short-term capital gains. When the net investment income and net realized short-term capital gains are not sufficient, a portion of the level rate distribution will be a return of capital. In addition, a limited number of distributions per calendar year may include net realized long-term capital gains. Distributions are subject to re-characterization for tax purposes after the end of the fiscal year.
Investment policies, management fees and other matters of interest to prospective investors may be found in each closed-end fund prospectus.
Current Annualized Distribution Rate is the Fund’s most recent distribution, expressed as an annualized percentage of the Fund’s current market price per share. The Fund’s most recent distribution was $0.1300 per share. Estimates are calculated on a tax basis rather than on a generally accepted accounting principles (GAAP) basis, but should not be used for tax reporting purposes. Distributions are subject to re-characterization for tax purposes after the end of the fiscal year. This information is not legal or tax advice. Consult a professional regarding your specific legal or tax matters. Under the Fund’s managed distribution policy, distributions paid to common shareholders may include net investment income, net realized short-term capital gains, net realized long-term capital gains and return of capital. When the net investment income and net realized capital gains are not sufficient, a portion of the level rate distribution will be a return of capital. In addition, a limited number of distributions per calendar year may include net realized long-term capital gains. Distribution rate may vary.
Investments by the Fund(s) in lower-rated securities involve substantial risk of loss and present greater risks than investments in higher-rated securities, including less liquidity and increased price sensitivity to changing interest rates and to a deteriorating economic environment.
Fixed Income Security Risk. Fixed income securities are subject to interest rate risk; as interest rates go up, the value of debt securities in the Fund’s portfolio generally will decline. Convertible Securities Risk. The value of a convertible security is influenced by changes in interest rates, with investment value declining as interest rates increase and increasing as interest rates decline. The credit standing of the issuer and other factors also, may have an effect on the convertible security’s investment value. Equity Securities Risk. Equity investments are subject to greater fluctuations in market value than other asset classes as a result of such factors as the issuer’s business performance, investor perceptions, stock market trends and general economic conditions. Equity securities are subordinated to bonds and other debt instruments in a company’s capital structure in terms of priority to corporate income and liquidation payments. The Fund may invest in preferred stocks and convertible securities of any rating, including below investment grade. Short Selling Risk. The Fund will engage in short sales for investment and risk management purposes, including when the Adviser believes an investment will underperform due to a greater sensitivity to earnings growth of the issuer, default risk or interest rates. In times of unusual or adverse market, economic, regulatory or political conditions, the Fund may not be able, fully or partially, to implement its short selling strategy. Periods of unusual or adverse market, economic, regulatory or political conditions may exist for extended periods of time. Short sales are transactions in which the Fund sells a security or other instrument that it does not own but can borrow in the market. Short selling allows the Fund to profit from a decline in market price to the extent such decline exceeds the transaction costs and the costs of borrowing the securities and to obtain a low cost means of financing long investments that the Adviser believes are attractive. If a security sold short increases in price, the Fund may have to cover its short position at a higher price than the short sale price, resulting in a loss. The Fund will have substantial short positions and must borrow those securities to make delivery to the buyer under the short sale transaction. The Fund may not be able to borrow a security that it needs to deliver or it may not be able to close out a short position at an acceptable price and may have to sell related long positions earlier than it had expected. Thus, the Fund may not be able to successfully implement its short sale strategy due to limited availability of desired securities or for other reasons. Limited Term Risk. Unless the limited term provision of the Fund’s Declaration of Trust is amended by shareholders in accordance with the Declaration of Trust, or unless the Fund completes the Eligible Tender Offer and converts to perpetual existence, the Fund will dissolve on the Dissolution Date. The Fund is not a so called “target date” or “life cycle” fund whose asset allocation becomes more conservative over time as its target date, often associated with retirement, approaches. In addition, the Fund is not a “target term” fund whose investment objective is to return its original NAV on the Dissolution Date. The Fund’s investment objective and policies are not designed to seek to return to investors that purchase Shares in this offering their initial investment of $20.00 per Share on the Dissolution Date or in the Eligible Tender Offer, and such investors and investors that purchase Shares after the completion of this offering may receive more or less than their original investment upon dissolution or in the Eligible Tender Offer.
The MSCI World Index is a free float-adjusted market capitalization weighted index that is designed to measure the equity market performance of developed markets.
The ICE BofA All U.S. Convertibles Index (VXA0) measures the return of all U.S. convertibles.
The ICE BofA U.S. High Yield Index is an unmanaged index of U.S. high yield debt securities.
The S&P 500 Index is generally considered representative of the U.S. stock market.
802318 221
Archived material may contain dated performance, risk and other information. Current performance may be lower or higher than the performance quoted in the archived material. For the most recent month-end fund performance information visit www.calamos.com. Archived material may contain dated opinions and estimates based on our judgment and are subject to change without notice, as are statements of financial market trends, which are based on current market conditions at the time of publishing. We believed the information provided here was reliable, but do not warrant its accuracy or completeness. This material is not intended as an offer or solicitation for the purchase or sale of any financial instrument. The views and strategies described may not be suitable for all investors. This material has been prepared for informational purposes only, and is not intended to provide, and should not be relied on for, accounting, legal or tax advice. References to future returns are not promises or even estimates of actual returns a client portfolio may achieve. Any forecasts contained herein are for illustrative purposes only and are not to be relied upon as advice or interpreted as a recommendation.
Performance data quoted represents past performance, which is no guarantee of future results. Current performance may be lower or higher than the performance quoted. The principal value and return of an investment will fluctuate so that your shares, when redeemed, may be worth more or less than their original cost. Performance reflected at NAV does not include the Fund’s maximum front-end sales load. Had it been included, the Fund’s return would have been lower.
Archived on February 26, 2022