Looking for Income? Don’t Overlook Closed-end Fund CPZ
This blog post was written by Robert F. Bush, Jr., Senior Vice President, Director of Closed-End Funds.
Investors’ thirst for income remains largely unquenched. With the 10-year Treasury bond yielding 0.93%, and the S&P 500 offering a paltry 1.54% yield (both as of December 31, 2020), attractive distributions are hard to come by in the financial markets. Even the ICE BofA U.S. High Yield Index, which invests primarily in lower quality, more risky credits, is offering a yield of just 4.21%.

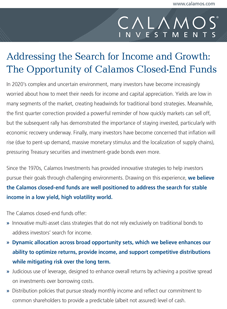
Also see our recent whitepaper “Addressing the Search for Income and Growth: The Opportunity of Calamos Closed-End Funds” by John P. Calamos, Sr., Founder, Chairman and Global Chief Investment Officer.
Calamos is a closed-end fund manager, with experience dating back to 2002, and a suite of seven funds totaling more than $8 billion in assets under management as of year-end 2020.
Since the 1970s, Calamos Investments has provided innovative strategies to help investors pursue their goals through challenging environments. Drawing on this experience, we believe the Calamos closed-end funds are well positioned to address the search for income in a low yield, high volatility world, offering distributions on price between 7.09% and 8.79% as of December 31, 2020.
While each of our funds has distinct benefits, we will briefly cover our most recent, Calamos Long/Short Equity & Dynamic Income Trust (CPZ), established in November 2019. As we posited to investors at the time, the fund has three primary objectives:
- Address investor concerns over equity risk due to volatility resulting from higher volatility, coupled with record-high equity valuations.
- Offer a high level of current income in a continued low interest rate environment, with vigilance to credit, industry-specific or geopolitical risks.
- Provide active risk management through a dynamic and flexible securities allocation approach, as well as efficiently hedged market exposure.
What makes CPZ unique and distinct from not only the other Calamos closed-end funds, but all other U.S.-based closed-end funds, is its focus on a long-short equity strategy. This constitutes at least 50% of the fund’s net assets. The capability builds on Calamos history as an alternatives pioneer, which dates back to 1990, and which is core to the firm’s commitment to risk management in all of our investment approaches.
How CPZ Can Invest
The objective of the CPZ portfolio is to source multiple avenues for total return to investors to support distributions, grow NAV and mitigate investment risk.
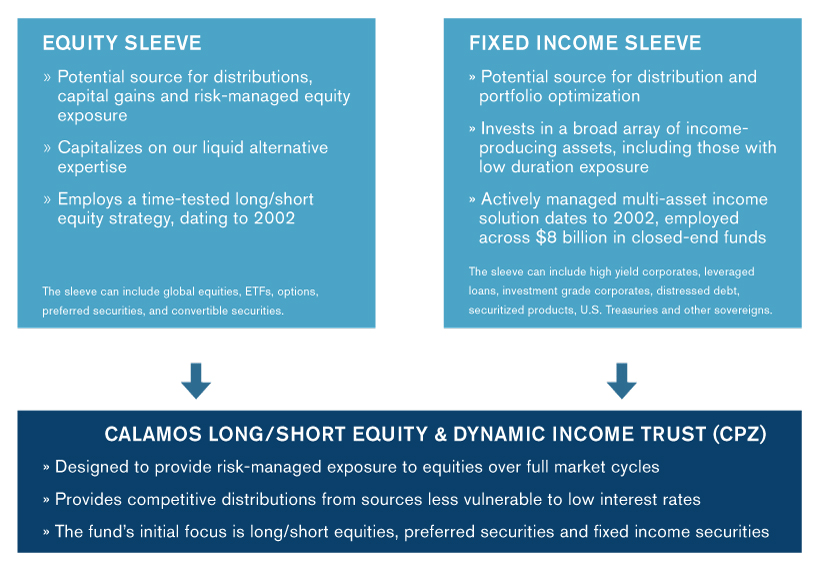
To accomplish this objective, we employ a two-pronged investment approach. The fund includes two risk/managed sleeves: (1) an equity sleeve that includes our long/short strategy managed by Michael Grant, Co-CIO, and Senior Co-Portfolio Manager, Head of Long/Short Strategies, and team and (2) a fixed income sleeve managed by a team led by Matt Freund, CFA, Co-CIO, Head of Fixed Income Strategies and Senior Co-Portfolio Manager.
CPZ combines Calamos time-tested capabilities to address investors’ needs.

What CPZ Can Own
CPZ can invest in multiple asset classes, including:
- Global equities
- ETFs
- Options
- Convertible securities
- Preferred securities
- High yield corporates
- Leveraged loans
- Investment grade corporates
- Distressed debt
- Securitized products
- U.S. Treasuries and other sovereigns
What CPZ Owns
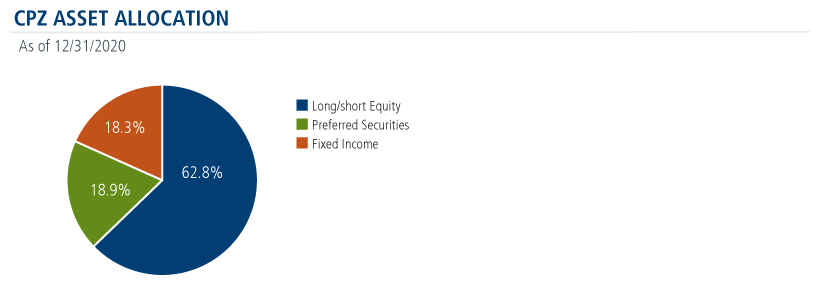
Below you’ll see the current asset allocation. We believe this asset mix optimizes CPZ’s ability to provide risk-managed equity exposure and sources of income to support monthly distributions.

As mentioned, with wide investment parameters by design, CPZ may invest and participate in a plethora of investments and strategies seeking to not only optimize the total return and income aspects of the portfolio, but also potentially mitigate market risk across the spectrum of its investible assets. The makeup of its distributions validates its use of multiple sources for distributions.
On November 2, 2020, Calamos announced the estimated allocation of CPZ's fiscal year-to-date distributions.
| Net Income | 30.4% |
| Short-Term Capital Gains | 69.6% |
| Return of Capital | 0.0% |
The expectation is that CPZ will incur no return of capital for its 2020 fiscal distributions, meaning that payouts were sourced entirely by the fund’s earnings.
One-year-old CPZ Increased Distributions
On December 1, 2020, CPZ announced a monthly increase in distributions from $0.11 to $0.12 per share, representing over a 9% increase. Regarding CPZ’s distribution increase, John P. Calamos, Sr., Founder, Chairman and Global Chief Investment Officer, stated, “…The increase in CPZ’s distribution rate is indicative of the high conviction that we have in the fund and our portfolio management team’s ability to optimize both current and anticipated opportunities moving forward.”
“The economic tailwinds are significant as excess consumer savings and historic stimulus meet pent-up demand after a year of pandemic isolation. As the unemployed return to work, aggregate wage growth will inflect higher…With the exception of some notable bubbles in long-duration concept stocks, the risk versus reward for equities remains favorable—for now.”
Michael Grant, Co-CIO, and Senior Co-Portfolio Manager, Head of Long/Short Strategies
We believe it is a testament to CPZ’s strategy and its team that CPZ was able to not only maintain its distribution rate but meaningfully increase it during one of the most volatile market environments in history. And, this was completely sourced by earned income and capital gains.
A Good Value at Its Current Price
As of December 31, 2020, CPZ traded at a 15% discount to its associated NAV, offering what we believe is a compelling valuation relative to its underlying portfolio value.
CPZ Positioning
CPZ is currently positioned to take advantage of what we believe will be compelling opportunities in financial markets in the wake of the global pandemic. While our expectation is that many areas and sectors will benefit as global economies eventually reopen, such advances may be selective and not without a measure of volatility. In this environment, we believe an active, risk-managed product will prevail, while continuing to be a source of regular monthly distributions.
Investment professionals, for more information on CPZ or any of our seven closed-end funds, contact your Calamos Investment Consultant at 888-571-2567 or caminfo@calamos.com.
Before investing, carefully consider the fund’s investment objectives, risks, charges and expenses. Please see the prospectus and summary prospectus containing this and other information which can be obtained by calling 1-866-363-9219. Read it carefully before investing.
Opinions are subject to change due to changes in the market, economic conditions or changes in the legal and/or regulatory environment and may not necessarily come to pass. This information is provided for informational purposes only and should not be considered tax, legal, or investment advice. References to specific securities, asset classes and financial markets are for illustrative purposes only and are not intended to be, and should not be interpreted as, recommendations.
Performance data quoted represents past performance, which is no guarantee of future results. Current performance may be lower or higher than the performance quoted. You can purchase or sell common shares daily. Like any other stock, market price will fluctuate with the market. Upon sale, your shares may have a market price that is above or below net asset value and may be worth more or less than your original investment. Shares of closed-end funds frequently trade at a market price that is below their net asset value.
Information contained herein is derived from sources believed to be reliable, but we cannot guarantee its accuracy, completeness, or timeliness.
Opinions and estimates offered constitute our judgment and are subject to change without notice, as are statements of financial market trends, which are based on current market conditions. We believe information provided here is reliable, but do not warrant its accuracy or completeness. The material is not intended as an offer or solicitation for the purchase of any financial instrument. The views and strategies described may not be suitable for all investors. This material has been prepared for informational purposes only and is not intended to provide—and should not be relied on for—accounting, legal or tax advice. References to future returns are not promises or even estimates of actual returns a client may achieve. Any forecasts contained herein are for illustrative purposes only and are not to be relied upon as advice or interpreted as a recommendation. The securities highlighted are discussed for illustrative purposes only. They are not recommendations.
Shares of closed-end funds frequently trade at a market price that is below their net asset value. Leverage creates risks which may adversely affect return, including the likelihood of greater volatility of net asset value and market price of common shares; and fluctuations in dividend rates on any preferred shares.
The Calamos Closed-end Funds maintain a level distribution policy. Under the Fund's level rate distribution policy, distributions paid to common shareholders typically include net investment income and net realized short-term capital gains. When the net investment income and net realized short-term capital gains are not sufficient, a portion of the level rate distribution will be a return of capital. In addition, a limited number of distributions per calendar year may include net realized long-term capital gains. Distributions are subject to re-characterization for tax purposes after the end of the fiscal year.
Investment policies, management fees and other matters of interest to prospective investors may be found in each closed-end fund prospectus.
Current Annualized Distribution Rate is the Fund’s most recent distribution, expressed as an annualized percentage of the Fund’s cur- rent market price per share. The Fund’s most recent distribution was $0.1000 per share. Based on our current estimates, we anticipate that approximately $0.1000 is paid from ordinary income or capital gains and $0.0000 of the distribution represents a return of capital. Estimates are calculated on a tax basis rather than on a generally accepted accounting principles (GAAP) basis, but should not be used for tax reporting purposes. Distributions are subject to re-characterization for tax purposes after the end of the fiscal year. This information is not legal or tax advice. Consult a professional regarding your specific legal or tax matters. Under the Fund’s managed distribution policy, distributions paid to common shareholders may include net investment income, net realized short-term capital gains, net realized long-term capital gains and return of capital. When the net investment income and net realized capital gains are not sufficient, a portion of the level rate distribution will be a return of capital. In addition, a limited number of distributions per calendar year may include net realized long-term capital gains. Distribution rate may vary.
S&P 500 Index is generally considered representative of the U.S. stock market.
ICE BofA U.S. High Yield Index is a market-capitalization-weighted index of domestic and Yankee high-yield bonds. The index tracks the performance of high-yield securities traded in the U.S. bond market.
802289 0121
Archived material may contain dated performance, risk and other information. Current performance may be lower or higher than the performance quoted in the archived material. For the most recent month-end fund performance information visit www.calamos.com. Archived material may contain dated opinions and estimates based on our judgment and are subject to change without notice, as are statements of financial market trends, which are based on current market conditions at the time of publishing. We believed the information provided here was reliable, but do not warrant its accuracy or completeness. This material is not intended as an offer or solicitation for the purchase or sale of any financial instrument. The views and strategies described may not be suitable for all investors. This material has been prepared for informational purposes only, and is not intended to provide, and should not be relied on for, accounting, legal or tax advice. References to future returns are not promises or even estimates of actual returns a client portfolio may achieve. Any forecasts contained herein are for illustrative purposes only and are not to be relied upon as advice or interpreted as a recommendation.
Performance data quoted represents past performance, which is no guarantee of future results. Current performance may be lower or higher than the performance quoted. The principal value and return of an investment will fluctuate so that your shares, when redeemed, may be worth more or less than their original cost. Performance reflected at NAV does not include the Fund’s maximum front-end sales load. Had it been included, the Fund’s return would have been lower.
Archived on January 14, 2022Cookies
This website uses cookies. By continuing to use this website, you consent to the use of cookies. Learn more about our cookie usage.

