CIHEX Beats Back 3 Equity Market Drawdowns to Finish 2018 Positive
January 10, 2019
As of March 1, Calamos Hedged Equity Income Fund’s name has been changed to Calamos Hedged Equity Fund.
The market didn’t make it easy to be an equity investor in 2018:
- 32 S&P 500 down 1% or worse days, including 16 days 2% down, four 3% down and one 4% down
- A 580-point range from the high to the low point in the S&P
- Annualized S&P daily volatility of 17.1%, which was almost triple the 2017 vol
The S&P finished down 4.38%, and your clients might have fared worse: the average diversified U.S. stock fund fell almost twice that (-7.7%) after a -14.8% fourth quarter (Thomson Reuters Lipper data).
Financial advisors, if you think 2018’s choppiness will continue in 2019, think about how Calamos Hedged Equity Income Fund (CIHEX) could dampen the effect of equity volatility in the portfolios you’re building.
Last year didn’t throw anything at CIHEX that it couldn’t handle. By December 31, it was one of the rare equity funds that surrendered no ground, finishing with a 0.89% return.
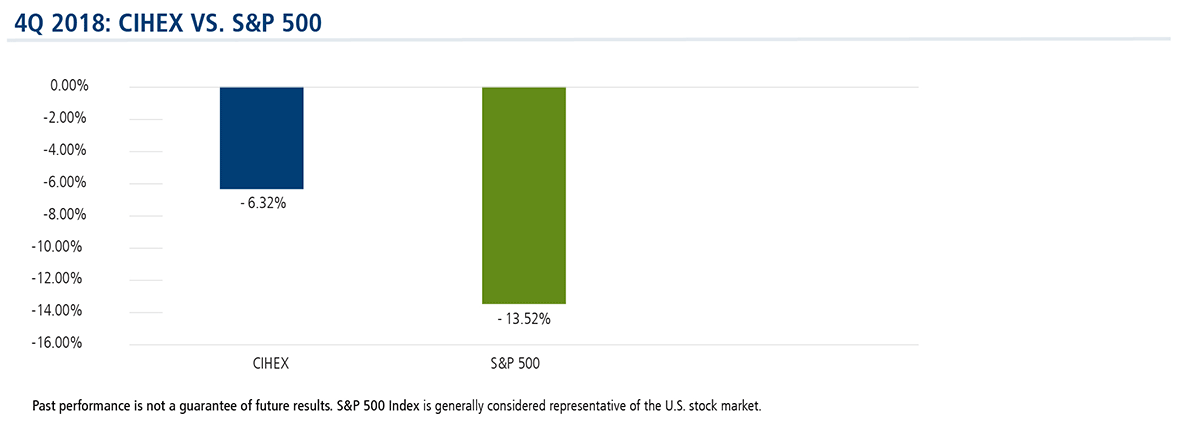
Fourth quarter? A challenge, to be sure, but CIHEX more than halved the benchmark’s loss.
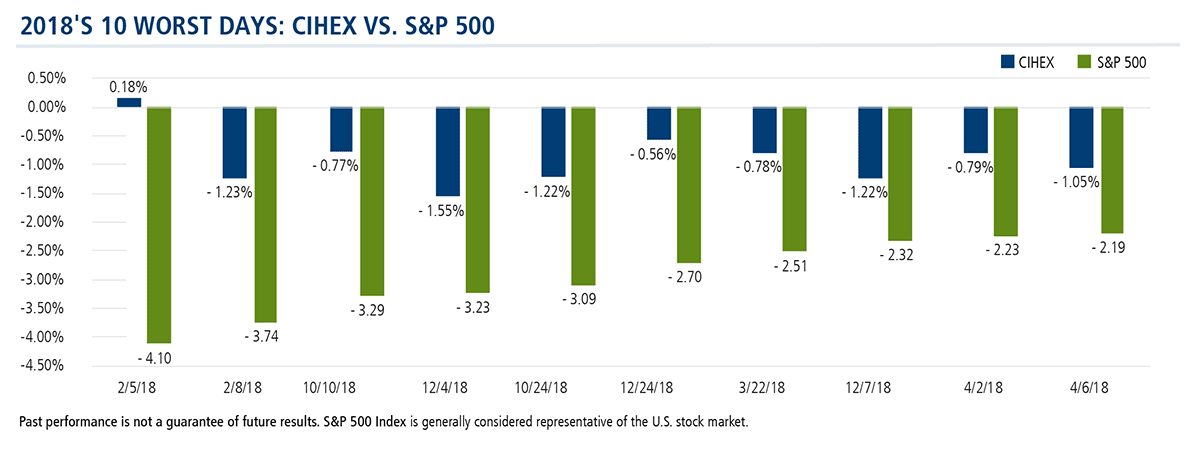
On the very worst days of the year? CIHEX contained the drawdowns.
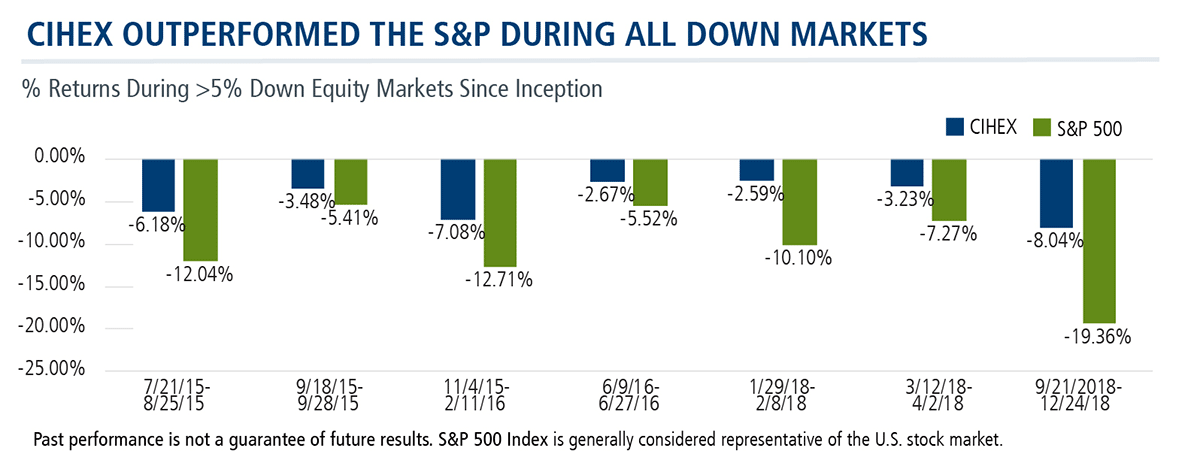
CIHEX’s 2018 performance is consistent with its performance during previous drawdowns. It’s outperformed the S&P in all >5% down markets since its inception in 2014.
This is what CIHEX—an equity alternative that seeks better upside/downside asymmetry than long-only equities—does. The fund takes a core long equity portfolio of favorable asymmetric upside/downside design and blends it with the freedom of the portfolio management team to optimize how options are implemented and alpha generated.
“We continuously search for a hedge that gives us as much downside protection as possible, while giving up as little participation as possible in a market rally,” explains Eli Pars, CFA, Co-Chief Investment Officer and Head of Alternative Strategies and Co-Head of Convertible Strategies.
Advisors, for more information about CIHEX, contact your Calamos Investment Consultant at 888-571-2567 or caminfo@calamos.com.
Calamos ranks fourth on the list of alternative fund managers by assets under management in the Morningstar Alternatives Category as of 11/30/18.
Click here to view CIHEX's standardized performance.
Before investing, carefully consider the fund’s investment objectives, risks, charges and expenses. Please see the prospectus and summary prospectus containing this and other information which can be obtained by calling 1-866-363-9219. Read it carefully before investing.
Opinions and estimates offered constitute our judgment and are subject to change without notice, as are statements of financial market trends, which are based on current market conditions. We believe the information provided here is reliable, but do not warrant its accuracy or completeness. This material is not intended as an offer or solicitation for the purchase or sale of any financial instrument. The views and strategies described may not be suitable for all investors. The opinions and views of third parties do not represent the opinions or views of Calamos Investments LLC. Opinions are subject to change due to changes in the market, economic conditions or changes in the legal and/or regulatory environment and may not necessarily come to pass. This information is provided for informational purposes only and should not be considered tax, legal, or investment advice. References to specific securities, asset classes and financial markets are for illustrative purposes only and are not intended to be, and should not be interpreted as, recommendations.
An investment in the Fund(s) is subject to risks, and you could lose money on your investment in the Fund(s). There can be no assurance that the Fund(s) will achieve its investment objective. Your investment in the Fund(s) is not a deposit in a bank and is not insured or guaranteed by the Federal Deposit Insurance Corporation (FDIC) or any other government agency. The risks associated with an investment in the Fund(s) can increase during times of significant market volatility. The Fund(s) also has specific principal risks, which are described below. More detailed information regarding these risks can be found in the Fund's prospectus.
Alternative investments are not suitable for all investors.
S&P 500 Index is generally considered representative of the U.S. stock market.
Bloomberg Barclays U.S. Aggregate Bond Index is a broad-based benchmark that measures the investment-grade, U.S. dollar-denominated, fixed-rate taxable bond market of SEC-registered securities. The index includes bonds from the Treasury, Government Related, Corporate, MBS (agency fixed-rate and hybrid ARM pass-throughs), ABS, and CMBS sectors.
The principal risks of investing in the Calamos Hedged Equity Income Fund include: covered call writing risk, options risk, equity securities risk, correlation risk, mid-sized company risk, interest rate risk, credit risk, liquidity risk, portfolio turnover risk, portfolio selection risk, foreign securities risk, American depository receipts, and REITs risks.
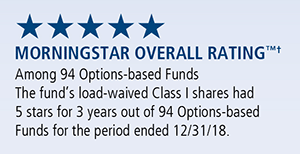
Calamos Hedged Equity Income Fund’s load-waived Class I shares received 5 stars for 3 years out of 94 Options-based funds for the period ended 12/31/18.
†Morningstar ratings shown are for Class I shares and do not include any front-end sales load. Not all investors have access to or may invest in the share class shown. Other share classes with front-end or back-end sales charges may have different ratings than the ratings shown.
Morningstar Ratings™ are based on risk-adjusted returns and are through 12/31/18 for Class I shares and will differ for other share classes. Morningstar ratings are based on a risk adjusted return measure that accounts for variation in a fund’s monthly historical performance (reflecting sales charges), placing more emphasis on downward variations and rewarding consistent performance. Within each asset class, the top 10%, the next 22.5%, 35%, 22.5%, and the bottom 10% receive 5, 4, 3, 2 or 1 star, respectively. Each fund is rated exclusively against U.S. domiciled funds. The information contained herein is proprietary to Morningstar and/or its content providers; may not be copied or distributed; and is not warranted to be accurate, complete or timely. Neither Morningstar nor its content providers are responsible for any damages or losses arising from any use of this information. Source: ©2019 Morningstar, Inc.
801431 1/19
Archived material may contain dated performance, risk and other information. Current performance may be lower or higher than the performance quoted in the archived material. For the most recent month-end performance information, please CLICK HERE. Archived material may contain dated opinions and estimates based on our judgment and are subject to change without notice, as are statements of financial market trends, which are based on current market conditions at the time of publishing. We believed the information provided here was reliable, but do not warrant its accuracy or completeness. This material is not intended as an offer or solicitation for the purchase or sale of any financial instrument. The views and strategies described may not be suitable for all investors. This material has been prepared for informational purposes only, and is not intended to provide, and should not be relied on for, accounting, legal or tax advice. References to future returns are not promises or even estimates of actual returns a client portfolio may achieve. Any forecasts contained herein are for illustrative purposes only and are not to be relied upon as advice or interpreted as a recommendation.
Performance data quoted represents past performance, which is no guarantee of future results. Current performance may be lower or higher than the performance quoted. The principal value and return of an investment will fluctuate so that your shares, when redeemed, may be worth more or less than their original cost. Performance reflected at NAV does not include the Fund’s maximum front-end sales load. Had it been included, the Fund’s return would have been lower. For the most recent month-end fund performance information visit www.calamos.com.
Archived material may contain dated performance, risk and other information. Current performance may be lower or higher than the performance quoted in the archived material. For the most recent month-end fund performance information visit www.calamos.com. Archived material may contain dated opinions and estimates based on our judgment and are subject to change without notice, as are statements of financial market trends, which are based on current market conditions at the time of publishing. We believed the information provided here was reliable, but do not warrant its accuracy or completeness. This material is not intended as an offer or solicitation for the purchase or sale of any financial instrument. The views and strategies described may not be suitable for all investors. This material has been prepared for informational purposes only, and is not intended to provide, and should not be relied on for, accounting, legal or tax advice. References to future returns are not promises or even estimates of actual returns a client portfolio may achieve. Any forecasts contained herein are for illustrative purposes only and are not to be relied upon as advice or interpreted as a recommendation.
Performance data quoted represents past performance, which is no guarantee of future results. Current performance may be lower or higher than the performance quoted. The principal value and return of an investment will fluctuate so that your shares, when redeemed, may be worth more or less than their original cost. Performance reflected at NAV does not include the Fund’s maximum front-end sales load. Had it been included, the Fund’s return would have been lower.
Archived on January 23, 2020