Here’s How CIHEX Collars Equity Market Volatility

As of March 1, Calamos Hedged Equity Income Fund’s name has been changed to Calamos Hedged Equity Fund.
download ticker article

Options trading by a liquid alternative fund? No one is born understanding how it works.

Fortunately for those who understand the basic premise of using options to hedge equities, Eli Pars, Co-CIO, Head of Alternative Strategies & Co-Head of Convertible Strategies and Senior Co-Portfolio Manager of Calamos Hedged Equity Income Fund (CIHEX), can explain exactly what his team does—and why it has worked.

CIHEX’s objective is to use covered call writing to achieve the total return of equity markets with lower volatility, and its first quarter 2018 performance more than delivered. Pars was profiled last week by ticker magazine, and the interview includes an extended explanation of the hedge that’s been in place since last summer.

For the full interview, please download the full reprint.

The Baseline Trade

When constructing the long equity portfolio, the team adds constraints on managing industry, sector and factor exposures of S&P 500 holdings.

On the option side, Pars explains, “We start with the baseline trade which is selling 80% notional of the portfolio with calls and at least 40% notional put protection. Overall, we try to make that hedge better and we look for opportunities every day.”

Current Hedge Started 6 Months Ago

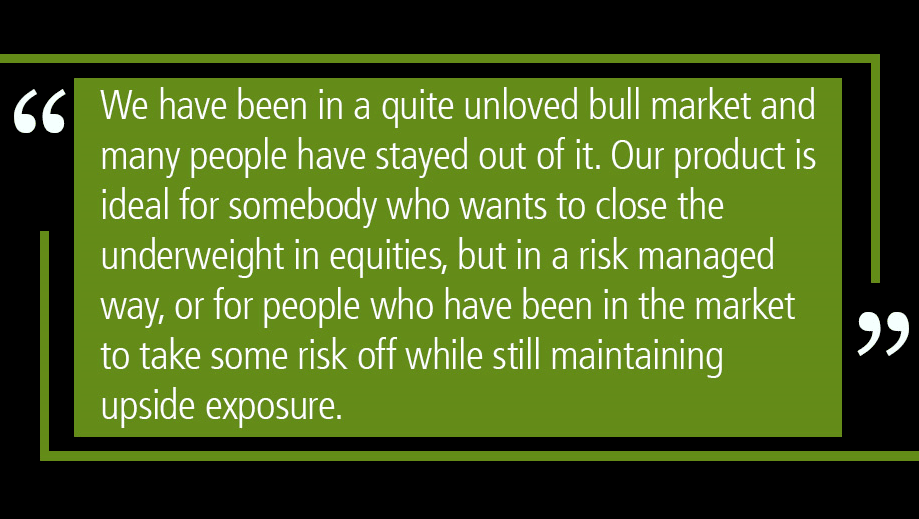
During last summer’s volatility, the team “decided that we weren’t getting paid enough to sell call options out of the money. But on the put side, we were getting paid a lot more from a volatility perspective for more out of the money puts.”

They layered in put spreads on top of CIHEX’s typical 40% notional put protection.
quote 1 Ticker

“For example,” Pars explains, “when we were buying an S&P 500 strike put and selling the same quantity and expiry, our potential profit is the 200 points in the S&P between the upper and lower strike. That’s a way to generate more at the money protection.

“On the call side, because we weren’t getting paid a lot for selling 5% out of the money calls, we sold more at the money calls and then bought some 1 to 2 months and 3% or 4% out-of-the-money calls. So, instead of just selling calls, we were selling call spreads.”

The difference? “We get a little less income but because the cost of it was relatively low, we got much better upside participation.”

Pars continues, “In a covered call strategy with puts like ours, as the market goes up, our delta or the size of our hedge goes up, but our beta to the S&P goes down. If the market goes down, our protection from the calls goes away and comes closer to the number of notional puts we have, or about 40%.”

“With the additional put spreads to the downside and because we are using call spreads instead of calls to the upside, the risk/reward profile is a lot more attractive,” Pars says. “As the market goes up, our sensitivity to the market goes up, but the hedge goes down. As the market goes down, our sensitivity goes down and the hedge goes up.”

Why the Strategy Outperformed the Market

Ordinarily, this trade can be expensive but with the team’s active approach and opportunistic philosophy, they were able to achieve it last year for a reasonable price. The trade performed well last year but was constrained because of the market’s limited volatility. At the start of 2018, with the return of upside volatility in the first few weeks, the calls that CIHEX were long started to capture delta.
quote 2 Ticker

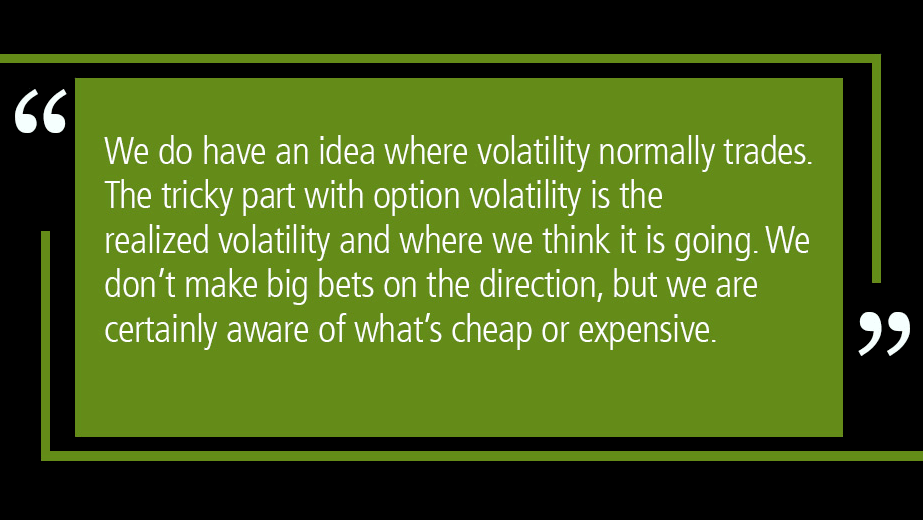
“Our sensitivity to the market went down and we were making a lot of money on these long calls,” Pars says. “Every time the market moved up, we would pocket some of the cash and use it to either roll up the strike of our puts or buy additional puts or put spreads.”

By the end of January, the team had captured a relatively large share of the upside move in the market.

And then the market reversed and CIHEX’s hedge “became quite high, our beta to the market became quite low, and we were able to protect a lot of the downside.”

The fund’s first quarter return was 3.5% versus the S&P 500’s -0.76%.

“You wouldn’t normally expect a hedged strategy like ours to outperform the equity market in an upward case,” acknowledges Pars. “It happened because we captured a big piece of the upside in January and didn’t capture a lot of downside.

CIHEX is not a market timing strategy, he stresses. “It is all about how we construct and trade the hedge. We were somewhat forced to sell as the market went up, and that allowed us to deliver that performance.”

2 More Examples

How about two more examples, from the same interview, that suggest the repeatability of the process?

June 2016: The team had no opinion on Brexit, but saw a potential major market moving event and the volatility was relatively cheap.

“We did some incremental hedging both to the upside and the downside and we traded around that event", Pars says. “It worked really well.” (Financial advisors, ask your Calamos Investment Consultant for additional detail.)

Third Quarter 2015 market sell-off related to the Chinese currency: Pars remembers: “At that time, our trade was very similar to the baseline trade. We had some put spreads on top of it, but we didn’t have any long calls. Going into that period, the index was about 2100 and we sold calls that were 2100 and 2150 and 2200 strike.

“Over several days, the market sold off several hundred points, so the calls we had sold for $20 became $3. Typically, we would try to buy back a good part of those calls if we’ve captured more than 75% of the value. In that case, we captured 90% of the value.”

Advisors, for information about where CIHEX fits in your clients’ portfolios, please talk to your Calamos Investment Consultant at 888-571-2567 or email caminfo@calamos.com.

Calamos ranks sixth on the list of alternative fund managers by assets under management in the Morningstar Alternatives Category as of 3/31/18.



Before investing carefully consider the fund’s investment objectives, risks, charges and expenses. Please see the prospectus and summary prospectus containing this and other information which can be obtained by calling 1-866-363-9219. Read it carefully before investing.

Opinions and estimates offered constitute our judgment and are subject to change without notice, as are statements of financial market trends, which are based on current market conditions. We believe the information provided here is reliable, but do not warrant its accuracy or completeness. This material is not intended as an offer or solicitation for the purchase or sale of any financial instrument. The views and strategies described may not be suitable for all investors. Opinions are subject to change due to changes in the market, economic conditions or changes in the legal and/or regulatory environment and may not necessarily come to pass. This information is provided for informational purposes only and should not be considered tax, legal, or investment advice. References to specific securities, asset classes and financial markets are for illustrative purposes only and are not intended to be, and should not be interpreted as, recommendations.

Alternative investments are not suitable for all investors.

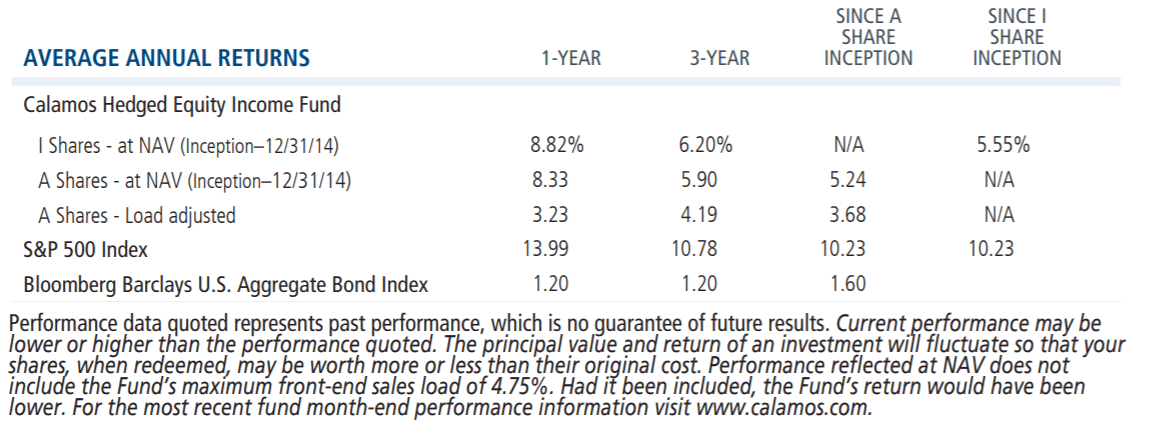
As of 3/31/18hei average annual returns 3-31-18

S&P 500 Index is generally considered representative of the U.S. stock market.

The principal risks of investing in the Calamos Hedged Equity Income Fund include: covered call writing risk, options risk, equity securities risk, correlation risk, mid-sized company risk, interest rate risk, credit risk, liquidity risk, portfolio turnover risk, portfolio selection risk, foreign securities risk, American depository receipts, and REITs risks.

Beta. A measure of the volatility, or systematic risk, of a security or a portfolio, in comparison to the market as a whole. Think of beta as the tendency of a security's returns to respond to swings in the market. A beta of 1 indicates that the security's price will move with the market. A beta of less than 1 means that the security will be less volatile than the market. A beta of greater than 1 indicates that the security's price will be more volatile than the market.

Options Risk: The Fund’s ability to close out its position as a purchaser or seller of an over-the-counter or exchange-listed put or call option is dependent, in part, upon the liquidity of the option market. There are significant differences between the securities and options markets that could result in an imperfect correlation among these markets, causing a given transaction not to achieve its objectives. The Fund’s ability to utilize options successfully will depend on the ability of the Fund’s investment adviser to predict pertinent market movements, which cannot be assured.

Delta is a measure of a convertible security’s sensitivity to its underlying equity, with higher deltas indicating greater sensitivity.

Covered Call Writing involves selling (or “writing”) a call option against an equity the writer holds. When managers sell a call option, they earn a premium from the option sale. If the shares trade below the strike price, the option will expire worthless and they keep the premium from the option and retain the security. If the share price exceeds the strike price, the buyer will likely exercise the option and the seller must sell the shares at the strike price. To hedge additional risk, managers could also purchase put options to protect against significant equity market declines.

In the money. A call option's strike price is below the market price of the underlying asset or that the strike price of a put option is above the market price of the underlying asset. Being in the money does not mean you will profit, it just means the option is worth exercising. This is because the option costs money to buy.

Options Trading. A hypothetical stock is trading at $100. Call options with strike prices above $100 would be out of the money calls, while put options with strike prices below $100 would be out of the money puts. Out of the money options are typically less expensive than in the money options (call options with strike prices below $100 and put options with strike prices above $100) or at the money options (when an option’s strike price is the same price as the underlying security) and can provide the most upside opportunity if the manager’s position proves accurate.

Out of the money (OTM). A term used to describe a call option with a strike price that is higher than the market price of the underlying asset, or a put option with a strike price that is lower than the market price of the underlying asset. An out of the money option has no intrinsic value, but only possesses extrinsic or time value.

Notional value. The total value of a leveraged position's assets. This term is commonly used in the options, futures and currency markets which employ the use of leverage, wherein a small amount of invested money can control a large position in the markets.

Call and Put Spreads. Options strategies when a manager buys a call/put option, while simultaneously selling a less expensive call or put/option. Because the call/put options share similar characteristics, this trade is typically less costly than an outright purchase, but still provides similar protection.

801120 518

Archived material may contain dated performance, risk and other information. Current performance may be lower or higher than the performance quoted in the archived material. For the most recent month-end performance information, please CLICK HERE. Archived material may contain dated opinions and estimates based on our judgment and are subject to change without notice, as are statements of financial market trends, which are based on current market conditions at the time of publishing. We believed the information provided here was reliable, but do not warrant its accuracy or completeness. This material is not intended as an offer or solicitation for the purchase or sale of any financial instrument. The views and strategies described may not be suitable for all investors. This material has been prepared for informational purposes only, and is not intended to provide, and should not be relied on for, accounting, legal or tax advice. References to future returns are not promises or even estimates of actual returns a client portfolio may achieve. Any forecasts contained herein are for illustrative purposes only and are not to be relied upon as advice or interpreted as a recommendation.

Performance data quoted represents past performance, which is no guarantee of future results. Current performance may be lower or higher than the performance quoted. The principal value and return of an investment will fluctuate so that your shares, when redeemed, may be worth more or less than their original cost. Performance reflected at NAV does not include the Fund’s maximum front-end sales load. Had it been included, the Fund’s return would have been lower. For the most recent month-end fund performance information visit www.calamos.com.

Archived material may contain dated performance, risk and other information. Current performance may be lower or higher than the performance quoted in the archived material. For the most recent month-end fund performance information visit www.calamos.com. Archived material may contain dated opinions and estimates based on our judgment and are subject to change without notice, as are statements of financial market trends, which are based on current market conditions at the time of publishing. We believed the information provided here was reliable, but do not warrant its accuracy or completeness. This material is not intended as an offer or solicitation for the purchase or sale of any financial instrument. The views and strategies described may not be suitable for all investors. This material has been prepared for informational purposes only, and is not intended to provide, and should not be relied on for, accounting, legal or tax advice. References to future returns are not promises or even estimates of actual returns a client portfolio may achieve. Any forecasts contained herein are for illustrative purposes only and are not to be relied upon as advice or interpreted as a recommendation.

Performance data quoted represents past performance, which is no guarantee of future results. Current performance may be lower or higher than the performance quoted. The principal value and return of an investment will fluctuate so that your shares, when redeemed, may be worth more or less than their original cost. Performance reflected at NAV does not include the Fund’s maximum front-end sales load. Had it been included, the Fund’s return would have been lower.

Archived on May 03, 2019