When 60/40 Disappoints, Change the Combination—Try the Half Caff
July 26, 2022
Investment professionals have been using the Half Caff, a combination of our fixed income alt Calamos Market Neutral Income Fund (CMNIX) and equity alt Calamos Phineus Long/Short Fund (CPLIX), for the last five years (see original post), across varied market periods. It’s a blend whose name is inspired by coffee drinkers who like the jolt that caffeine provides but want to dial back on the accompanying jumpiness.
We return to the Half Caff today, seven months into one of the worst years to be an investor in recent history. Volatility has been extreme, stocks and bonds have increasingly moved in sync with one another—and both in a negative direction. Even in this especially challenging environment, the Half Caff has brought something different to the mix, as you’ll read below.
July 26, 2022
Jack McAndrew
Product Manager, Product Management & Analytics
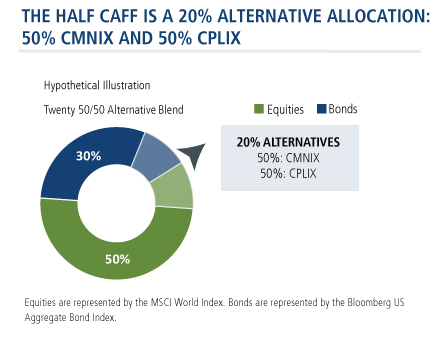
- We take 10% from a traditional portfolio with 40% allocated to bonds (using the Bloomberg US Aggregate Bond Index as proxy).
- We take 10% from a traditional portfolio with 60% allocated to equities (using the MSCI World Index as proxy).
- From that 20%, we allocate half to CMNIX as the fixed income alternative and half to CPLIX as the equity alternative.
Portfolios continue to be challenged by market volatility and a drawdown that has persisted throughout most of 2022. Unlike the very sharp and sudden COVID-related drawdown from February 20 to March 23, 2020, this decline has been extended. By July 2020, the market’s snapback was well on its way to rewarding investors for remaining in the market. Today’s environment, it appears, will continue to test investors’ resolve.
Historically, the way to mitigate equity drawdowns has been to use a 60% equity/40% bond portfolio. The rationale: The equity portion provided high return potential while the fixed income portion could act a ballast to equity positions.
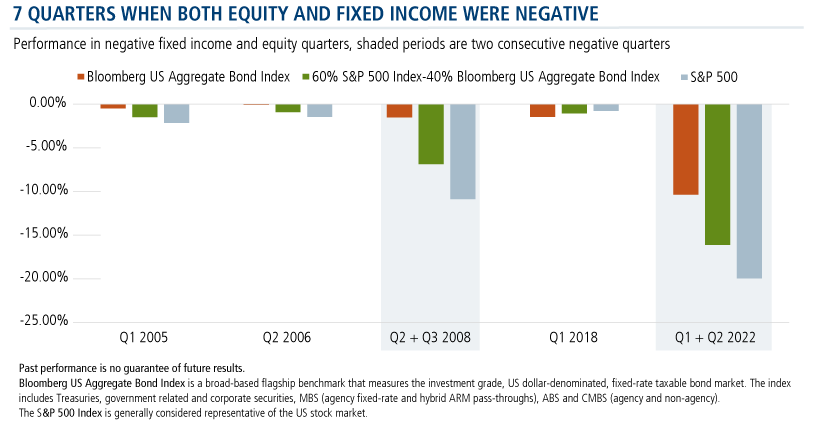
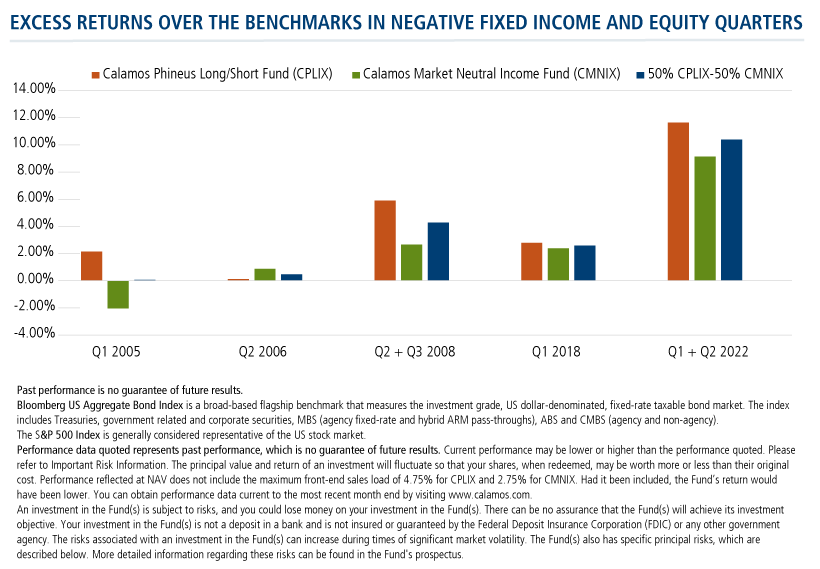
But fixed income doesn’t always perform as expected. Over the last 20 years (80 quarters), there have been seven quarters when both equity and fixed income have posted negative returns. It’s happened in Q1 2005, Q2 2006, Q2 & Q3 2008, Q1 2018, and now Q1 & Q2 2022.
And, the last time that two subsequent quarters of negative equity and negative fixed income returns occurred was during the 2008 financial crisis. Fourteen years later we have, unfortunately, experienced this phenomenon for a second time, to start the 2022 calendar year.
Is this a phenomenon that happens once every couple of decades or is it a scenario that we can expect to recur as the landscape evolves?
Consider that bonds have enjoyed a 40-year bull market, with the 10-year yield peaking over 15% in the 1980s and providing fixed income investors a ride down to almost 0.5% on the 10-year in late 2020. Since then, yields have climbed back up to over 3%, dealing the pain to bond investors along with the downward trend in equities.
Excess Returns When They’re Most Needed
This is an environment that requires new ideas. With much lower rates this decade, additional Fed rate hikes on the horizon, and more economic uncertainty provoked by persistent high inflation, there is the possibility that stocks and bonds will disappoint in tandem in the future.
The table below shows why we recommend diversifying with the Half Caff. It would have helped mitigate the downside risk during periods of concurrent negative equity and fixed income.
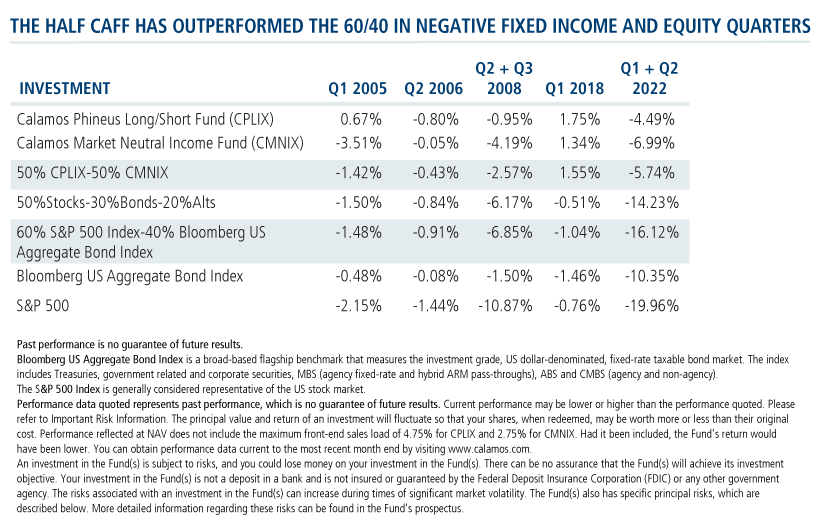
The blend of 50% CPLIX-50% CMNIX outperformed the 60/40 blended benchmark in each of these five periods, even posting a positive return in one quarter. And those time periods when there were two consecutive quarters of negative equity and fixed income? That’s when the outperformance would have been even more compelling: 428 basis points of excess return in Q2+Q3 2008 and 1038 basis points of excess return in Q1+Q2 2022.
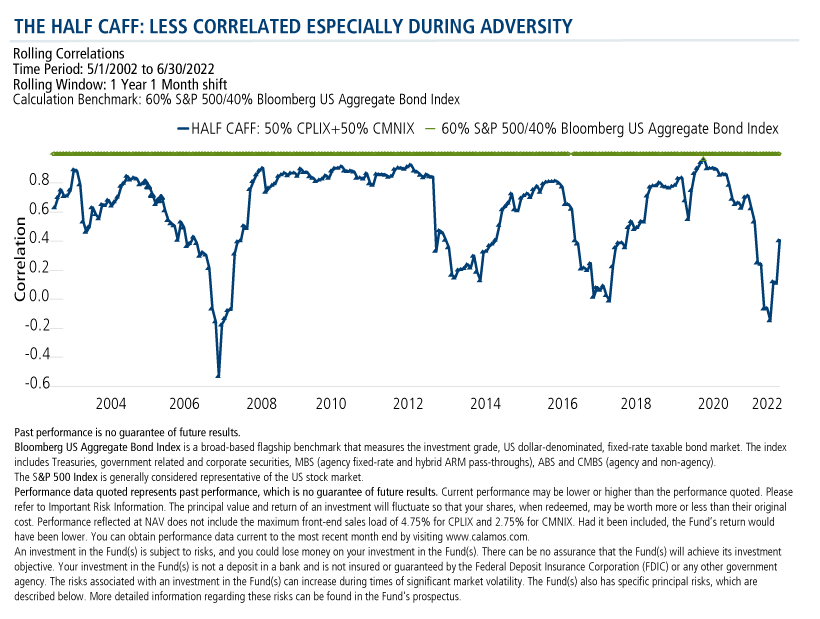
During some of the most volatile periods of the last two decades, the correlation between the Bloomberg US Aggregate Bond Index and the S&P 500 has become more aligned, as both moved negative in the same direction during the same periods of time.
Now more than ever, it’s imperative to find alternatives that diversify the risks from a traditional 60% equity/40% bond portfolio, in the event the that these asset classes become more correlated in this still-low rate environment. Note how the Half Caff could have provided less correlated returns to the traditional 60/40 portfolio during these adverse events (2008 and now 2022).
Investment professionals, what more would you like to hear about the Half Caff? Your Investment Consultant is happy to help. Contact him or her at 888-571-2567 or email caminfo@calamos.com
Before investing, carefully consider the fund’s investment objectives, risks, charges and expenses. Please see the prospectus and summary prospectus containing this and other information which can be obtained by calling 1-866-363-9219. Read it carefully before investing.
Opinions and estimates offered constitute our judgment and are subject to change without notice, as are statements of financial market trends, which are based on current market conditions. We believe the information provided here is reliable, but do not warrant its accuracy or completeness. This material is not intended as an offer or solicitation for the purchase or sale of any financial instrument. The views and strategies described may not be suitable for all investors. Opinions are subject to change due to changes in the market, economic conditions or changes in the legal and/or regulatory environment and may not necessarily come to pass. This information is provided for informational purposes only and should not be considered tax, legal, or investment advice. References to specific securities, asset classes and financial markets are for illustrative purposes only and are not intended to be, and should not be interpreted as, recommendations.
The principal risks of investing in the Calamos Market Neutral Income Fund include: equity securities risk consisting of market prices declining in general, convertible securities risk consisting of the potential for a decline in value during periods of rising interest rates and the risk of the borrower to miss payments, synthetic convertible instruments risk, convertible hedging risk, covered call writing risk, options risk, short sale risk, interest rate risk, credit risk, high yield risk, liquidity risk, portfolio selection risk, and portfolio turnover risk.
The principal risks of investing in the Calamos Phineus Long/Short Fund include: equity securities risk consisting of market prices declining in general, short sale risk consisting of potential for unlimited losses, foreign securities risk, currency risk, geographic concentration risk, other investment companies (including ETFs) risk, derivatives risk, options risk, and leverage risk. As a result of political or economic instability in foreign countries, there can be special risks associated with investing in foreign securities, including fluctuations in currency exchange rates, increased price volatility and difficulty obtaining information. In addition, emerging markets may present additional risk due to potential for greater economic and political instability in less developed countries.
Bloomberg US Aggregate Bond Index is a broad-based flagship benchmark that measures the investment grade, US dollar-denominated, fixed-rate taxable bond market. The index includes Treasuries, government related and corporate securities, MBS (agency fixed-rate and hybrid ARM pass-throughs), ABS and CMBS (agency and non-agency).
S&P 500 Index is generally considered representative of the US stock market.
Excess Returns are returns in excess of the benchmark. Actual returns for the period may be positive or negative.
810207 722
Archived material may contain dated performance, risk and other information. Current performance may be lower or higher than the performance quoted in the archived material. For the most recent month-end fund performance information visit www.calamos.com. Archived material may contain dated opinions and estimates based on our judgment and are subject to change without notice, as are statements of financial market trends, which are based on current market conditions at the time of publishing. We believed the information provided here was reliable, but do not warrant its accuracy or completeness. This material is not intended as an offer or solicitation for the purchase or sale of any financial instrument. The views and strategies described may not be suitable for all investors. This material has been prepared for informational purposes only, and is not intended to provide, and should not be relied on for, accounting, legal or tax advice. References to future returns are not promises or even estimates of actual returns a client portfolio may achieve. Any forecasts contained herein are for illustrative purposes only and are not to be relied upon as advice or interpreted as a recommendation.
Performance data quoted represents past performance, which is no guarantee of future results. Current performance may be lower or higher than the performance quoted. The principal value and return of an investment will fluctuate so that your shares, when redeemed, may be worth more or less than their original cost. Performance reflected at NAV does not include the Fund’s maximum front-end sales load. Had it been included, the Fund’s return would have been lower.
Archived on July 26, 2023