Small Caps: You Don’t Have to Choose Between Growth Or Value
Elise Pondel, CFA, AVP, Product Management & Analytics
December 16, 2021
Small caps have been in the spotlight recently with favorable valuations, strong performance, and favorable outlook relative to large caps. Investment professionals are often underallocated to small cap stocks in their portfolios or use a single manager to gain exposure to the space. Below we propose how you’d incorporate Calamos Timpani Small Cap Growth Fund (CTSIX) in a small cap allocation with the intent of building a stronger, all-weather portfolio.
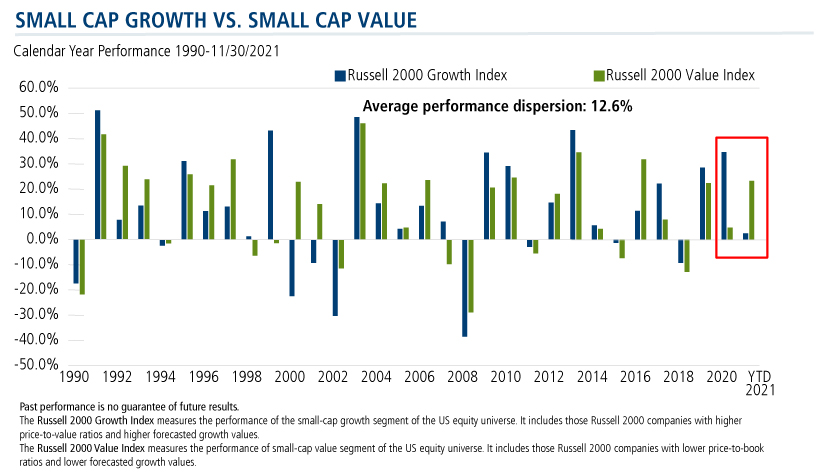
Since 1990, the average calendar year performance dispersion between small cap growth stocks and small cap value stocks is 12.6%. The range in performance the last two years has been higher than average, with small growth outperforming small value by 30% in 2020 and underperforming small value by 20.86% YTD through 11/30/21.
Year-to-date flows into the Morningstar Small Growth and Small Value categories reflect this performance dispersion with the Small Growth category experiencing outflows and the Small Value category experiencing inflows.
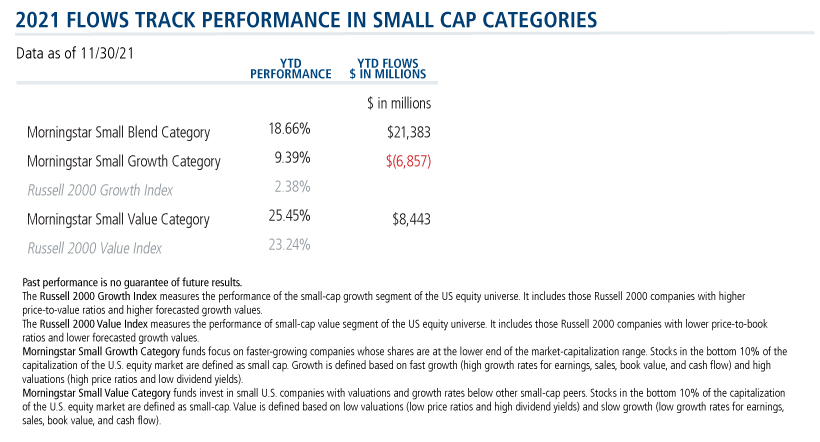
In other words, investors are chasing returns in the top-performing flows categories. Instead, how about considering a blend of funds, each of which tends to earn its excess returns during different market periods?
CTSIX’s high conviction active approach to growth investing has led to significant upside capture and strong alpha generation. Its consistent strong small growth bias makes it a complementary pair with a small value fund (active or passive).
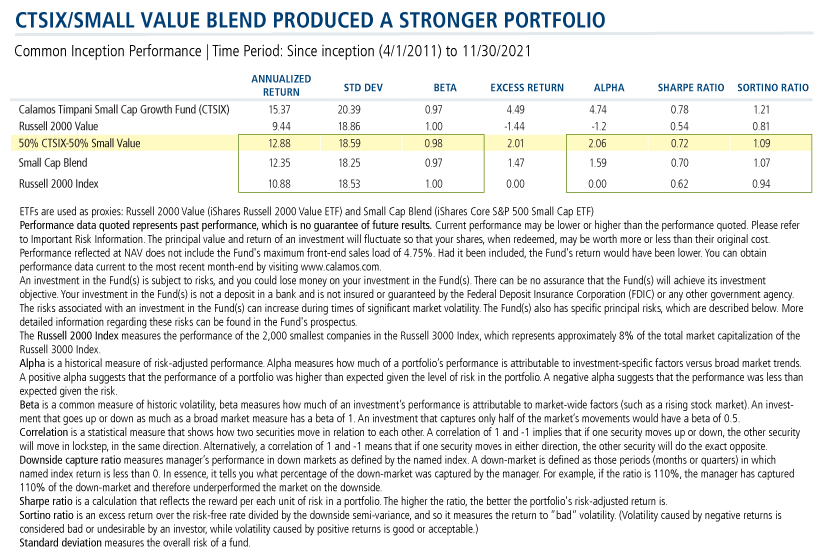
In the example below, we illustrate how blending CTSIX with small value (using the largest small value ETF as a proxy) could have achieved stronger total returns, alpha generation, and greater risk-adjusted returns relative to a small cap blend (using the largest small blend ETF as a proxy) over the common inception period.
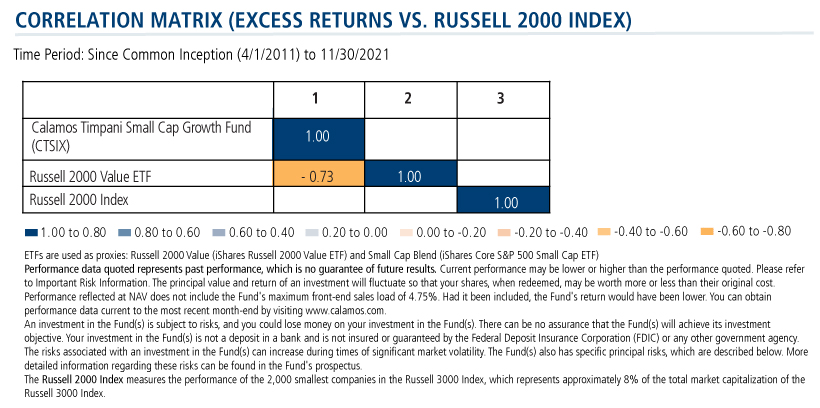
The excess returns correlation matrix highlights the strong negative relationship of these funds’ excess returns. These two funds tend to earn their excess returns relative to the Russell 2000 Index during different market periods. This helps to smooth out the return stream in years with significant performance dispersion.
The result is a stronger overall portfolio relative to the leading passive small blend product and the small blend index. Over the analysis period, the recommended portfolio provided stronger total returns for similar risk levels (standard deviation and beta), improved alpha, and superior risk-adjusted returns.
Small caps can be volatile, and uneven performance can deter usage overall. A small cap allocation with equal exposure to growth and value can help keep clients invested, with the potential to benefit from the strong gains that small caps uniquely provide.
Investment professionals, for more about CTSIX or from our Product Management & Analytics team, please reach out to your Calamos Investment Consultant at 888-571-2567 or caminfo@calamos.com.
Before investing, carefully consider the fund’s investment objectives, risks, charges and expenses. Please see the prospectus and summary prospectus containing this and other information which can be obtained by calling 1-866-363-9219. Read it carefully before investing.
Opinions and estimates offered constitute our judgment and are subject to change without notice, as are statements of financial market trends, which are based on current market conditions. We believe information provided here is reliable, but do not warrant its accuracy or completeness. The material is not intended as an offer or solicitation for the purchase of any financial instrument. The views and strategies described may not be suitable for all investors. This material has been prepared for informational purposes only and is not intended to provide—and should not be relied on for—accounting, legal or tax advice. References to future returns are not promises or even estimates of actual returns a client may achieve. Any forecasts contained herein are for illustrative purposes only and are not to be relied upon as advice or interpreted as a recommendation. The securities highlighted are discussed for illustrative purposes only. They are not recommendations.
Important Risk Information. An investment in the Fund(s) is subject to risks, and you could lose money on your investment in the Fund(s). There can be no assurance that the Fund(s) will achieve its investment objective. Your investment in the Fund(s) is not a deposit in a bank and is not insured or guaranteed by the Federal Deposit Insurance Corporation (FDIC) or any other government agency. The risks associated with an investment in the Fund(s) can increase during times of significant market volatility. The Fund(s) also has specific principal risks, which are described below. More detailed information regarding these risks can be found in the Fund's prospectus.
The principal risks of investing in the Calamos Timpani Small Cap Growth Fund include: equity securities risk consisting of market prices declining in general, growth stock risk consisting of potential increased volatility due to securities trading at higher multiples, and portfolio selection risk. The Fund invests in small capitalization companies, which are often more volatile and less liquid than investments in larger companies. As a result of political or economic instability in foreign countries, there can be special risks associated with investing in foreign securities, including fluctuations in currency exchange rates, increased price volatility and difficulty obtaining information. In addition, emerging markets may present additional risk due to potential for greater economic and political instability in less developed countries.
The Russell 2000 Indexmeasures the performance of the 2,000 smallest companies in the Russell 3000 Index, which represents approximately 8% of the total market capitalization of the Russell 3000 Index.
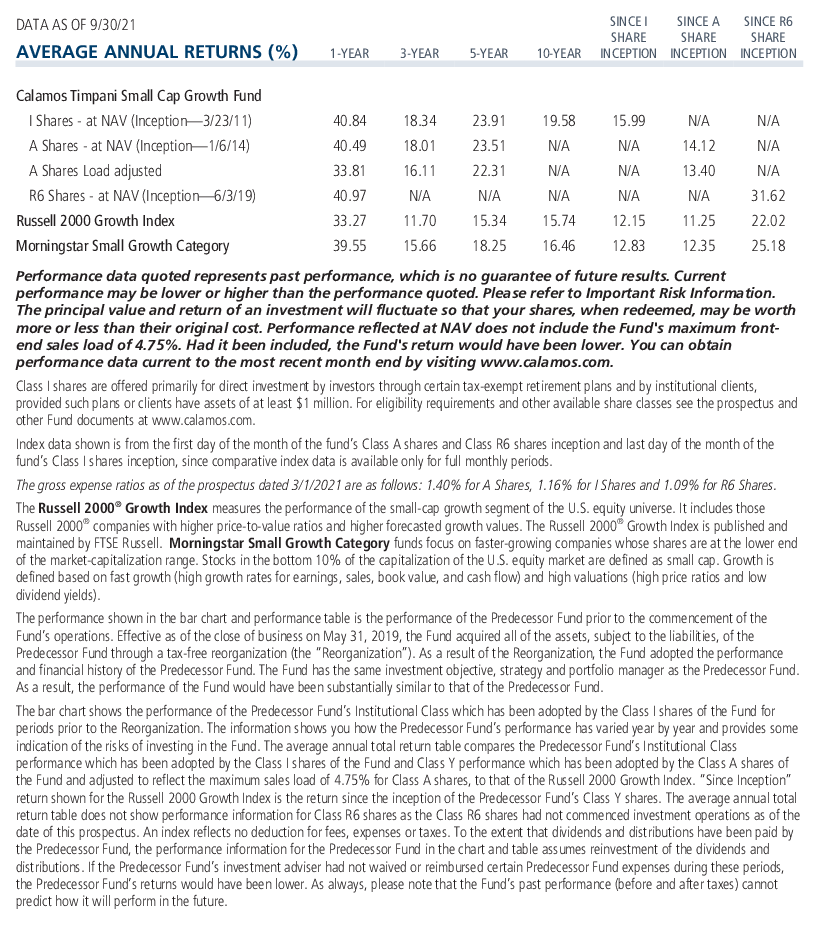
The Russell 2000 Growth Index measures the performance of the small-cap growth segment of the US equity universe. It includes those Russell 2000 companies with higher price-to-value ratios and higher forecasted growth values.
The Russell 2000 Value Index measures the performance of small-cap value segment of the US equity universe. It includes those Russell 2000 companies with lower price-to-book ratios and lower forecasted growth values.
Morningstar Small Growth Category funds focus on faster-growing companies whose shares are at the lower end of the market-capitalization range. Stocks in the bottom 10% of the capitalization of the US equity market are defined as small cap. Growth is defined based on fast growth (high growth rates for earnings, sales, book value, and cash flow) and high valuations (high price ratios and low dividend yields).
Morningstar Small Value Category funds invest in small US companies with valuations and growth rates below other small-cap peers. Stocks in the bottom 10% of the capitalization of the US equity market are defined as small-cap. Value is defined based on low valuations (low price ratios and high dividend yields) and slow growth (low growth rates for earnings, sales, book value, and cash flow).
Morningstar Small Blend Category funds favor US firms at the smaller end of the market-capitalization range. Some aim to own an array of value and growth stocks while others employ a discipline that leads to holdings with valuations and growth rates close to the small-cap averages. Stocks in the bottom 10% of the capitalization of the US equity market are defined as small-cap. The blend style is assigned to portfolios where neither growth nor value characteristics predominate.
The performance shown in this post is hypothetical in nature and does not represent the performance and/or investment risk characteristics of any specific client. While the performance listed for each respective Investment Professional is based on actual performance, the aggregate portfolio performance, allocations listed and account comparisons shown are hypothetical in nature, as no actual clients are invested in these blended strategies. Hypothetical performance results have many inherent limitations, including those described below:
- Hypothetical performance results are generally prepared with the benefit of hindsight.
- There are limitations inherent in model results, such results do not represent actual trading and that they may not reflect the impact that material economic and market factors might have had on the advisor's decision making if the advisor were actually managing clients' money. In the hypothetical accounts shown actual 3rd party advisor performance has been blended in various allocations.
- The hypothetical performance shown does not involve financial risk, and no hypothetical performance calculation can completely account for the impact of financial risk on an actual investment strategy.
- The ability to withstand actual losses or to adhere to a particular investment strategy in spite of losses are material points which can adversely affect actual performance results.
There are distinct differences between hypothetical performance results and the actual results subsequently achieved by a particular investment portfolio. No representation is being made that an account will or is likely to achieve profits or losses similar to those shown, and any investment may result in loss of principal.
As with any hypothetical illustration there can be additional unforeseen factors that cannot be accounted for within the illustrations included herein.
Hypothetical performance and index returns presented assume reinvestment of any and all earnings/distributions.
808601 1221
Archived material may contain dated performance, risk and other information. Current performance may be lower or higher than the performance quoted in the archived material. For the most recent month-end fund performance information visit www.calamos.com. Archived material may contain dated opinions and estimates based on our judgment and are subject to change without notice, as are statements of financial market trends, which are based on current market conditions at the time of publishing. We believed the information provided here was reliable, but do not warrant its accuracy or completeness. This material is not intended as an offer or solicitation for the purchase or sale of any financial instrument. The views and strategies described may not be suitable for all investors. This material has been prepared for informational purposes only, and is not intended to provide, and should not be relied on for, accounting, legal or tax advice. References to future returns are not promises or even estimates of actual returns a client portfolio may achieve. Any forecasts contained herein are for illustrative purposes only and are not to be relied upon as advice or interpreted as a recommendation.
Performance data quoted represents past performance, which is no guarantee of future results. Current performance may be lower or higher than the performance quoted. The principal value and return of an investment will fluctuate so that your shares, when redeemed, may be worth more or less than their original cost. Performance reflected at NAV does not include the Fund’s maximum front-end sales load. Had it been included, the Fund’s return would have been lower.
Archived on December 16, 2022