Why CTSIX’s Nelson Is Upbeat: Sustainability, Low Valuation, and Potential M&A Upside
October 15, 2021
Small cap growth or small cap value? Certainly, Brandon Nelson will entertain the question, and he’ll even concede that small cap value overall could perform fairly well in the short term.
But that’s as much as you can expect from the Senior Portfolio Manager of Calamos Timpani Small Cap Growth Fund (CTSIX).
“Valuations are cheap for small cap value stocks, but the fundamentals are way murkier, and that’s the tradeoff,” Nelson said on a recent call with investment professionals. “You go cheap, close your eyes, and hope for the best.”
But Nelson admits to a deep bias. “I trust the growth rates in small growth much more than I would trust the growth rates in small value. I’ll always prefer exposure to companies that have better visibility. Just focusing on cheapness and valuation can get you into trouble. They look cheap for a reason.” It’s this firmly held position, he said, “that’s kept me out of trouble for most of my career.”
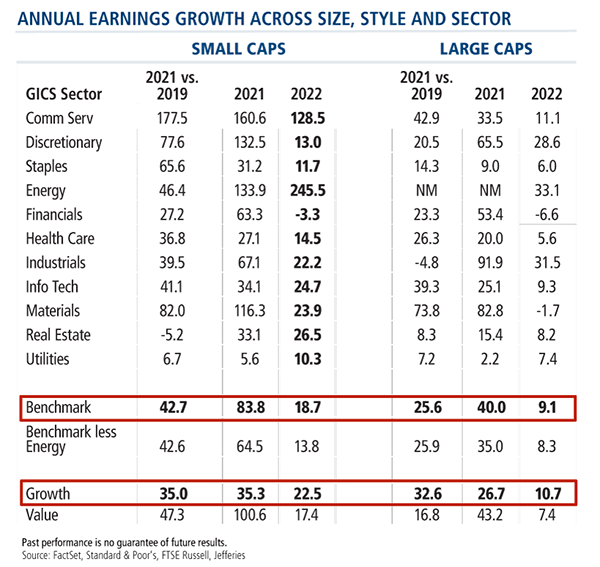
The question was raised as part of Nelson’s larger discussion on small companies’ accelerated pace of growth relative to large companies. As shown below, the earnings growth rates of companies of all sizes in 2021 are “huge” relative to 2020, with small caps showing the strongest improvements. That’s true, too, when 2021 is compared to 2019 pre-pandemic. But Nelson noted, small caps’ exceptional growth is forecasted to continue into 2022, with large caps' earnings growth falling back to earth.
That 100% earnings growth improvement you see for small value this year, he explained, is a function of the comparison to 2020, a year that was “a complete disaster” for many industries. “A lot of those companies were on the brink of complete failure. My questions would be about the sustainability of the growth beyond 2021. That’s a major, major question mark for value stocks.”
Nelson next presented a table that showed the subsequent performance of Russell 2000 stocks organized by price quintile. Small caps have been fluctuating between the first quintile and second quintiles, the cheapest buckets.
As you can see, subsequent performance for the cheapest quintiles typically represents a favorable entry point for small caps versus large caps, he said.
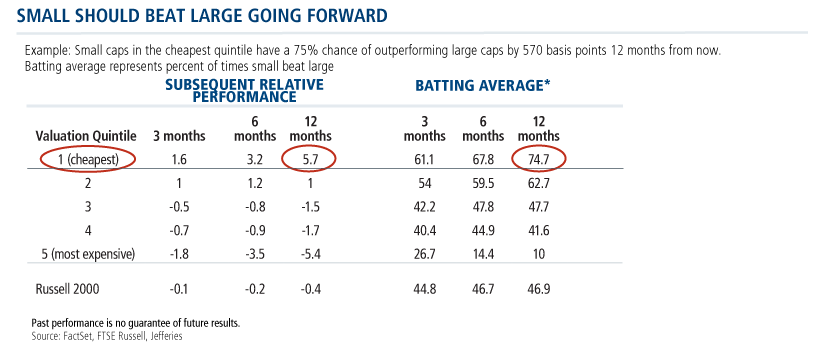
Small cap valuations were just barely in the second quintile in August. In the second quintile, Nelson said, “small caps tend to be at least 100 basis points better versus large caps with an above 50% batting average. It’s better than a coin flip chance that’s going to happen. In the first quintile, the cheapest, the numbers get even more impressive. Look at that 12-month performance small versus large, 5.7%—that’s almost 600 basis points. And the batting average on that is 75%. So, you have a 75% chance of outperforming by 600 basis points. I’ll take those odds any day,” Nelson said.
In fact, small caps began a relative rally starting mid-August, and after trailing for six months straight, they outperformed large caps in September by 164 basis points (Russell 2000 less Russell 1000).
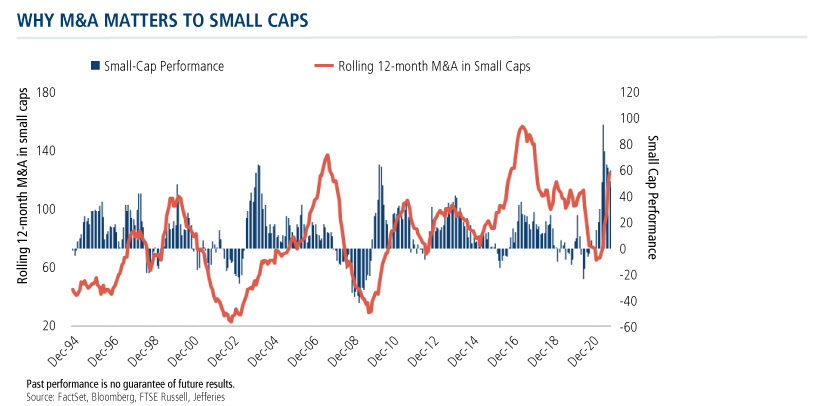
As a final point, Nelson touched on the record pace of small cap takeouts this year, which are expected to accelerate ahead of anticipated higher capital gains taxes. That’s good news for investors as acquirers often pay large premiums.
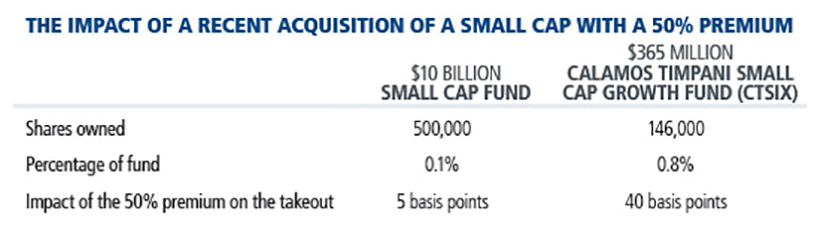
But here’s why a takeout can provide a meaningful boost to this fund: CTSIX can take stakes in smaller companies that larger funds can’t—and even when larger funds are holding an acquisition target, a takeout over a large asset base will likely have minimal impact.
Below are the details on a recent transaction, a company that was bought out for a 50% premium. The stock is held by both CTSIX and another small cap growth fund with a much higher asset base. Both funds benefited from the takeout, but the benefit to CTSIX was substantially more because the weight was higher. The higher weight in CTSIX was enabled by a smaller asset base.
To date this year, four CTSIX holdings have been acquired, making an additional contribution on their way out.
Nelson sees a lot to be positive about the fund long term. Its year-to-date return of 10.16% by far exceeded the Russell 2000 Growth Index (+2.82%) and outperformed the Morningstar Small Growth Category (+9.63%).
Over the near term, he offered two notes about the seasonality of small cap performance:
- Historically, small caps have tended to perform well in the last two (November and December) and first two (January and February) months of the year.
- When the Russell 2000 Index has been up over 10% during the first half of the year, it has tended to rise another 12% during the second half of the year. “If that holds true,” he said, “we could see a big small cap move (+13%?) in the next 10 weeks.”
Investment professionals, for more information please contact your Calamos Investment Consultant at 888-571-2567 or caminfo@calamos.com.
Before investing, carefully consider the fund’s investment objectives, risks, charges and expenses. Please see the prospectus and summary prospectus containing this and other information which can be obtained by calling 1-866-363-9219. Read it carefully before investing.
Opinions and estimates offered constitute our judgment and are subject to change without notice, as are statements of financial market trends, which are based on current market conditions. We believe information provided here is reliable, but do not warrant its accuracy or completeness. The material is not intended as an offer or solicitation for the purchase of any financial instrument. The views and strategies described may not be suitable for all investors. This material has been prepared for informational purposes only and is not intended to provide—and should not be relied on for—accounting, legal or tax advice. References to future returns are not promises or even estimates of actual returns a client may achieve. Any forecasts contained herein are for illustrative purposes only and are not to be relied upon as advice or interpreted as a recommendation. The securities highlighted are discussed for illustrative purposes only. They are not recommendations.
Important Risk Information. An investment in the Fund(s) is subject to risks, and you could lose money on your investment in the Fund(s). There can be no assurance that the Fund(s) will achieve its investment objective. Your investment in the Fund(s) is not a deposit in a bank and is not insured or guaranteed by the Federal Deposit Insurance Corporation (FDIC) or any other government agency. The risks associated with an investment in the Fund(s) can increase during times of significant market volatility. The Fund(s) also has specific principal risks, which are described below. More detailed information regarding these risks can be found in the Fund's prospectus.
The principal risks of investing in the Calamos Timpani Small Cap Growth Fund include: equity securities risk consisting of market prices declining in general, growth stock risk consisting of potential increased volatility due to securities trading at higher multiples, and portfolio selection risk. The Fund invests in small capitalization companies, which are often more volatile and less liquid than investments in larger companies. As a result of political or economic instability in foreign countries, there can be special risks associated with investing in foreign securities, including fluctuations in currency exchange rates, increased price volatility and difficulty obtaining information. In addition, emerging markets may present additional risk due to potential for greater economic and political instability in less developed countries.
The Russell 1000 Index measures the performance of the large cap segment of the U.S. equity universe and includes approximately 1000 of the largest securities based on a combination of their market cap and current index membership.
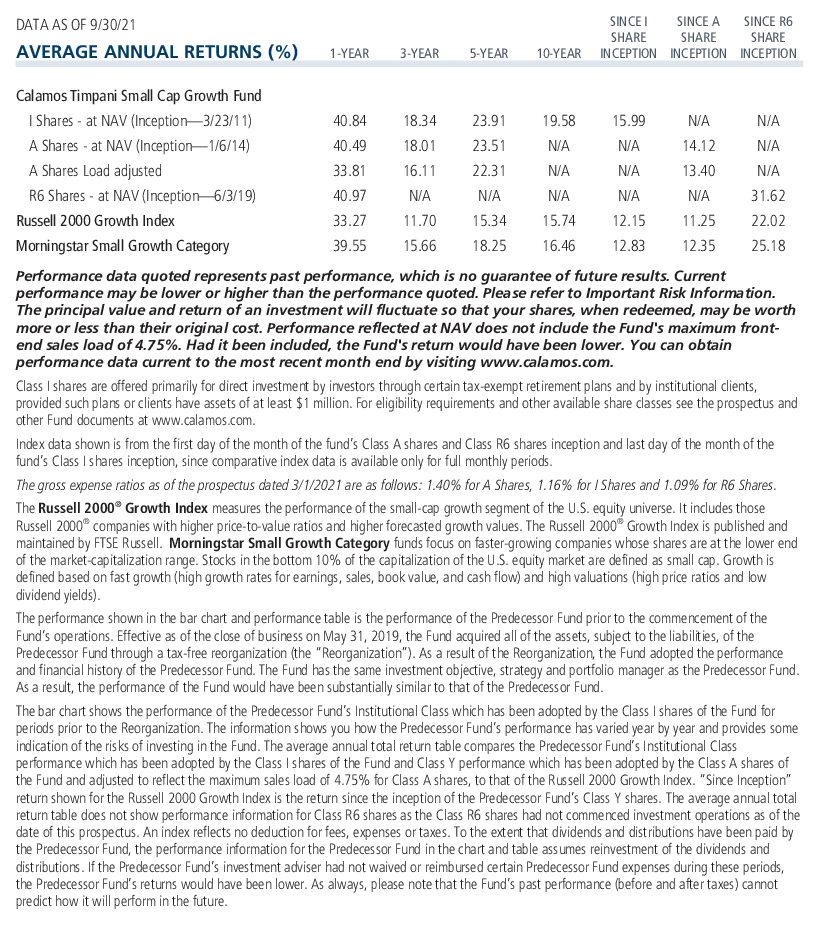
Morningstar Small Growth Category funds focus on faster-growing companies whose shares are at the lower end of the market-capitalization range. Stocks in the bottom 10% of the capitalization of the U.S. equity market are defined as small cap. Growth is defined based on fast growth (high growth rates for earnings, sales, book value, and cash flow) and high valuations (high price ratios and low dividend yields).
Morningstar RatingsTM are based on risk-adjusted returns and are through 9/30/21 for the share class listed and will differ for other share classes. Morningstar ratings are based on a risk-adjusted return measure that accounts for variation in a fund's monthly historical performance (reflecting sales charges), placing more emphasis on downward variations and rewarding consistent performance. Within each asset class, the top 10%, the next 22.5%, 35%, 22.5%, and the bottom 10% receive 5, 4, 3, 2 or 1 star, respectively. Each fund is rated exclusively against U.S. domiciled funds. The information contained herein is proprietary to Morningstar and/or its content providers; may not be copied or distributed; and is not warranted to be accurate, complete or timely. Neither Morningstar nor its content providers are responsible for any damages or losses arising from any use of this information. Source: ©2021 Morningstar, Inc.
808531 1021
Archived material may contain dated performance, risk and other information. Current performance may be lower or higher than the performance quoted in the archived material. For the most recent month-end fund performance information visit www.calamos.com. Archived material may contain dated opinions and estimates based on our judgment and are subject to change without notice, as are statements of financial market trends, which are based on current market conditions at the time of publishing. We believed the information provided here was reliable, but do not warrant its accuracy or completeness. This material is not intended as an offer or solicitation for the purchase or sale of any financial instrument. The views and strategies described may not be suitable for all investors. This material has been prepared for informational purposes only, and is not intended to provide, and should not be relied on for, accounting, legal or tax advice. References to future returns are not promises or even estimates of actual returns a client portfolio may achieve. Any forecasts contained herein are for illustrative purposes only and are not to be relied upon as advice or interpreted as a recommendation.
Performance data quoted represents past performance, which is no guarantee of future results. Current performance may be lower or higher than the performance quoted. The principal value and return of an investment will fluctuate so that your shares, when redeemed, may be worth more or less than their original cost. Performance reflected at NAV does not include the Fund’s maximum front-end sales load. Had it been included, the Fund’s return would have been lower.
Archived on October 15, 2022