Ready to Focus on Emerging Markets? Why CNWIX Merits a Close Look
November 9, 2020
Who’s ready to think about something else?
In medicine, there’s a condition called tunnel vision, which occurs when your field of vision narrows so much that you see only what's in front of you.
Calamos Evolving World Growth Fund (CNWIX)
Morningstar Overall RatingTM Among 718 Diversified Emerging Mkts funds. The Fund's risk-adjusted returns based on load-waived Class I Shares had 3 stars for 3 years, 5 stars for 5 years and 4 stars for 10 years out of 718, 646 and 423 Diversified Emerging Mkts Funds, respectively, for the period ended 6/30/2024.
In investing, we might borrow the concept and apply it to “home bias,” which describes an investor preference for domestic equities. With the market volatility, the country’s struggle with COVID-19, and the Fed’s response, and political and social tensions, there’s been a lot to obsess about in the U.S. this year. It’s easy to see why clients, and even investment professionals, have been consumed with what’s happening stateside.
But step back, take in the bigger picture, and there’s more to see.
We’ll start by looking at a performance comparison between U.S. markets and emerging markets, and then broaden out to explain our International and Global Strategies team’s enthusiasm for EM going forward.
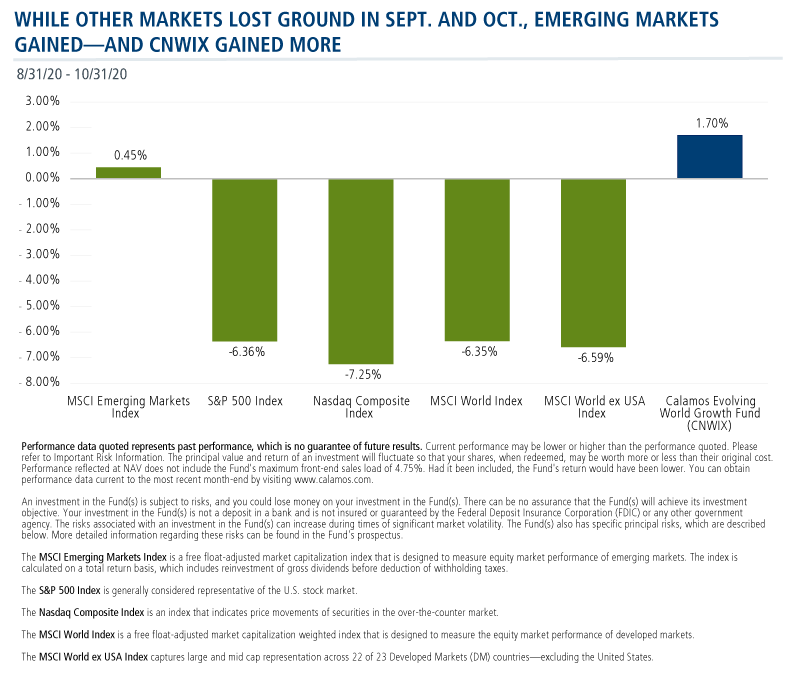
A Better September and October
While the S&P 500 struggled in two back-to-back months (falling -6.36% since the end of August through the end of October), emerging markets managed to stay positive on the heels of better virus and improved earnings growth trends—and the Calamos Evolving World Growth Fund (CNWIX) posted a 1.70% return.
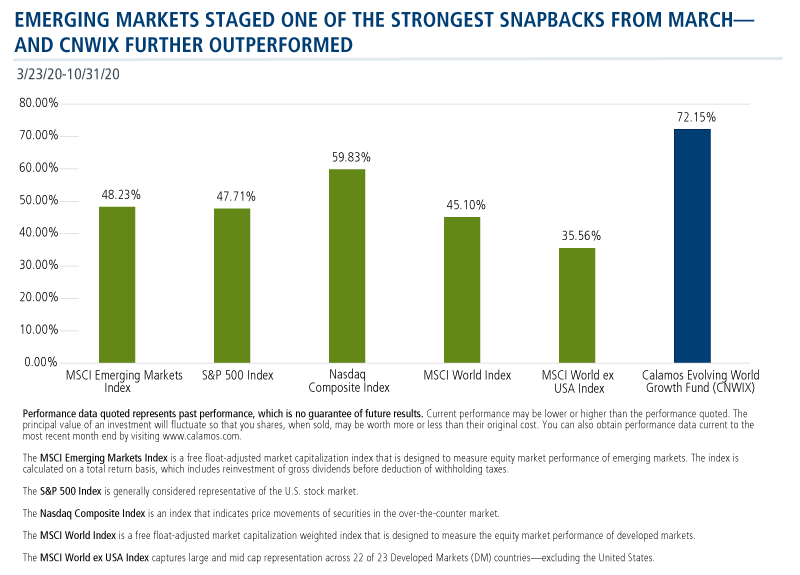
A Better Snapback
Since the bottom of the COVID-related market crisis on March 23, emerging markets have outperformed all markets except for Nasdaq. And the Calamos emerging markets fund? CNWIX gained 72.15%.
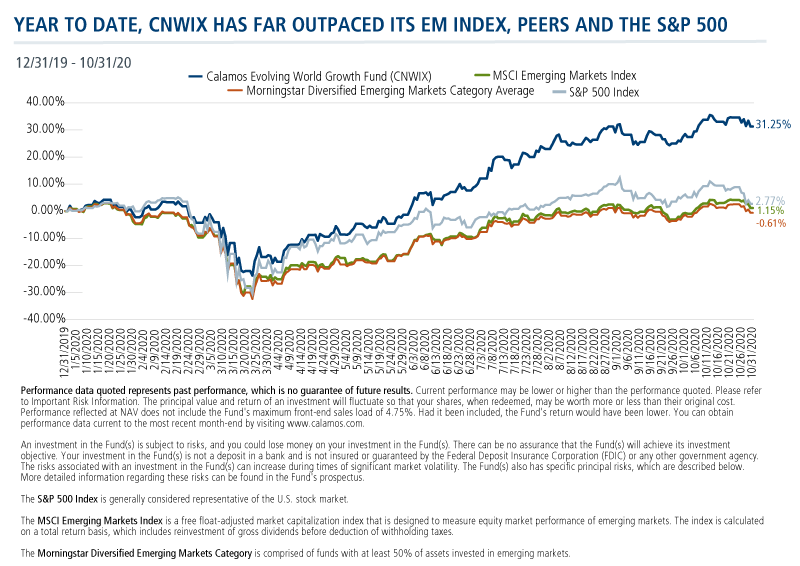
A Better Year to Date
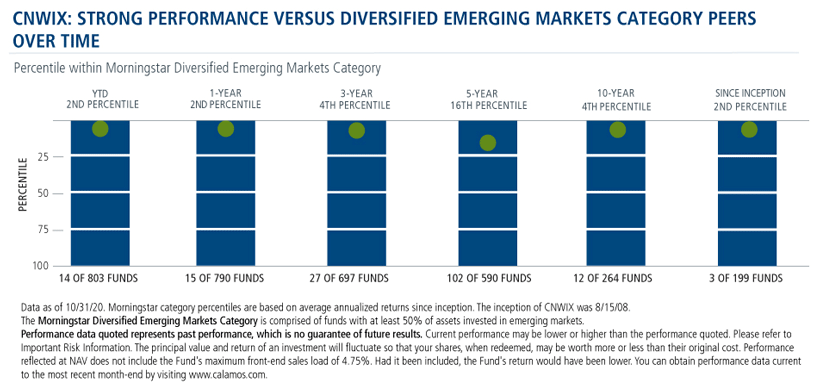
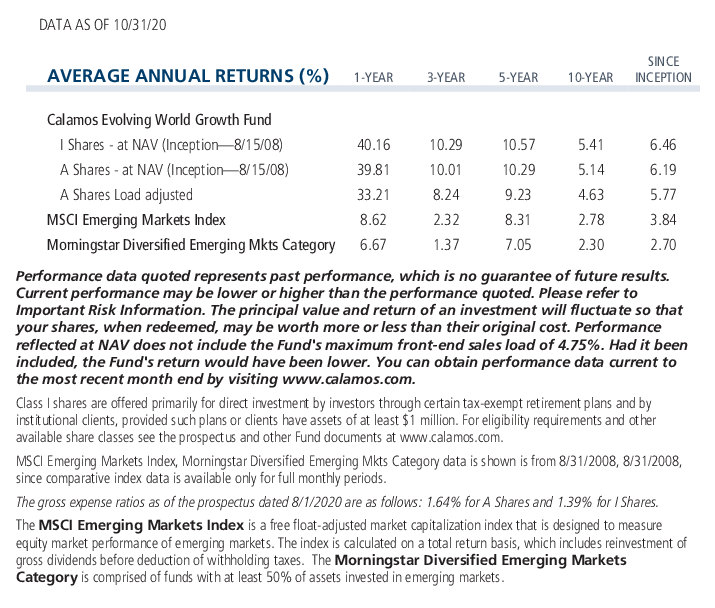
Those who had the foresight to be in emerging markets since the start of 2020 had this experience. While the MSCI EM Index returned 1.15% year-to-date through the end of October, and the Morningstar Diversified Emerging Markets Category average lost -0.61%, an allocation to CNWIX produced 31.25%.
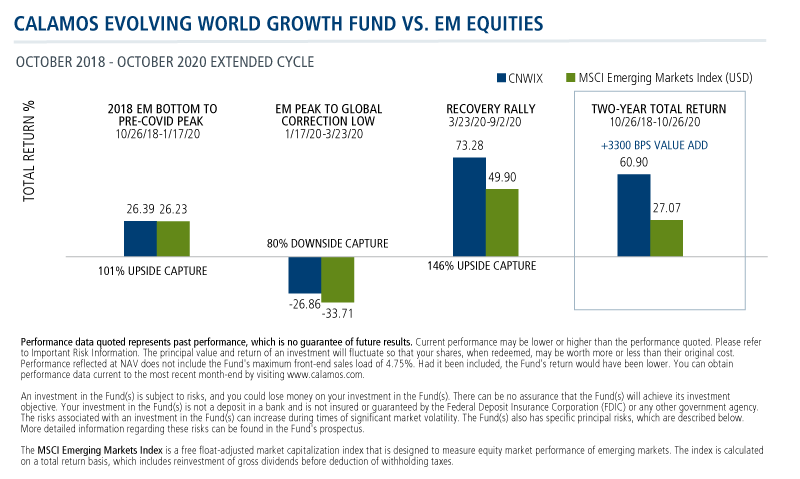
A Better Two-year Cycle
To be sure, global and emerging markets have had their own uncertainty and concern to deal with—from the prolonged trade conflict between the U.S. and China to the pandemic and numerous challenges in between. The chart provides additional insight into how the Calamos team actively managed the CNWIX risk profile.
This is the result of the team’s dynamic and adaptive approach to emerging markets, using a combination of equities, convertibles and options strategies. The goal: to capture the upside in EM when markets rose and to mitigate the downside when markets sold off and volatility spiked.
Five Reasons for EM and CNWIX
We can give you at least five reasons to open your clients’ eyes to emerging markets exposure via CNWIX:
- Emerging markets’ recent outperformance reflects post-pandemic reopening and earnings growth trends. This continues.
- China is positioned for a post-pandemic growth profile, ahead of most developed markets (read more in our team’s recent outlook on global markets and positioning).
- A weaker dollar regime and higher U.S. volatility supports diversification into emerging markets (see this post).
- CNWIX has demonstrated its ability to adapt and thrive in multiple environments tested over two years of accelerated challenges and change.
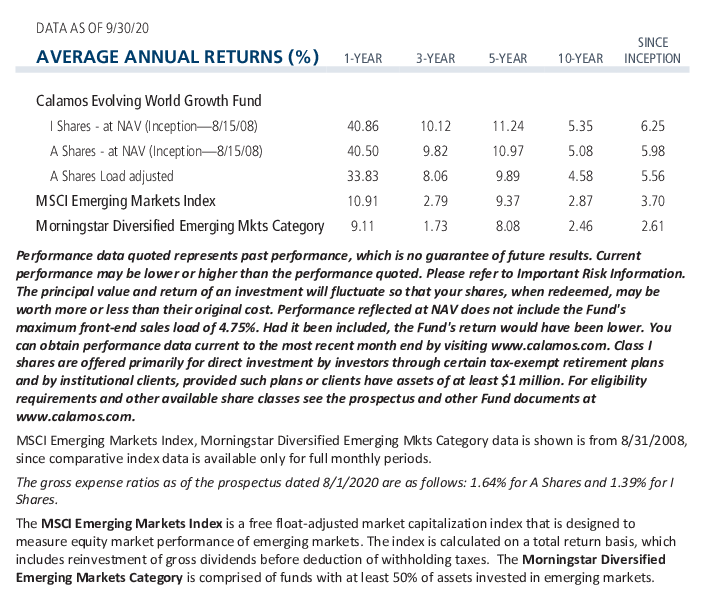
- CNWIX is different from its peers, including the multi-billion dollar behemoth funds, and has produced better results.
Investment professionals, for more information about CNWIX, contact your Calamos Investment Consultant at 888-571-2567 or caminfo@calamos.com.
Before investing, carefully consider the fund’s investment objectives, risks, charges and expenses. Please see the prospectus and summary prospectus containing this and other information which can be obtained by calling 1-866-363-9219. Read it carefully before investing.
An investment in the Fund(s) is subject to risks, and you could lose money on your investment in the Fund(s). There can be no assurance that the Fund(s) will achieve its investment objective. Your investment in the Fund(s) is not a deposit in a bank and is not insured or guaranteed by the Federal Deposit Insurance Corporation (FDIC) or any other government agency. The risks associated with an investment in the Fund(s) can increase during times of significant market volatility. The Fund(s) also has specific principal risks, which are described below. More detailed information regarding these risks can be found in the Fund’s prospectus.
The principal risks of investing in the Calamos Evolving World Growth Fund include: the risk the equity market will decline in general, the risks associated with growth securities which tend to trade at higher multiples and be more volatile, the risks associated with foreign securities including currency exchange rate risk, the risks associated with emerging markets which may have less stable governments and greater sensitivity to economic conditions, and the risks associated with convertible securities, which may decline in value during periods of rising interest rates.
Convertible Securities Risk: The value of a convertible security is influenced by changes in interest rates, with investment value declining as interest rates increase and increasing as interest rates decline. The credit standing of the issuer and other factors also, may have an effect on the convertible security’s investment value.
As a result of political or economic instability in foreign countries, there can be special risks associated with investing in foreign securities, including fluctuations in currency exchange rates, increased price volatility and difficulty obtaining information. In addition, emerging markets may present additional risk due to potential for greater economic and political instability in less developed countries. Total return assumes reinvestment of dividends and capital gains distributions and reflects the deduction of any sales charges, where applicable. Performance may reflect the waiver of a portion of the Fund’s advisory or administrative fees for certain periods since the inception date. If fees had not been waived, performance would have been less favorable.
The S&P 500 Index is generally considered representative of the U.S. stock market.
Morningstar RatingsTM are based on risk-adjusted returns and are through 10/31/20 for Class I shares and will differ for other share classes. Morningstar ratings are based on a risk-adjusted return measure that accounts for variation in a fund's monthly historical performance (reflecting sales charges), placing more emphasis on downward variations and rewarding consistent performance. Within each asset class, the top 10%, the next 22.5%, 35%, 22.5%, and the bottom 10% receive 5, 4, 3, 2 or 1 star, respectively. Each fund is rated exclusively against U.S. domiciled funds. The information contained herein is proprietary to Morningstar and/or its content providers; may not be copied or distributed; and is not warranted to be accurate, complete or timely. Neither Morningstar nor its content providers are responsible for any damages or losses arising from any use of this information. Source: ©2020 Morningstar, Inc.
802215 1120
Archived material may contain dated performance, risk and other information. Current performance may be lower or higher than the performance quoted in the archived material. For the most recent month-end fund performance information visit www.calamos.com. Archived material may contain dated opinions and estimates based on our judgment and are subject to change without notice, as are statements of financial market trends, which are based on current market conditions at the time of publishing. We believed the information provided here was reliable, but do not warrant its accuracy or completeness. This material is not intended as an offer or solicitation for the purchase or sale of any financial instrument. The views and strategies described may not be suitable for all investors. This material has been prepared for informational purposes only, and is not intended to provide, and should not be relied on for, accounting, legal or tax advice. References to future returns are not promises or even estimates of actual returns a client portfolio may achieve. Any forecasts contained herein are for illustrative purposes only and are not to be relied upon as advice or interpreted as a recommendation.
Performance data quoted represents past performance, which is no guarantee of future results. Current performance may be lower or higher than the performance quoted. The principal value and return of an investment will fluctuate so that your shares, when redeemed, may be worth more or less than their original cost. Performance reflected at NAV does not include the Fund’s maximum front-end sales load. Had it been included, the Fund’s return would have been lower.
Archived on November 09, 2021