For Your Deep Dive into CPLIX
August 3, 2022
Long/short investing is not for the faint of heart. Of the 98 unique funds in Morningstar’s Long-Short Equity Category, only seven have a performance history extending back to 2002. Just 24 survived the 2008 financial crisis. As reported in our annual review of liquid alts, in 2021—an outstanding year for alts—long/short funds experienced the greatest dispersion in performance. A shareholder might have ended the year with a 62% gain or a 21% loss, a difference of 83%.
The bottom line: investment professionals truly need to kick the tires when they’re considering a long/short fund. For help with your due diligence, we’ve published a performance analysis of Calamos Phineus Long/Short Fund. In fact, CPLIX is one of those few funds with a 20-year performance record (see our anniversary page), a survivor of the GFC.
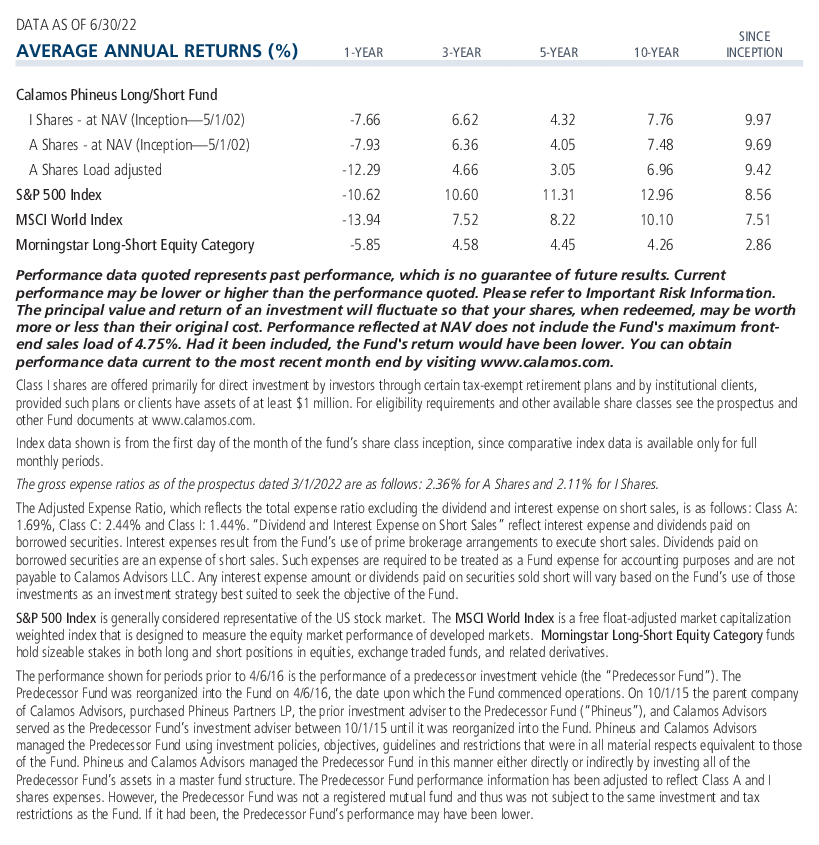
CPLIX is the #1 fund in its category since inception (as of 6/30/22), a distinction achieved with an average net exposure of 27%. Percentile within Morningstar Long-Short Equity Category, ranking based on total return (as of 6/30/22): 1-year 56th (112 of 197), 3-year 28th (52 of 185), 5-year 51st (80 of 173), 10-year 10th (8 of 69), Inception 1st (1 of 15).
Use CPLIX, Co-CIO, Head of Long/Short Strategies, and Senior Co-Portfolio Manager Michael Grant likes to say, to make the risk on/risk off decisions for you.
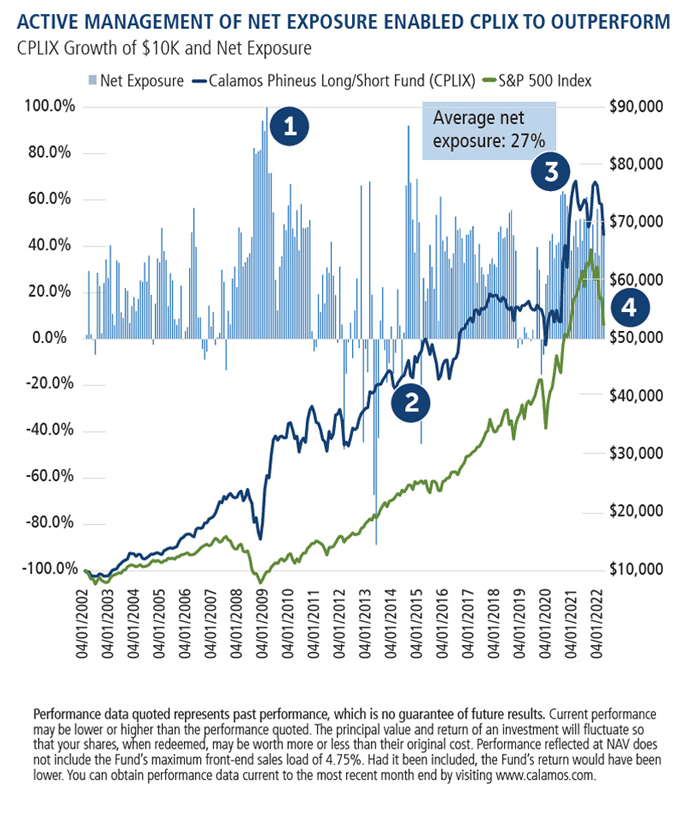
- FALL 2008: Net long exposure guidelines increased from +40% to +80% to engage more equity risk as unique investment opportunities became available in the wake of the Global Financial Crisis. This has facilitated our mandate for greater flexibility to optimize returns over time.
- 2012-2013: 2012 opened with lingering concern about the weak US recovery, the debt crisis in Europe, and political uncertainty around the world. Some predicted a eurozone breakup triggered by impending debt defaults in Greece and Portugal. The global economy was showing early signs of a slowdown, and many investors were weighing the potential economic impact of the US elections in 2012. Nonetheless, the market advanced, as it did in 2013 despite investor nerves over the Federal Reserve’s monetary stimulus. Our concerns over market volatility continued, reflected in CPLIX’s hedge on the general market.
- 2020: We certainly did not anticipate the pandemic. Hedged exposures at the start of the year were based on expected corporate earnings slowdown that could not support equity valuations. But once the pandemic emerged, our investment decisions proved more right than wrong. Average net equity exposure was relatively high at +36% (delta-adjusted) and +47% (real exposure), respectively. Hedging in Q1 was helpful in avoiding much of the market losses, the question later was how to best assess the market opportunities in the aftermath of the selloff. As markets began to recover, we engaged in taking on market risk. A preemptive move was made to shield clients from the historic disconnect between the safety and defensive parts of the market on the one hand, and the beneficiaries of cyclical recovery on the other. Such preemption is the antithesis of momentum investing, and benefited clients.
- 2021-2022: The fund concluded 2021 with an average net equity exposure of 44.8% (delta-adjusted), underweight in the mega cap, long duration, safety growth stocks represented by a select set of names, propelled overall index returns for the year. Conversely, the overweight in the more valued-oriented sectors, such as industrials and financials were positive contributors. CPLIX was well positioned moving into 2022 as the portfolio structuring played out as expected. We maintained conviction in the markets selectively, leaning into many of the “reopen” trades (transportation, banks, travel and leisure), and avoiding many of the large cap tech names that were most susceptible to repricing in the wake of rising interest rates, inflation and tighter fiscal and monetary policies.
For a full historical analysis of the fund’s performance over the various market environments of the last two decades, download this 8-page report prepared by Elise Pondel, Calamos Director of Product Analytics and Robert Bush, Portfolio Specialist.
Before investing, carefully consider the fund’s investment objectives, risks, charges and expenses. Please see the prospectus and summary prospectus containing this and other information which can be obtained by calling 1-866-363-9219. Read it carefully before investing.
The principal risks of investing in the Calamos Phineus Long/Short Fund include: equity securities risk consisting of market prices declining in general, short sale risk consisting of potential for unlimited losses, foreign securities risk, currency risk, geographic concentration risk, other investment companies (including ETFs) risk, derivatives risk, options risk, and leverage risk. As a result of political or economic instability in foreign countries, there can be special risks associated with investing in foreign securities, including fluctuations in currency exchange rates, increased price volatility and difficulty obtaining information. In addition, emerging markets may present additional risk due to potential for greater economic and political instability in less developed countries.
Morningstar Long-Short Equity Category funds hold sizeable stakes in both long and short positions in equities, exchange traded funds, and related derivatives The S&P 500 Index represents the US stock market. The MSCI World Index represents developed market stocks. Indexes are unmanaged, do not include fees or expenses and are not available for direct investment.
810217 822
Archived material may contain dated performance, risk and other information. Current performance may be lower or higher than the performance quoted in the archived material. For the most recent month-end fund performance information visit www.calamos.com. Archived material may contain dated opinions and estimates based on our judgment and are subject to change without notice, as are statements of financial market trends, which are based on current market conditions at the time of publishing. We believed the information provided here was reliable, but do not warrant its accuracy or completeness. This material is not intended as an offer or solicitation for the purchase or sale of any financial instrument. The views and strategies described may not be suitable for all investors. This material has been prepared for informational purposes only, and is not intended to provide, and should not be relied on for, accounting, legal or tax advice. References to future returns are not promises or even estimates of actual returns a client portfolio may achieve. Any forecasts contained herein are for illustrative purposes only and are not to be relied upon as advice or interpreted as a recommendation.
Performance data quoted represents past performance, which is no guarantee of future results. Current performance may be lower or higher than the performance quoted. The principal value and return of an investment will fluctuate so that your shares, when redeemed, may be worth more or less than their original cost. Performance reflected at NAV does not include the Fund’s maximum front-end sales load. Had it been included, the Fund’s return would have been lower.
Archived on August 03, 2023