Convertibles Outperformed Fixed Income in the 1st Half, Will They Catch Up to Equities in the 2nd?
July 28, 2021
Convertibles finished the first half of 2021 as the top fixed income asset class, extending their performance as the best performing fixed income asset class of both last year and the year before (see our Fixed Income Asset Class quilt).
Throughout the year, the Calamos Convertible Fund (CICVX) portfolio management team has been optimistic about the opportunities they’ve been finding. (See this post and our monthly U.S. Convertible Market Snapshot.)
“This is a great pool to be fishing from,” repeated Joe Wysocki, CFA, Senior Vice President, Senior Co-Portfolio Manager, at a meeting of investment professionals last week.
“We’re seeing a lot of great innovative companies. Fundamental momentum is continuing. This is even an area where some of the M&A targets come from. We’ve recently had multiple midcap-type acquisitions, being taken out of our market because larger cap companies are coming into our space. It’s a great backdrop to pick convertibles from.”
Trailing the Broader Equity Market
But Wysocki acknowledged that convertibles trailed the S&P 500 in the first half of the year. By June 30, the ICE BofA All U.S. Convertibles Index (VXA0) returned 6.9% while the S&P was up 15.25%.
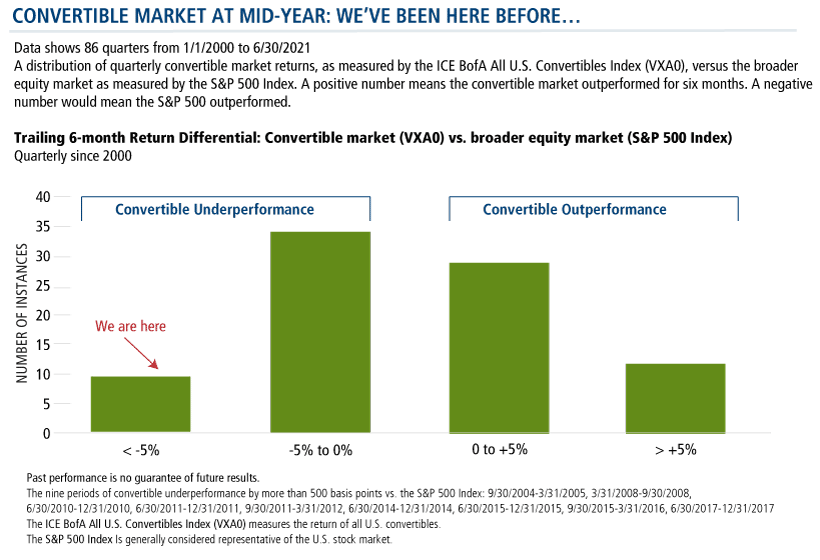
“While that is lower than normal capture, it certainly is not out of the ordinary,” said Wysocki, offering the following two charts.
The first chart shows the distribution of convertible vs. broader equity performance over the last 86 quarters. Since 2000 there have been nine instances, with the 10th occurring now, when the return differential has been more than 500 basis points.
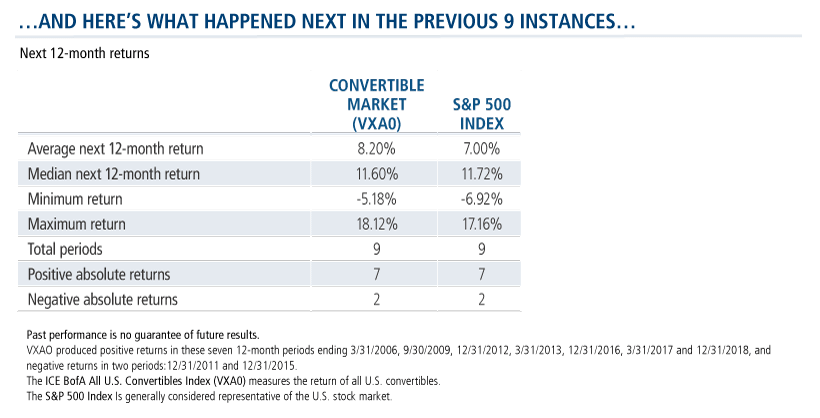
The second chart reviews the return experience in the 12 months after those nine periods of underperformance. The average return of 8% and median return of 11% was very close to the upside capture of the broader S&P 500, Wysocki noted. Seven periods were positive, two were negative.
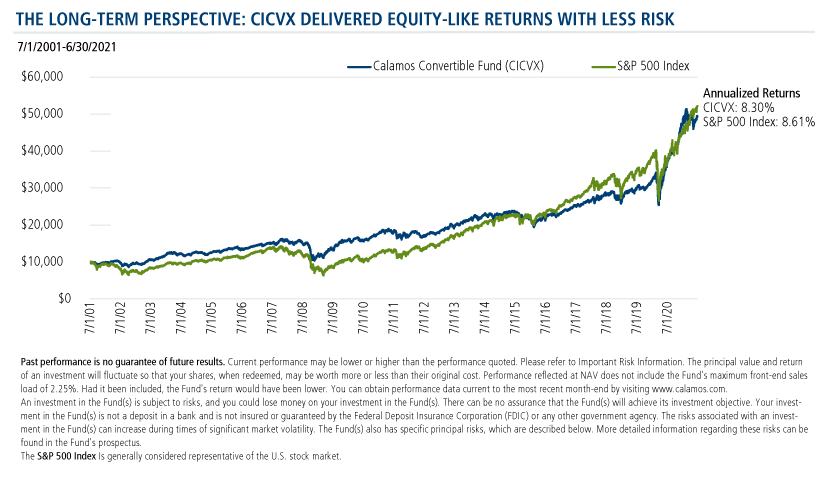
But ultimately, Wysocki said he preferred the third chart shown below—which puts individual quarters and even years in context as the 20-year return of CICVX nearly matched the S&P.
“This chart,” he said, “would simply suggest that investors buy and hold convertibles because you’re getting equity exposure and ultimately less than equity risk over the long term. Let’s keep it in perspective.”
One of the Best Relative Growth Opportunities
Wysocki then turned his attention to the opportunity represented by the smaller, midcap issuers that make up today’s convertible market.
“We’re looking for companies that grow intrinsic value," he said. "You can do that with revenue or profitability. We don’t think that you can cut costs to raise profitability into perpetuity. So, revenue growth is often the harder side of that economic picture to grow intrinsic value—and when you think about it from that context, we have a great issuer base.”
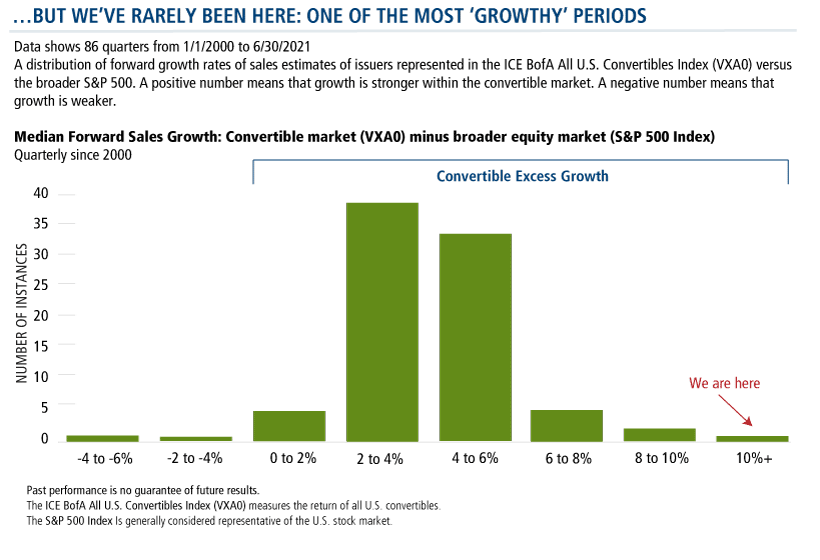
Today’s median convertible issue is projected to grow its sales 22% versus the 12% sales growth expected of the S&P 500. “That’s 1,000 basis points of excess growth in the convertible market for the next 12 months,” Wysocki said. “That’s important for perspective, too.”
Of course, there’s an upward bias as the convertible market is a faster growth composition compared to the S&P 500 almost all of the time.
But, as the chart below shows, today’s market is about as “growthy” as it’s been in 20 years. “Again,” Wysocki added, “we think that’s a key indicator into the growing intrinsic value of these companies.”
Will the S&P continue to outperform converts or are convertibles due to catch up? Investment professionals, contact your Calamos Investment Consultant at 888-571-2567 or caminfo@calamos.com to discuss.
Before investing, carefully consider the fund’s investment objectives, risks, charges and expenses. Please see the prospectus and summary prospectus containing this and other information which can be obtained by calling 1-866-363-9219. Read it carefully before investing.
Opinions and estimates offered constitute our judgment and are subject to change without notice, as are statements of financial market trends, which are based on current market conditions. We believe the information provided here is reliable, but do not warrant its accuracy or completeness. This material is not intended as an offer or solicitation for the purchase or sale of any financial instrument. The views and strategies described may not be suitable for all investors. This material has been prepared for informational purposes only, and is not intended to provide, and should not be relied on for, accounting, legal or tax advice. References to future returns are not promises or even estimates of actual returns a client portfolio may achieve. Any forecasts contained herein are for illustrative purposes only and are not to be relied upon as advice or interpreted as a recommendation.
The principal risks of investing in the Calamos Convertible Fund include: convertible securities risk consisting of the potential for a decline in value during periods of rising interest rates and the risk of the borrower to miss payments, synthetic convertible instruments risk consisting of fluctuations inconsistent with a convertible security and the risk of components expiring worthless, foreign securities risk, equity securities risk, interest rate risk, credit risk, high yield risk, portfolio selection risk and liquidity risk. As a result of political or economic instability in foreign countries, there can be special risks associated with investing in foreign securities, including fluctuations in currency exchange rates, increased price volatility and difficulty obtaining information. In addition, emerging markets may present additional risk due to potential for greater economic and political instability in less developed countries.
802462 721
Archived material may contain dated performance, risk and other information. Current performance may be lower or higher than the performance quoted in the archived material. For the most recent month-end fund performance information visit www.calamos.com. Archived material may contain dated opinions and estimates based on our judgment and are subject to change without notice, as are statements of financial market trends, which are based on current market conditions at the time of publishing. We believed the information provided here was reliable, but do not warrant its accuracy or completeness. This material is not intended as an offer or solicitation for the purchase or sale of any financial instrument. The views and strategies described may not be suitable for all investors. This material has been prepared for informational purposes only, and is not intended to provide, and should not be relied on for, accounting, legal or tax advice. References to future returns are not promises or even estimates of actual returns a client portfolio may achieve. Any forecasts contained herein are for illustrative purposes only and are not to be relied upon as advice or interpreted as a recommendation.
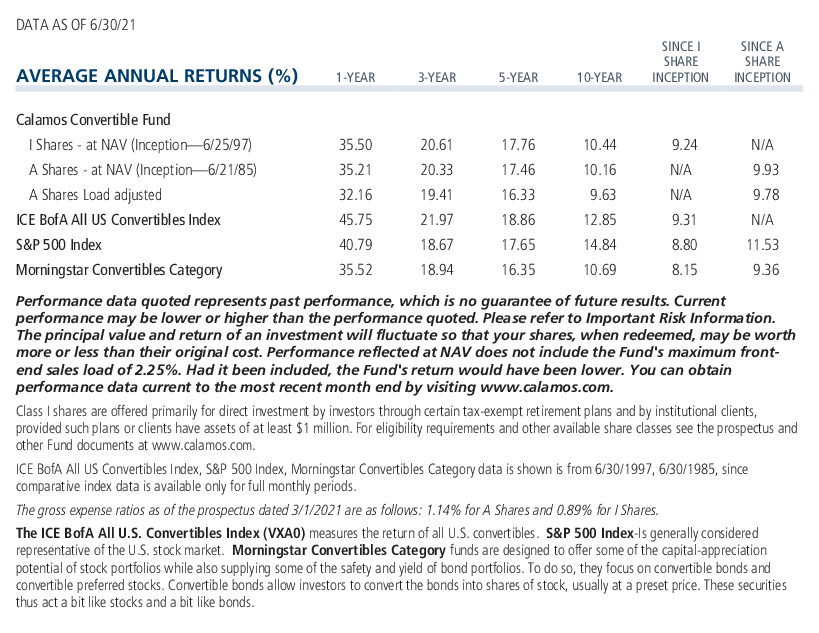
Performance data quoted represents past performance, which is no guarantee of future results. Current performance may be lower or higher than the performance quoted. The principal value and return of an investment will fluctuate so that your shares, when redeemed, may be worth more or less than their original cost. Performance reflected at NAV does not include the Fund’s maximum front-end sales load. Had it been included, the Fund’s return would have been lower.
Archived material may contain dated performance, risk and other information. Current performance may be lower or higher than the performance quoted in the archived material. For the most recent month-end fund performance information visit www.calamos.com. Archived material may contain dated opinions and estimates based on our judgment and are subject to change without notice, as are statements of financial market trends, which are based on current market conditions at the time of publishing. We believed the information provided here was reliable, but do not warrant its accuracy or completeness. This material is not intended as an offer or solicitation for the purchase or sale of any financial instrument. The views and strategies described may not be suitable for all investors. This material has been prepared for informational purposes only, and is not intended to provide, and should not be relied on for, accounting, legal or tax advice. References to future returns are not promises or even estimates of actual returns a client portfolio may achieve. Any forecasts contained herein are for illustrative purposes only and are not to be relied upon as advice or interpreted as a recommendation.
Performance data quoted represents past performance, which is no guarantee of future results. Current performance may be lower or higher than the performance quoted. The principal value and return of an investment will fluctuate so that your shares, when redeemed, may be worth more or less than their original cost. Performance reflected at NAV does not include the Fund’s maximum front-end sales load. Had it been included, the Fund’s return would have been lower.
Archived on July 28, 2022