The Convertible Market’s Torrid Issuance Pace—and What It Means for Actively Managed CICVX
June 10, 2020
Today let’s dig a little deeper into the enthusiasm surrounding the torrid pace of convertible issuance.
The U.S. convertible market is on fire this year, with new issuance in May alone totaling $22.7 billion, a record month. A total of 44 issues were brought to market last month.
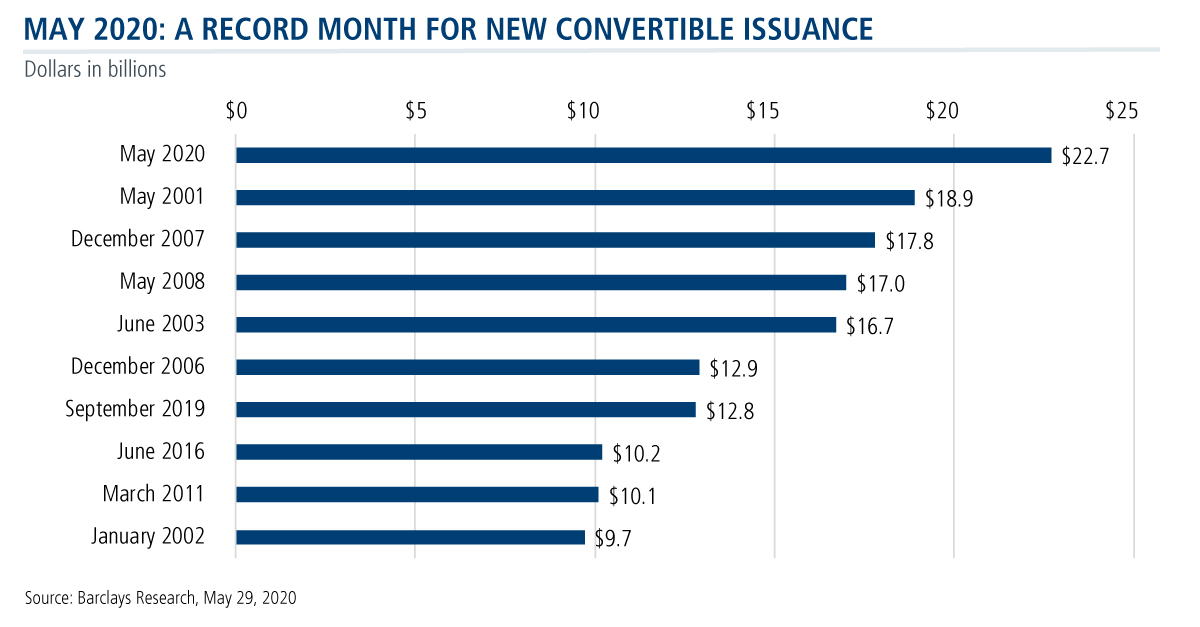
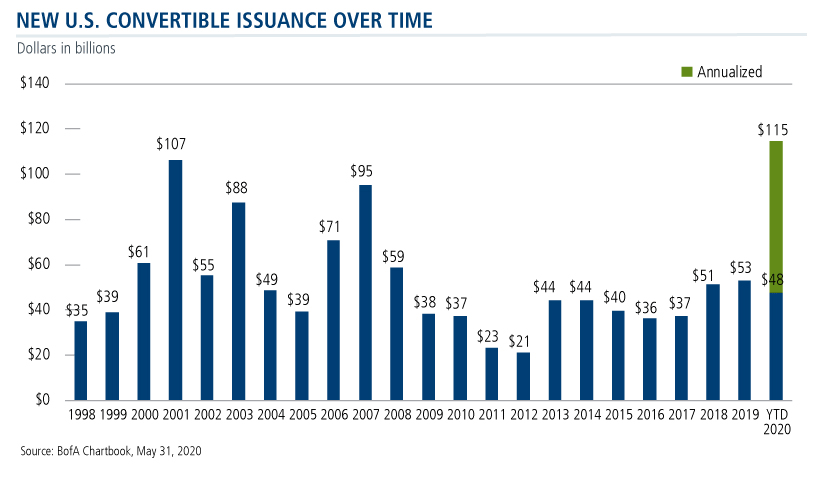
The market is on track for more than $114 billion in new issuance on an annualized basis—or the best new issuance since before 1998. The year-to-date $47.8 billion total issuance through May is already higher than in years 2009 to 2017.
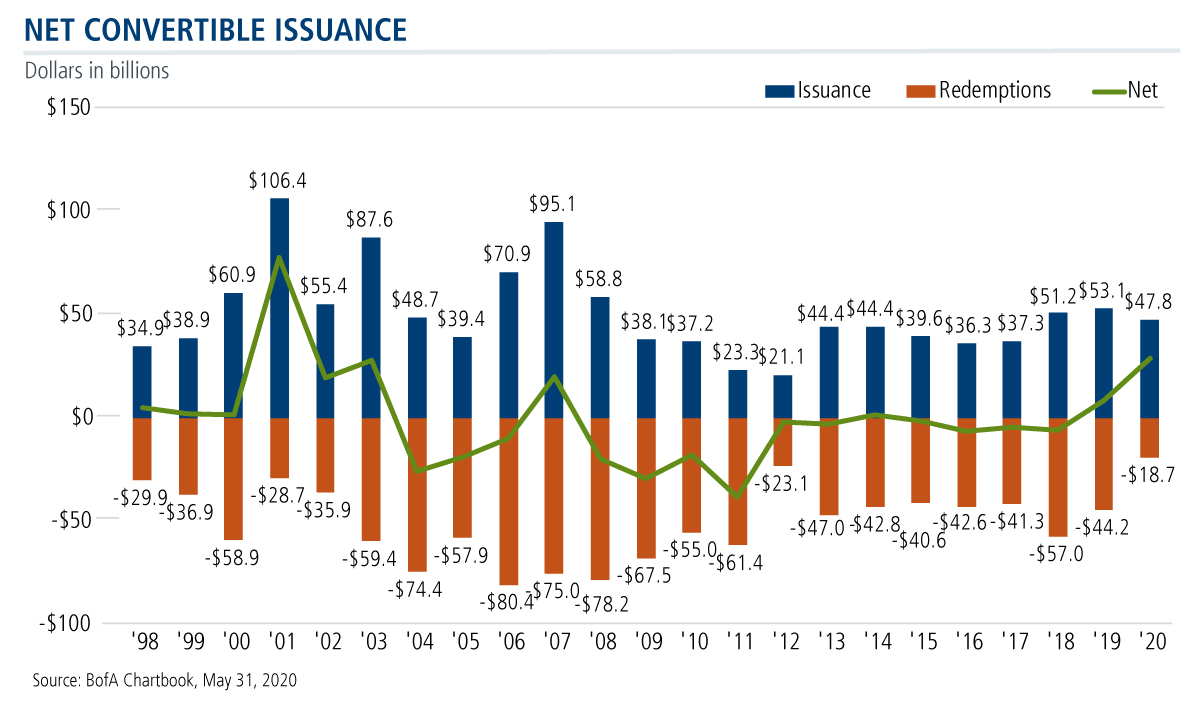
The $29 billion in net new issuance year to date is the highest amount since 2003.
“Historically, convertibles have been one of the first markets to open back up after periods of stress, and it’s happening again now,” said Joe Wysocki, Senior Vice President, Co-Portfolio Manager, at our recent "Adding Convertible Strategies to Your Playbook" webcast (watch the replay).
The market has a secondary as well as primary market, of course. But, it’s always good to see a robust issuance market, said Wysocki. Sixty percent of the new issuance this year has come from new entrants identifying convertibles as an effective means of accessing capital.
Convertibles are being issued by more household names than have been seen recently, including Carnival, Booking.com, Priceline, Southwest Airlines and well known retailers, as Eli Pars, CFA, Co-CIO, Head of Alternative Strategies and Co-Head of Convertible Strategies, Senior Co-Portfolio Manager, said on a recent conference call (see this post).
“Many of the trades we’ve seen in the last month have been more what I’d call recovery trades by companies that need to firm up their balance sheets to deal with the implications of the shutdown and what’s going on with COVID-19,” said Pars.
New Issuance Provides Added Opportunity for Rebalancing Risk Profiles
But for the specialists actively managing the Calamos convertible-using funds, new paper provides additional opportunities to rebalance risk profiles—and that’s the critical piece in the potential for your clients to benefit from convertible exposure.
“Convertible are hybrid securities, equity and credit markets are moving every day. And these moves can impact the risk profile of a convertible very rapidly, especially in volatile markets,” said Wysocki. “We’ve seen the average convert issue stock declined almost 40% at the lows in March. And we’ve subsequently seen many stocks rebound over 100% or more in the next month.”
He emphasized the unique characteristic of convertible portfolios: “Convertibles can change without you changing your portfolio at all. If you don’t monitor the risks, you could be left with a portfolio that’s full of busted bonds or yield alternatives. Or you could be left with a portfolio of equity alternatives, failing to provide downside protection.”
Wysocki cited three previous scenarios to illustrate his point. The table below describes the convertible market at four different times (March 2000, February 2009, March 2020 and May 2020) and the mix of the convertible market at those times. Note that this was the mix if not rebalanced by an active manager.
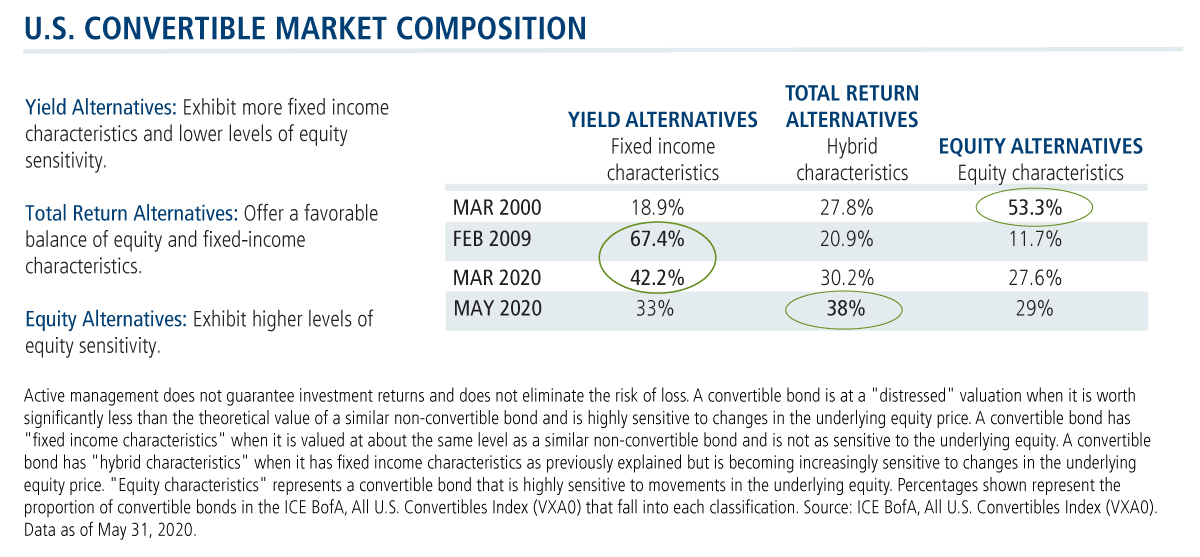
- March 2000: This was a strong equity market, and convertibles participated—resulting in more than half of the convertibles in the market as equity-sensitive.
The risk: Investors buying into the convert market at that time were getting very little downside protection right when they were about to need it the most.
- February 2009: Convertibles held up well relative to their underlying equities—but that left investors who bought the convert market at that time with a portfolio of almost 70% bonds.
The risk: Investors in a passive portfolio didn’t benefit from exposure to the total return upside that equities could have provided.
- March 2020: As of the end of the first quarter of this year, the market was fairly well distributed.
May 2020: Two months later, by the end of May, the total return segment of the convert market was the largest and the yield alternative now the smallest.
The risk: “One of the bigger risks right now,” according to Wysocki, “is not actively managing these risks as they change. Things are moving quite fast. There are many individual opportunities out there and owning the right ones at the right time can make a difference.”
Passive investors in convertibles need to be aware, Wysocki said, that “they’re letting the market dictate their asset allocation, and that could potentially leave them exposed to the wrong risks at the exact wrong times. You can have two portfolios that invest in convertibles, but they could have dramatically different risk profiles: You could have a closet equity fund or a busted credit fund. Both will have significantly different return profiles.”
Calamos believes, he said, “that when you’re taking an active approach to convertibles, you really want to use them for what their core is—that sweet spot of that total return segment. Being able to overweight that segment and continuously rebalance your risk/reward to have that profile is what’s key.”
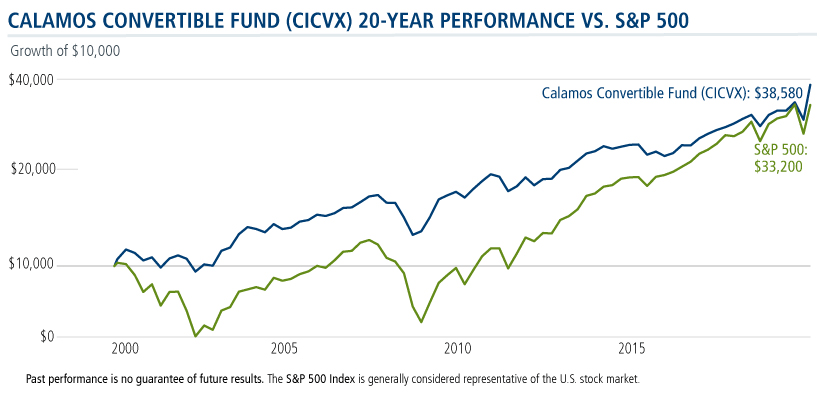
Here’s a look at how Calamos Convertible Fund (CICVX) has performed versus the equity market over the last 20 years.
Investment professionals, for more information about our active approach to investing in convertibles, contact your Calamos Investment Consultant at 888-571-2567 or caminfo@calamos.com.
For a monthly update on the convertible market, subscribe to the Calamos U.S. Convertible Market Snapshot.
Before investing, carefully consider the fund’s investment objectives, risks, charges and expenses. Please see the prospectus and summary prospectus containing this and other information which can be obtained by calling 1-866-363-9219. Read it carefully before investing.
The opinions referenced are as of the date of publication and are subject to change due to changes in the market or economic conditions and may not necessarily come to pass. Information contained herein is for informational purposes only and should not be considered investment advice. References to specific securities, asset classes and financial markets are for illustrative purposes only and are not intended to be, and should not be interpreted as, recommendations.
Convertible Securities Risk: The value of a convertible security is influenced by changes in interest rates, with investment value declining as interest rates increase and increasing as interest rates decline. The credit standing of the issuer and other factors also, may have an effect on the convertible security’s investment value.
The S&P 500 Index is generally considered representative of the U.S. stock market.
The ICE BofA All U.S. Convertibles Index (VXA0) comprises approximately 700 issues of only convertible bonds and preferreds of all qualities. Source ICE Data Indices, LLC, used with permission. ICE permits use of the ICE BofA indices and related data on an ‘as is’ basis, makes no warranties regarding same, does not guarantee the suitability, quality, accuracy, timeliness, and/or completeness of the ICE BofA Indices or data included in, related to, or derived therefrom, assumes no liability in connection with the use of the foregoing and does not sponsor, endorse or recommend Calamos Advisors LLC or any of its products or services.
802031C 0620
Archived material may contain dated performance, risk and other information. Current performance may be lower or higher than the performance quoted in the archived material. For the most recent month-end fund performance information visit www.calamos.com. Archived material may contain dated opinions and estimates based on our judgment and are subject to change without notice, as are statements of financial market trends, which are based on current market conditions at the time of publishing. We believed the information provided here was reliable, but do not warrant its accuracy or completeness. This material is not intended as an offer or solicitation for the purchase or sale of any financial instrument. The views and strategies described may not be suitable for all investors. This material has been prepared for informational purposes only, and is not intended to provide, and should not be relied on for, accounting, legal or tax advice. References to future returns are not promises or even estimates of actual returns a client portfolio may achieve. Any forecasts contained herein are for illustrative purposes only and are not to be relied upon as advice or interpreted as a recommendation.
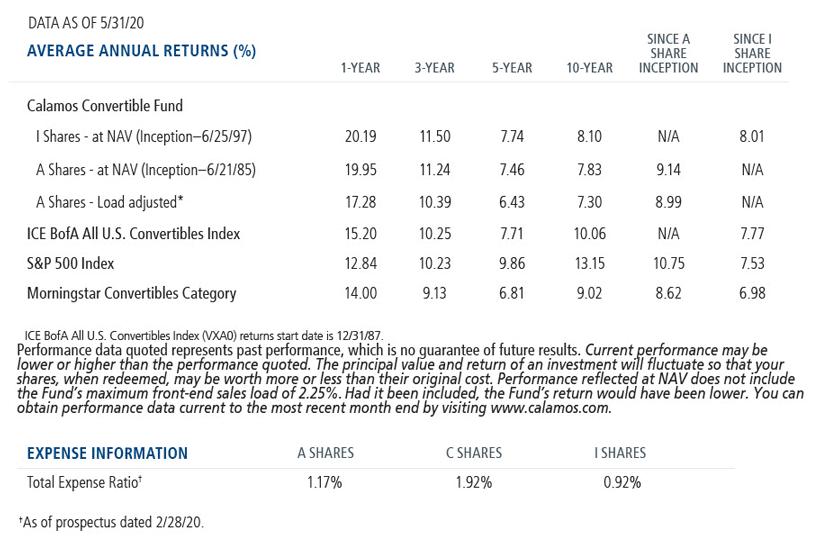
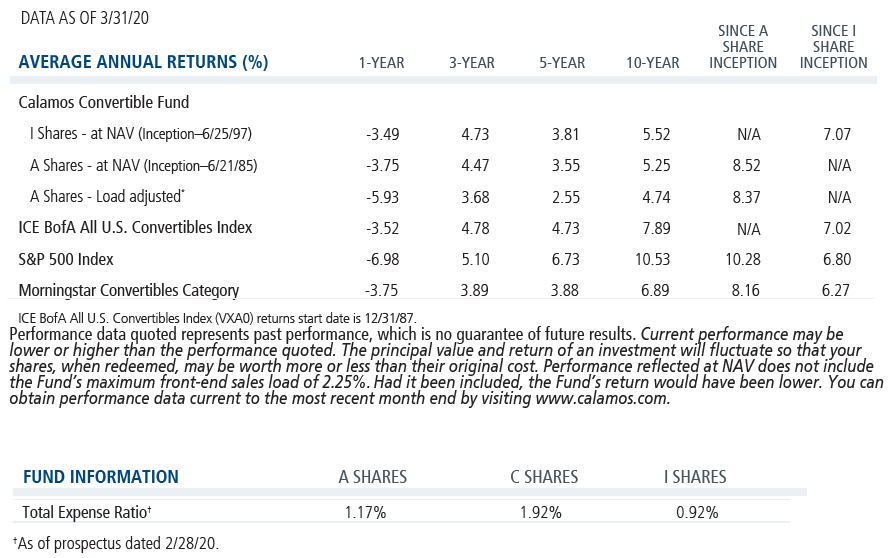
Performance data quoted represents past performance, which is no guarantee of future results. Current performance may be lower or higher than the performance quoted. The principal value and return of an investment will fluctuate so that your shares, when redeemed, may be worth more or less than their original cost. Performance reflected at NAV does not include the Fund’s maximum front-end sales load. Had it been included, the Fund’s return would have been lower.
Archived material may contain dated performance, risk and other information. Current performance may be lower or higher than the performance quoted in the archived material. For the most recent month-end fund performance information visit www.calamos.com. Archived material may contain dated opinions and estimates based on our judgment and are subject to change without notice, as are statements of financial market trends, which are based on current market conditions at the time of publishing. We believed the information provided here was reliable, but do not warrant its accuracy or completeness. This material is not intended as an offer or solicitation for the purchase or sale of any financial instrument. The views and strategies described may not be suitable for all investors. This material has been prepared for informational purposes only, and is not intended to provide, and should not be relied on for, accounting, legal or tax advice. References to future returns are not promises or even estimates of actual returns a client portfolio may achieve. Any forecasts contained herein are for illustrative purposes only and are not to be relied upon as advice or interpreted as a recommendation.
Performance data quoted represents past performance, which is no guarantee of future results. Current performance may be lower or higher than the performance quoted. The principal value and return of an investment will fluctuate so that your shares, when redeemed, may be worth more or less than their original cost. Performance reflected at NAV does not include the Fund’s maximum front-end sales load. Had it been included, the Fund’s return would have been lower.
Archived on June 10, 2021