Hide Here: CPLIX
May 9, 2022
- Nowhere to Hide as Aggressive Rate Bets Spark Rout Across Assets
Bloomberg, April 22, 2022 - ‘Nowhere to Hide’ for Investors in Market Turbulence
Financial Times, April 10, 2022 - Nowhere to Hide: This Market Correction Feels Different
The Boston Globe, April 28, 2022
There’s a common narrative in mainstream and financial media lately that there’s nowhere to hide for investors seeking refuge from the bond and stock markets, both in drawdown mode. Ah, but there is: Calamos Phineus Long/Short Fund (CPLIX).
“Hide? Investors don’t want to hide, they want to make money,” pushes back Robert Bush, Calamos Senior Vice President. “CPLIX’s performance year to date is proof that positive returns are available in this environment.”
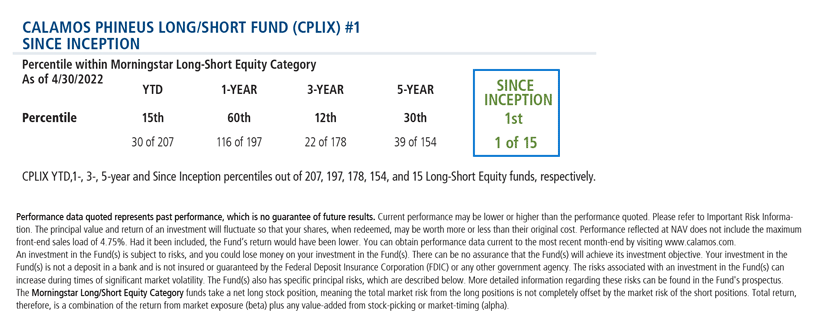
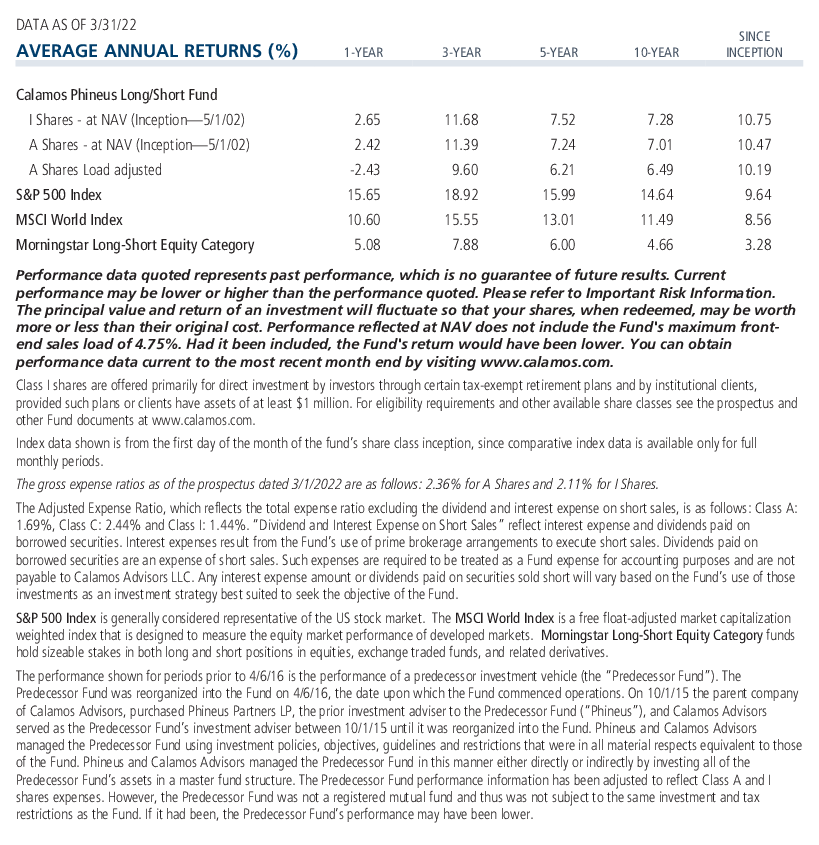
CPLIX, celebrating its 20th birthday this month as the #1 fund since inception in the Morningstar Long-Short Equity category (as of 4/30/22), has further distinguished itself this year. It begins its 21st year as one of just 300 actively managed funds (4.4% of all) with a positive YTD return (3.17%) as of April’s end.
An investor of $10,000 in the fund since May 1, 2002, would have had $73,461 by the end of April 2022. This outpaced US equities (S&P 500 return of $57,027) during their historic run and global equities (MSCI Index: $47,058) while trouncing funds in the Morningstar Long-Short Equity category ($18,097).
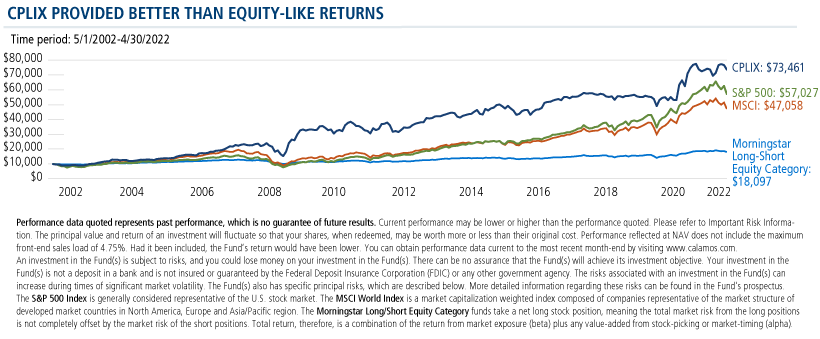
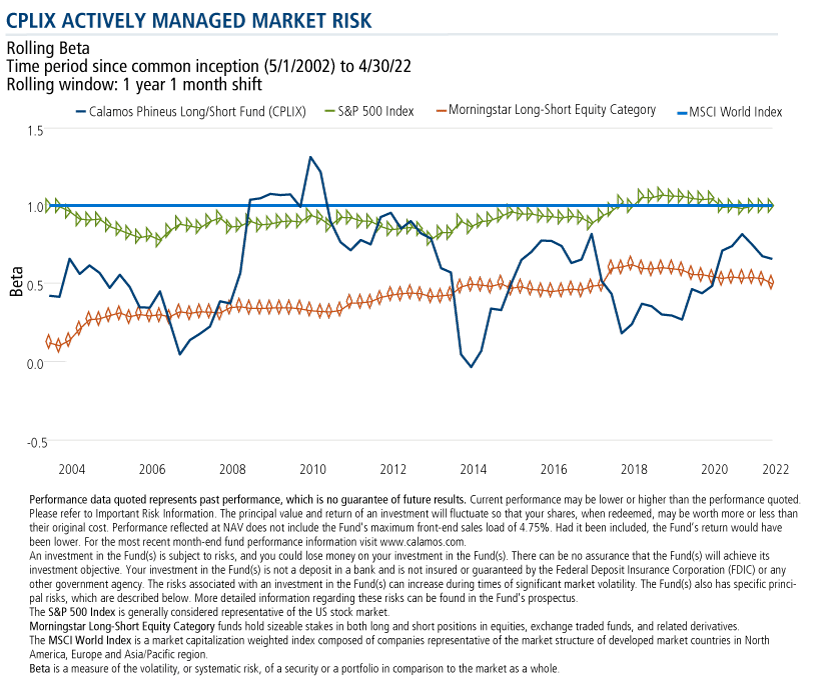
And, “the best part,” according to Bush, is that this outperformance over the last 20 years was achieved by taking on an average exposure to the equity market of just 27%.
To Calamos Co-CIO, Head of Long/Short Strategies and Senior Co-Portfolio Manager Michael Grant, the appeal of establishing a long/short fund was to be able to take the risk-on/risk-off decision to his side of the table. “When the equity environment is favorable,” as Grant explains in this 2017 video, “let’s act like a long-only investor, and when the environment turns pear-shaped, let’s have the flexibility and skills to preserve capital.”
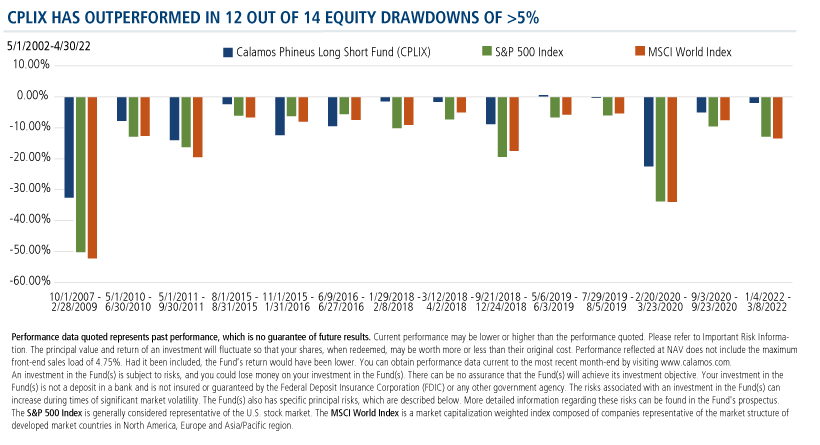
The fund’s historic outperformance during equity drawdowns may of special interest to those looking for somewhere to hide.
Unlike many funds that have a range of beta or overall exposure to the market bound by prospectus, Calamos Phineus Long/Short Fund (CPLIX) is distinguished by its freedom to respond to changing market conditions and developing opportunities. CPLIX is an actively managed fund whose flexibility is its hallmark.
Yes, it was a smart decision 20 years ago to use a long-short fund to ride out the unprecedented market challenges that lay ahead (the tech bubble, the Great Financial Crisis, the global pandemic, and now war in Europe and record inflation increases).
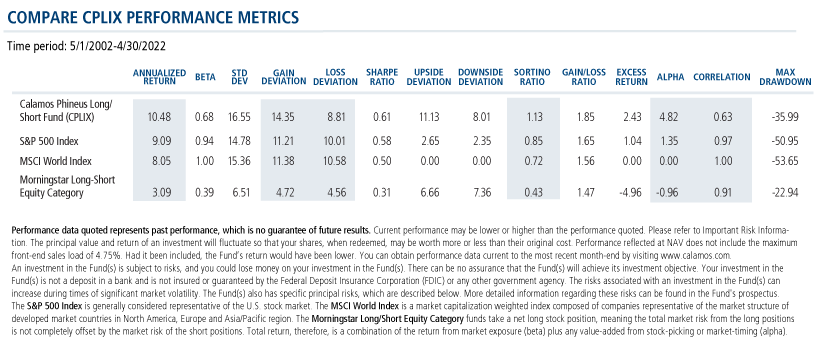
But a deeper look at portfolio metrics further highlights how different CPLIX is from others in the Morningstar Long-Short Equity Category. As we’ve noted previously, the fund’s success in tactically adjusting its market exposure creates opportunities to diversify alpha generation not just relative to long-only equities but in stark contrast to what Grant has termed other “long-light” funds in the category (see this 2019 post).
CPLIX is #1 in its category over 20 years because of Grant and team’s skill in making full use of its mandate to go both long and short in pursuit of returns for shareholders. By these metrics—considering not just returns but Alpha, asymmetric Gain and Loss Deviation, Sortino Ratio, and correlation—the other funds are also-rans.
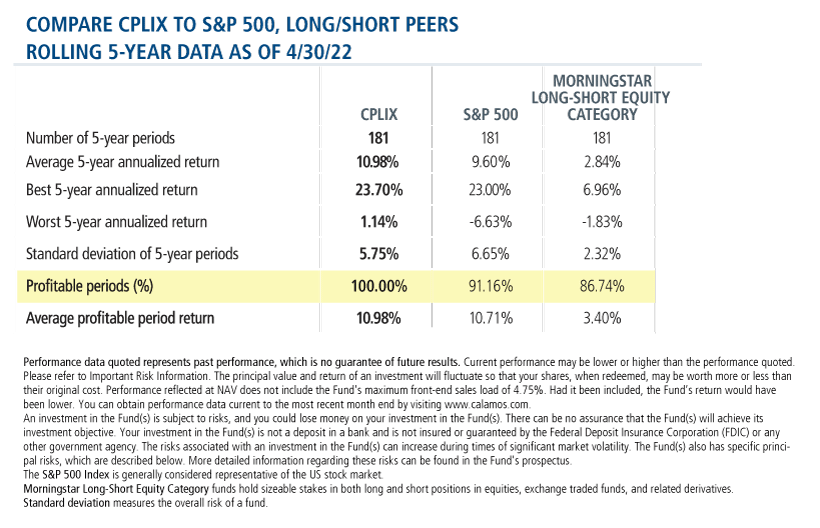
While CPLIX exhibits greater volatility relative to its peers (although often skewed to the upside), those who have been able to commit to the fund for five years have never experienced a negative five-year rolling period. This is since the fund’s inception on 5/1/2002 and using a monthly return series as of 4/30/2022. The same can’t be said for the S&P 500—which has had 16 negative periods—or the category.
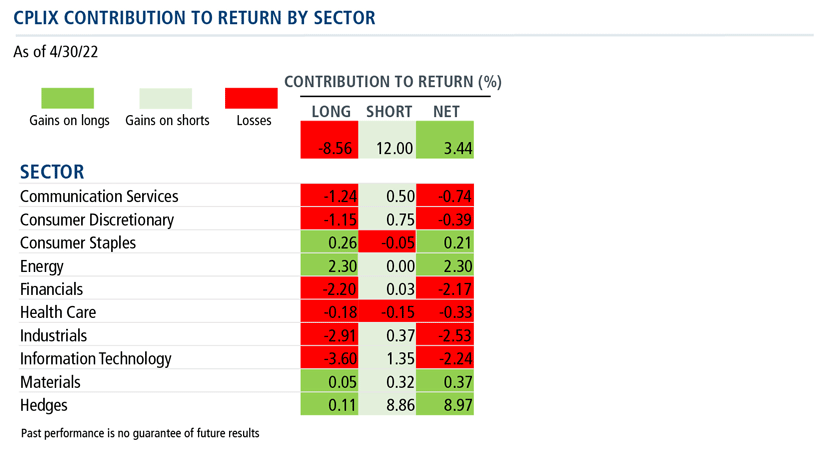
In this year’s battle for returns, CPLIX has distinguished itself with four positive month-ends, with contributions from both its long and short book. Below is the latest attribution data available to be published.
The start of CPLIX’s third decade in May 2022 is leaving no doubt that equity investing will continue to present its share of opportunity and challenges. Grant provides his perspective for the near and longer term in his recently published commentary. As he explains, “engaging in equities” CPLIX-style is quite different from seeking somewhere to hide—and offers a meaningful and potentially beneficial way to diversify equity risk in a portfolio.
“As long as the band’s playing, we might as well dance,” says Grant.
For more information on CPLIX, please see our 20th birthday landing page or talk to your Calamos Investment Consultant at 888-571-2567 or caminfo@calamos.com.
Before investing, carefully consider the fund’s investment objectives, risks, charges and expenses. Please see the prospectus and summary prospectus containing this and other information which can be obtained by calling 1-866-363-9219. Read it carefully before investing.
Alpha is a historical measure of risk-adjusted performance. Alpha measures how much of a portfolio’s performance is attributable to investment-specific factors versus broad market trends. A positive alpha suggests that the performance of a portfolio was higher than expected given the level of risk in the portfolio. A negative alpha suggests that the performance was less than expected given the risk.
Beta is a historic measure of a fund’s relative volatility, which is one of the measures of risk; a beta of 0.5 reflects 1/2 the market’s volatility as represented by the Fund’s primary benchmark, while a beta of 2.0 reflects twice the volatility.
Correlation is a statistical measure that shows how two securities move in relation to each other. A correlation of 1 implies that if one security moves up or down, the other security will move in lockstep, in the same direction. Alternatively, a correlation of 1 means that if one security moves in either direction, the other security will do the exact opposite.
Gain deviation is similar to standard deviation, except that this statistic calculates an average (mean) return for only the periods with a gain and then measures the variation of only the gain periods around this gain mean. This statistic measures the volatility of upside performance.
Gain/loss ratio easures a fund's average gain in a gain period divided by the fund's average loss in a losing period.
Interest rate risk: The value of fixed-income securities generally decreases in periods when interest rates are rising. In addition, interest rate changes typically have a greater effect on prices of longer-term fixed-income securities than shorter-term fixed-income securities. Recent events in the fixed-income market may expose the Fund to heightened interest rate risk and volatility.
Loss deviation Similar to standard deviation, except that this statistic calculates an average (mean) return for only the periods with a loss and then measures the variation of only the losing periods around this loss mean. This statistic measures the volatility of downside performance.
Max drawdown is a statistical measure that shows the maximum loss that occurred during any subperiod over the time period listed.
Sharpe ratio is a measure of risk-adjusted performance, where higher values are indicative of better investment decisions rather than the result of taking on a higher level of risk. Sharpe ratio is calculated by the difference between a portfolio’s return and a risk-free rate, often that of the 10-year Treasury bond, and dividing the result by the portfolio’s standard deviation.
Standard deviation measures the overall risk of a fund.
Sortino ratio is the excess return over the risk-free rate divided by the downside semi-variance, and so it measures the return to "bad" volatility. (Volatility caused by negative returns is considered bad or undesirable by an investor, while volatility caused by positive returns is good or acceptable.)
Upside deviation measures only deviations above a specified benchmark.
Downside deviation measures only deviations below a specified benchmark.
Up-capture ratio is the statistical measure of an investment manager's overall performance in up-markets.
Down-capture ratio is a statistical measure of an investment manager's overall performance in down-markets.
Active management does not guarantee investment returns or eliminate the risk of loss.
As a result of political or economic instability in foreign countries, there can be special risks associated with investing in foreign securities, including fluctuations in currency exchange rates, increased price volatility and difficulty obtaining information. In addition, emerging markets may present additional risk due to potential for greater economic and political instability in less developed countries.
Opinions and estimates offered constitute our judgment and are subject to change without notice, as are statements of financial market trends, which are based on current market conditions. We believe the information provided here is reliable, but do not warrant its accuracy or completeness. This material is not intended as an offer or solicitation for the purchase or sale of any financial instrument. The views and strategies described may not be suitable for all investors. This material has been prepared for informational purposes only, and is not intended to provide, and should not be relied on for, accounting, legal or tax advice. References to future returns are not promises or even estimates of actual returns a client portfolio may achieve. Any forecasts contained herein are for illustrative purposes only and are not to be relied upon as advice or interpreted as a recommendation.
The principal risks of investing in the Calamos Phineus Long/Short Fund include: equity securities risk consisting of market prices declining in general, short sale risk consisting of potential for unlimited losses, foreign securities risk, currency risk, geographic concentration risk, other investment companies (including ETFs) risk, derivatives risk, options risk, and leverage risk. As a result of political or economic instability in foreign countries, there can be special risks associated with investing in foreign securities, including fluctuations in currency exchange rates, increased price volatility and difficulty obtaining information. In addition, emerging markets may present additional risk due to potential for greater economic and political instability in less developed countries.
Alternative investments may not be suitable for all investors. The fund takes long positions in companies that are expected to outperform the equity markets, while taking short positions in companies that are expected to underperform the equity markets and for hedging purposes. The fund may lose money should the securities the fund is long decline in value or if the securities the fund has shorted increase in value, but the ultimate goal is to realize returns in both rising and falling equity markets while providing a degree of insulation from increased market volatility.
810125 0522
Archived material may contain dated performance, risk and other information. Current performance may be lower or higher than the performance quoted in the archived material. For the most recent month-end fund performance information visit www.calamos.com. Archived material may contain dated opinions and estimates based on our judgment and are subject to change without notice, as are statements of financial market trends, which are based on current market conditions at the time of publishing. We believed the information provided here was reliable, but do not warrant its accuracy or completeness. This material is not intended as an offer or solicitation for the purchase or sale of any financial instrument. The views and strategies described may not be suitable for all investors. This material has been prepared for informational purposes only, and is not intended to provide, and should not be relied on for, accounting, legal or tax advice. References to future returns are not promises or even estimates of actual returns a client portfolio may achieve. Any forecasts contained herein are for illustrative purposes only and are not to be relied upon as advice or interpreted as a recommendation.
Performance data quoted represents past performance, which is no guarantee of future results. Current performance may be lower or higher than the performance quoted. The principal value and return of an investment will fluctuate so that your shares, when redeemed, may be worth more or less than their original cost. Performance reflected at NAV does not include the Fund’s maximum front-end sales load. Had it been included, the Fund’s return would have been lower.
Archived on May 09, 2023