Growth/Cyclical Barbell Drives CPLIX Outperformance—and Grant’s 2021 Bullishness Continues
The following post was written by Robert Bush, Calamos Senior Vice President and Director of Closed-End Fund Products.
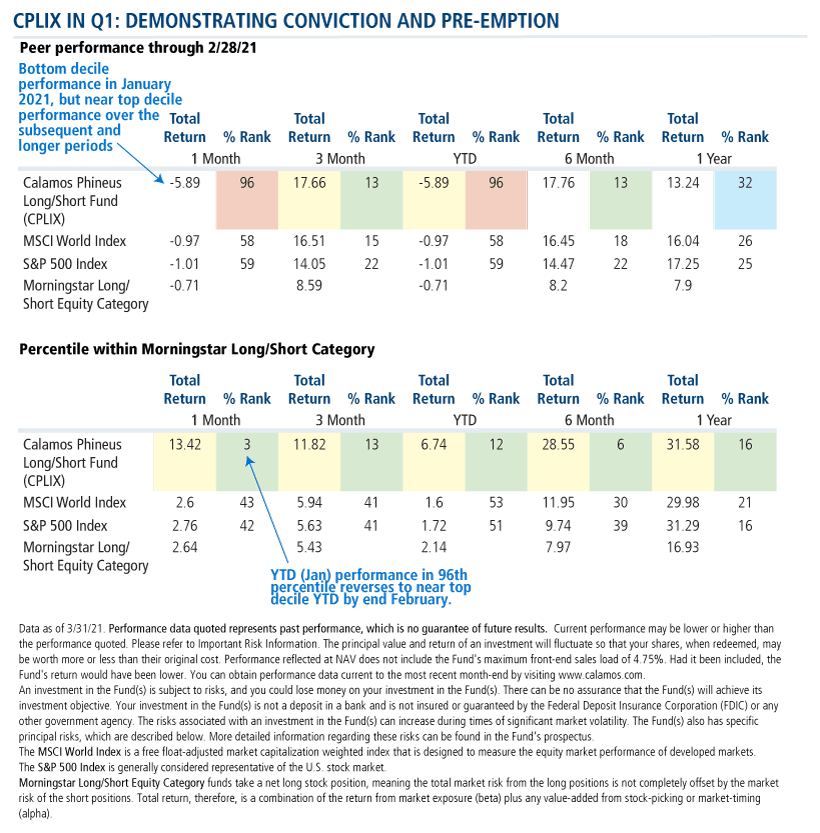
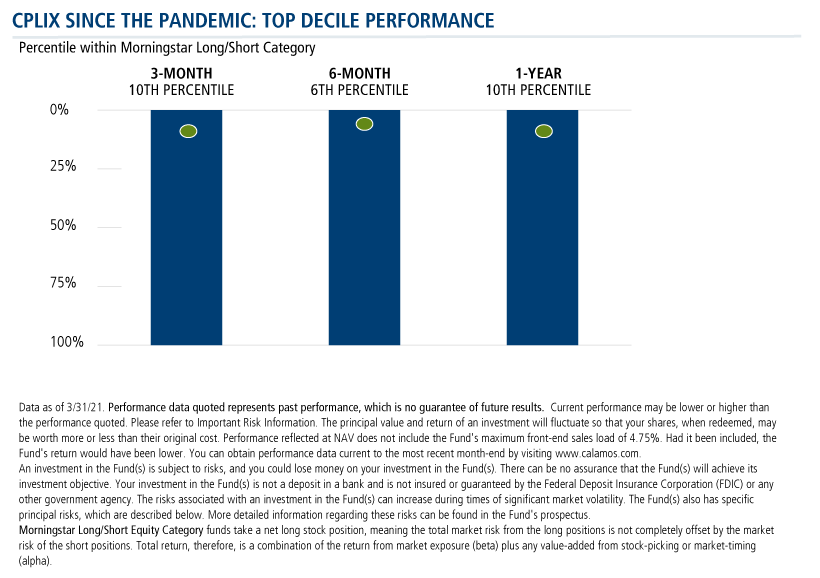
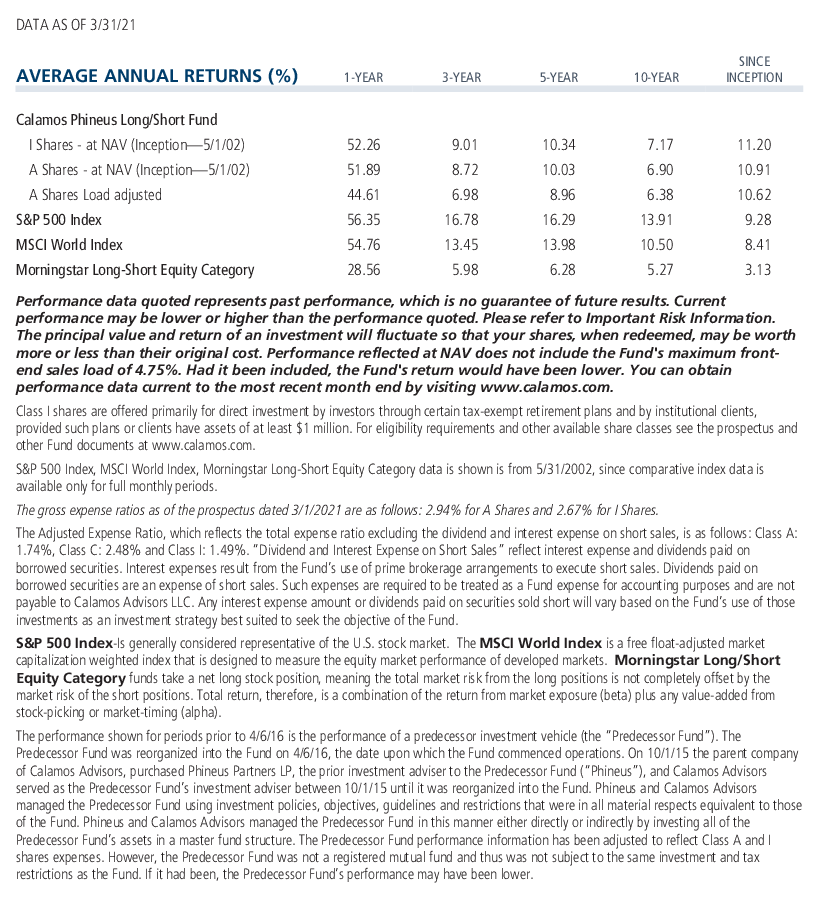
What did it take for Calamos Phineus Long/Short Fund (CPLIX) to return 12.49% in the first quarter—more than twice as much as the returns of the S&P 500, the MSCI World Index and the Morningstar Long-Short Category average?
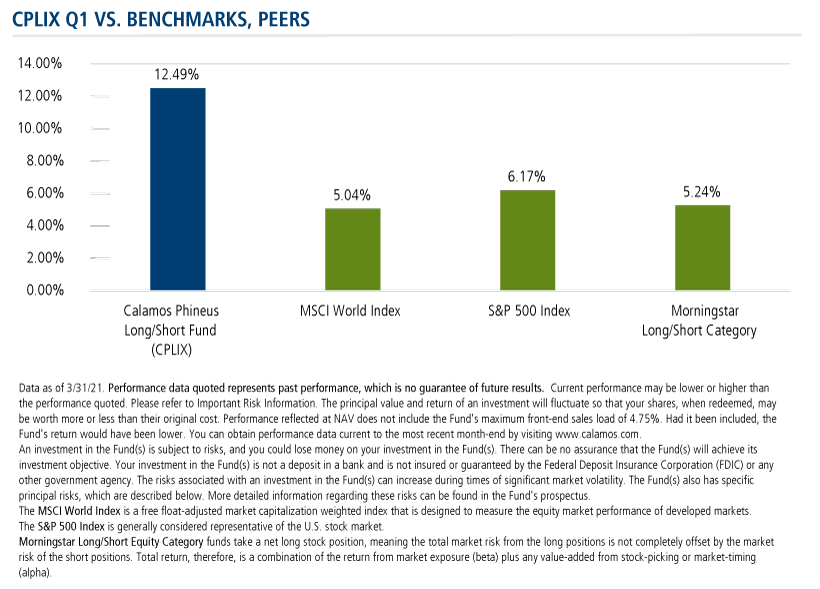
Below we’ll unpack the drivers of the fund’s most recent performance, a feat achieved with a delta-adjusted net exposure of approximately 56% over the period, which was far less than long-only alternatives that delivered less returns.
-
High absolute and relative exposure. Since he went on record March 25, 2020—near what would prove to be the market’s pandemic-related low point—CPLIX Senior Co-Portfolio Manager Michael Grant has been optimistic about equities. “For the first time in years, the math for equity investors makes sense…Investors stand to be paid to engage equity risk once again,” Grant said at the time (see post).
The team began increasing the portfolio exposure, and continued to maintain both high absolute and relative levels, averaging in the mid-50% level on a delta-adjusted basis, in the first quarter.

-
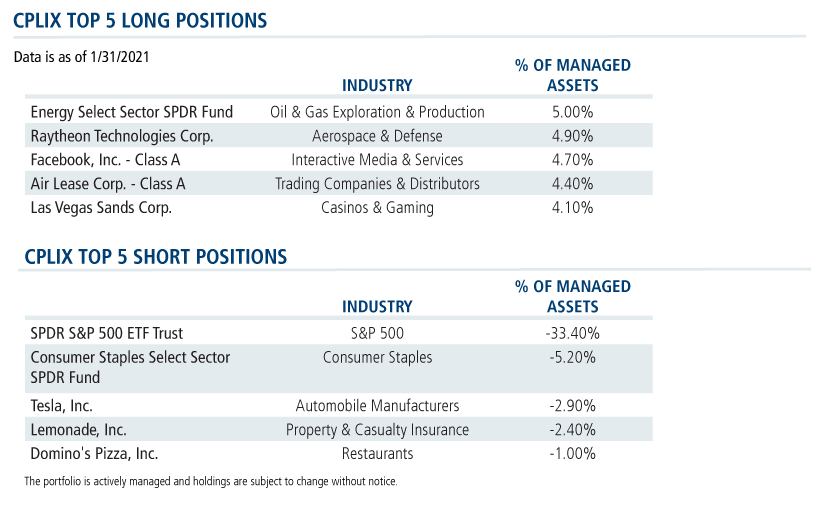
Positioning. Expecting that the markets’ ultimate recovery would not be as synchronized as its steep decline, Grant structured the portfolio in a “barbell format” to allow optimal participation in a relatively disjointed recovery. While he believed that sectors that were especially susceptible to the pandemic would recover, he expected defensive quality growth names would continue to perform well.
On one side of the barbell were quality growth and lower risk names (examples: Facebook and Alphabet), representing approximately one-third of the long portfolio as of 02/28/21. On the other side were more cyclical and recovery positions (examples: Air Lease Corp and Las Vegas Sands), representing about two-thirds of the portfolio as of 02/28/21.
The fund’s general market hedging, and shorting of “stay at home” stocks and “theme” holdings, is also reflected in its positioning and performance.
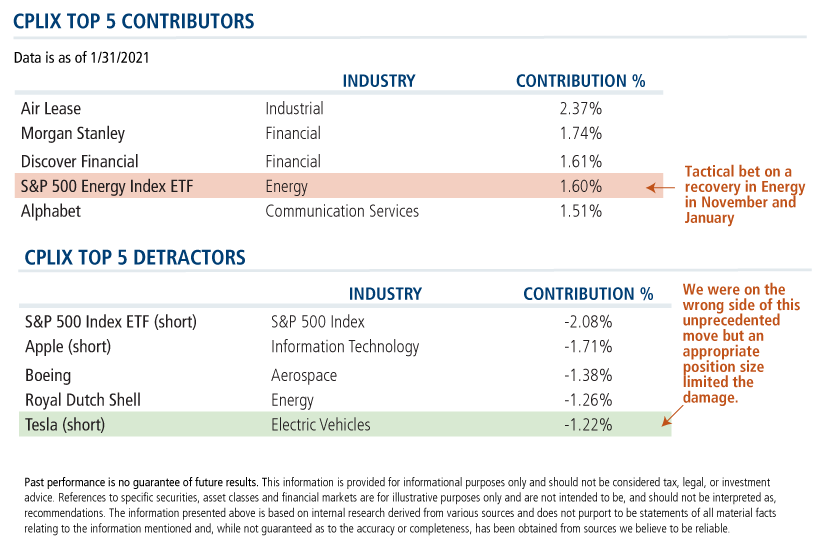
- Sector weightings. While value and cyclical-oriented sectors (e.g., Industrials, Financials and Energy) widely underperformed last year, they led S&P 500 performance in the first quarter. Each contributed double-digit returns for the period. Grant was resolute in his conviction that these sectors, the ultimate beneficiaries of the economic recovery from COVID-19, would be best poised to perform. The overweighting in these sectors proved beneficial, especially over the last six months.

-
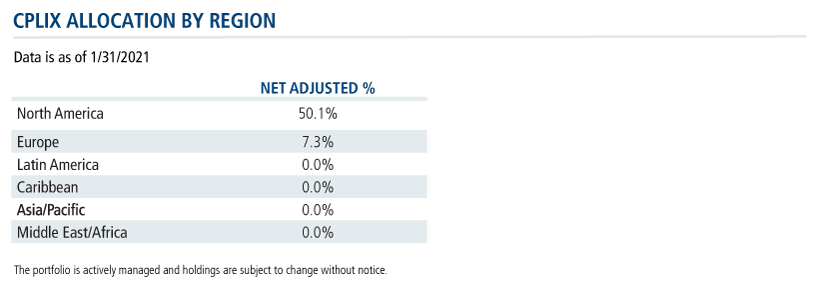
U.S.-centric focus. While emerging markets had a stellar performance in 2020, they have underperformed relative to the U.S. in the first quarter (S&P 500 6.17% vs. MSCI Emerging Markets Index 2.34%). Although Grant is keeping an open mind to the consensus that EM should perform well this year, he is not compelled at this time to meaningfully take on exposure.
Factors that typically drive EM returns, such as relatively lower U.S. bond yields and lower U.S. growth rates, are not factors at this point. In addition, the influence of both U.S. fiscal and monetary policy continue to propel domestic markets by offering low rates and plenty of liquidity. This should help U.S. equity markets. While the portfolio does have exposure to Europe, the primarily UK holdings in the region are based on expected benefits post-Brexit.
-
Conviction. The first quarter presents another illustration of Grant’s conviction. January brought concerns regarding the ability of the vaccine to be broadly distributed, thereby potentially slowing the process of the world returning to a greater sense of “normalization.” As a consequence, the market sold off in those sectors best positioned to benefit from an economic reopening. This negatively impacted the fund’s performance for the month.
However, in February as the outlook for vaccination brightened and the prospects of a reopening of the economy gained traction, those “recovery” sectors that CPLIX had overweighted more than made up for their January declines.
The Second Quarter and Beyond
Grant is unequivocal in his enthusiasm for U.S. equities, calling 2021 “one of the best backdrops for sustained equity upside” modern-day investors have seen.
Here’s how he frames the months ahead:
- For now, U.S. equities are enjoying cyclical resurgence amidst an unprecedented policy response. Into 2022, he thinks, “investors will gradually understand regime change: Pandemic dynamics mark the end of the deflationary era, as the most lasting impact of the pandemic is how it has resuscitated the role of Big Government.”
- The team anticipates a much stronger global economy later in 2021, but is skeptical that the non-U.S. equity world can outperform for now.
- The rotation to cyclical recovery has legs, as the latest leadership of the “normalization” and recovery cohorts is confirmed by rising bond yields and the outperformance of the cyclical earnings revisions.
- The team is not concerned about an equity market “bubble.” Investor positioning is stretched in the short term, but less concerning over the medium term.
Bond and Stock Market Measures
-
The team’s equity targets assume a U.S. 10-year yield of up to 2% (versus current levels of around 1.75%). This will be largely benign to equity markets, according to Grant, as long as yields are rising in anticipation of better economic activity.
The CPLIX base case S&P 500 price range is 4,000 to 4,400, with heightened risk beyond May. This backdrop could remain constructive in the second half of 2021, but the market will have priced in a full recovery.
Sectors
- The team maintains a pro-risk sector and style allocation, with tilts to Industrials, Financials and Value at the expense of Defensives and Growth.
- Grant looks for the consumer reopening trade to have another leg higher, and he favors Aerospace, Airlines, Hotels and Leisure and Transports.
- In Financials, the fund maintains exposure to higher quality U.S. names that benefit from easing credit concerns and a steeper yield curve.
- Within Industrials, the emphasis is on robust balance sheets that benefit from the resumption of more normal travel behavior.
- Tactical additions to Energy in the fourth quarter and again in January were premised on higher oil prices as the pandemic impact on travel eases.
- Commodity equities are currently in vogue, but may fade tactically through the second quarter. Underlying metal prices are already near records, with elevated speculative positioning.
- Technology fundamentals are supportive due to strong balance sheets, significant buybacks and structural tailwinds, but selectivity is imperative.
- Bottom line: The team is avoiding stocks that have largely been “valuation winners.” Equity multiples are peaking. Preference is being shown to stocks where the team expects material earning recovery in the context of a stronger global economy.
Regions
- The global story in 2021 is broadening economic momentum. Faith in vaccines is justified and thus, the acceleration of spending in the major economies, in the U.S. especially, will be exceptional, Grant believes.
- There is little fundamental risk for equities, but “this story is sequenced regionally,” and begins with the U.S., then Europe and then the rest of the world.
- Combined with the greater capacity of the U.S. to reflate its economic system, this implies the fund is still in the sweet spot of U.S. relative to non-U.S. equity performance.
- The team is not looking for U.S. dollar weakness. The relative strength of U.S. growth and higher bond yields are key differences with past cycles where dollar weakness was typical amidst a synchronized global recovery.
- Grant and team remain structurally bearish on China. The Chinese credit impulse may have peaked and argues that Chinese equities will underperform the recovery in much of the rest of the world, they believe.
- With the exception of the UK, “Europe remains consumed in a perpetual struggle for resources amidst economic stagnation fostered by its centralized bureaucracy,” says Grant.
- Bottom line: The team has maintained a bias to U.S. versus non-U.S. equities for years. This continues as the U.S. has the greatest capacity to reflate its economic system, in Grant’s view.
Investment professionals, for more information about CPLIX, contact your Calamos Investment Consultant at 888-571-2567 or caminfo@calamos.com.
Before investing, carefully consider the fund’s investment objectives, risks, charges and expenses. Please see the prospectus and summary prospectus containing this and other information which can be obtained by calling 1-866-363-9219. Read it carefully before investing.
Opinions and estimates offered constitute our judgment and are subject to change without notice, as are statements of financial market trends, which are based on current market conditions. We believe information provided here is reliable, but do not warrant its accuracy or completeness. The material is not intended as an offer or solicitation for the purchase of any financial instrument. The views and strategies described may not be suitable for all investors. This material has been prepared for informational purposes only and is not intended to provide—and should not be relied on for—accounting, legal or tax advice. References to future returns are not promises or even estimates of actual returns a client may achieve. Any forecasts contained herein are for illustrative purposes only and are not to be relied upon as advice or interpreted as a recommendation. The securities highlighted are discussed for illustrative purposes only. They are not recommendations.
Important Risk Information. An investment in the Fund(s) is subject to risks, and you could lose money on your investment in the Fund(s). There can be no assurance that the Fund(s) will achieve its investment objective. Your investment in the Fund(s) is not a deposit in a bank and is not insured or guaranteed by the Federal Deposit Insurance Corporation (FDIC) or any other government agency. The risks associated with an investment in the Fund(s) can increase during times of significant market volatility. The Fund(s) also has specific principal risks, which are described below. More detailed information regarding these risks can be found in the Fund's prospectus.
The principal risks of investing in the Calamos Phineus Long/Short Fund include: equity securities risk consisting of market prices declining in general, short sale risk consisting of potential for unlimited losses, foreign securities risk, currency risk, geographic concentration risk, other investment companies (including ETFs) risk, derivatives risk, options risk, and leverage risk. As a result of political or economic instability in foreign countries, there can be special risks associated with investing in foreign securities, including fluctuations in currency exchange rates, increased price volatility and difficulty obtaining information. In addition, emerging markets may present additional risk due to potential for greater economic and political instability in less developed countries.
The MSCI World Index is a free float-adjusted market capitalization weighted index that is designed to measure the equity market performance of developed markets.
The S&P 500 Index is generally considered representative of the U.S. stock market.
The MSCI Emerging Markets Index is a free float-adjusted market capitalization index that is designed to measure equity market performance of emerging markets. The index is calculated on a total return basis, which includes reinvestment of gross dividends before deduction of withholding taxes.
Morningstar Long/Short Equity Category funds take a net long stock position, meaning the total market risk from the long positions is not completely offset by the market risk of the short positions. Total return, therefore, is a combination of the return from market exposure (beta) plus any value-added from stock-picking or market-timing (alpha).
Morningstar Ratings™ are based on risk-adjusted returns and are through 3/31/21 for Class I shares and will differ for other share classes. Morningstar ratings are based on a risk-adjusted return measure that accounts for variation in a fund’s monthly historical performance (reflecting sales charges), placing more emphasis on downward variations and rewarding consistent performance. Within each asset class, the top 10%, the next 22.5%, 35%, 22.5%, and the bottom 10% receive 5, 4, 3, 2 or 1 star, respectively. Each fund is rated exclusively against U.S. domiciled funds. The information contained herein is proprietary to Morningstar and/or its content providers; may not be copied or distributed; and is not warranted to be accurate, complete or timely. Neither Morningstar nor its content providers are responsible for any damages or losses arising from any use of this information. Source: ©2021 Morningstar, Inc.
802356 421
Archived material may contain dated performance, risk and other information. Current performance may be lower or higher than the performance quoted in the archived material. For the most recent month-end fund performance information visit www.calamos.com. Archived material may contain dated opinions and estimates based on our judgment and are subject to change without notice, as are statements of financial market trends, which are based on current market conditions at the time of publishing. We believed the information provided here was reliable, but do not warrant its accuracy or completeness. This material is not intended as an offer or solicitation for the purchase or sale of any financial instrument. The views and strategies described may not be suitable for all investors. This material has been prepared for informational purposes only, and is not intended to provide, and should not be relied on for, accounting, legal or tax advice. References to future returns are not promises or even estimates of actual returns a client portfolio may achieve. Any forecasts contained herein are for illustrative purposes only and are not to be relied upon as advice or interpreted as a recommendation.
Performance data quoted represents past performance, which is no guarantee of future results. Current performance may be lower or higher than the performance quoted. The principal value and return of an investment will fluctuate so that your shares, when redeemed, may be worth more or less than their original cost. Performance reflected at NAV does not include the Fund’s maximum front-end sales load. Had it been included, the Fund’s return would have been lower.
Archived on April 12, 2022Cookies
This website uses cookies. By continuing to use this website, you consent to the use of cookies. Learn more about our cookie usage.

