Raising the Bar on Equity Alts: Did They Protect in the Swoon—But Also Participate in the Snapback?
April 20, 2020
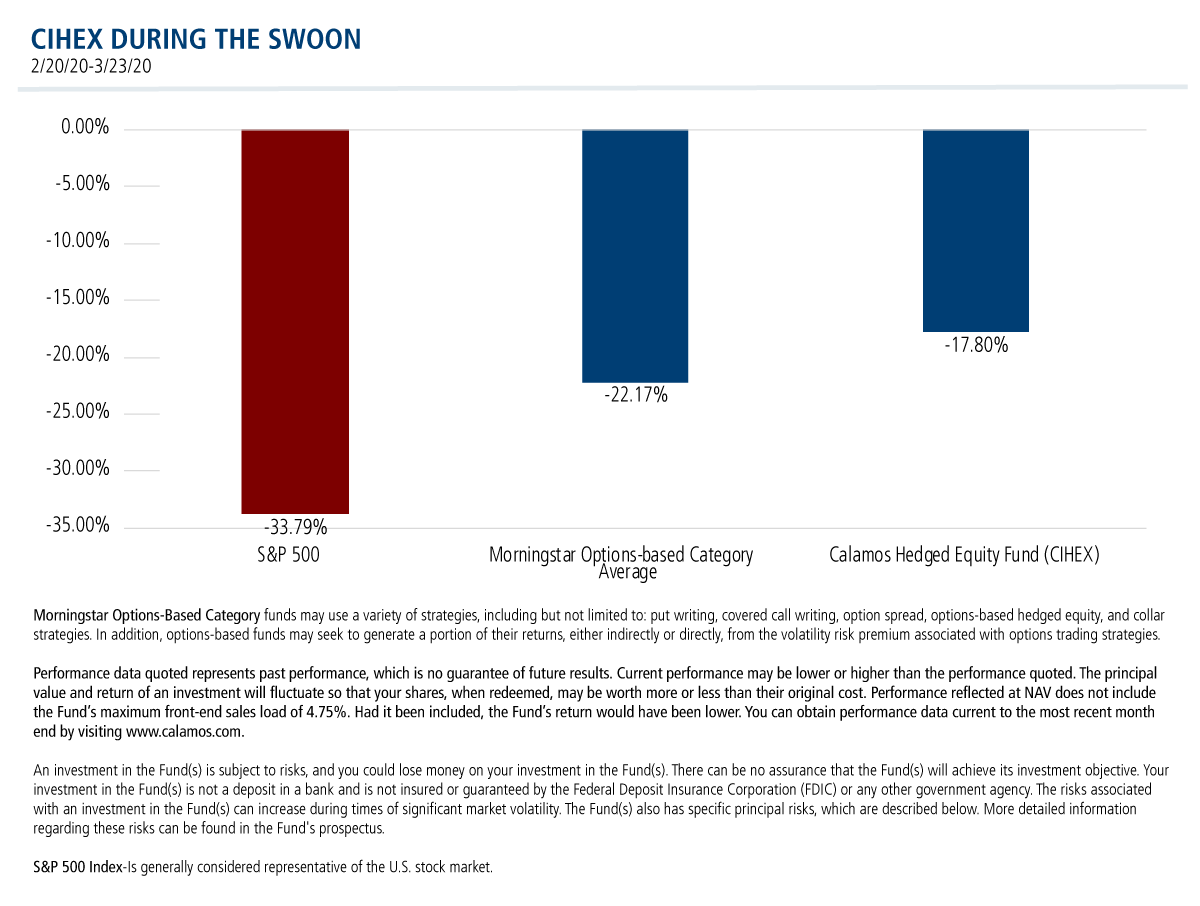
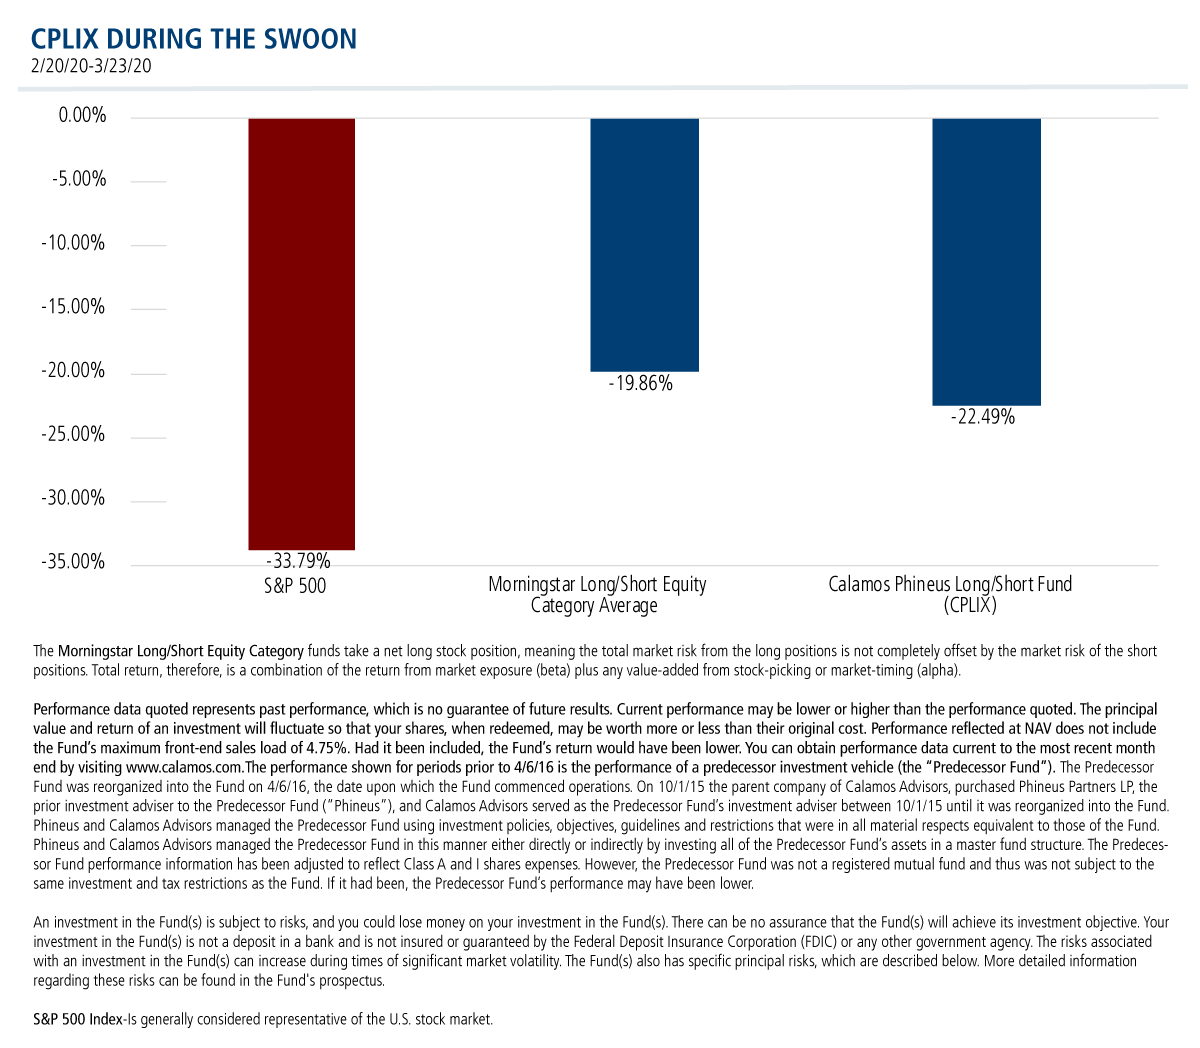
The majority of liquid alternatives were established in response to the Great Financial Crisis of 2008-2009, as a means of providing some protection against equity market declines. This most recent drawdown—the S&P 500’s plunge to -33.79% at its deepest on March 23—has been the most serious test yet of whether liquid alts perform as promised.
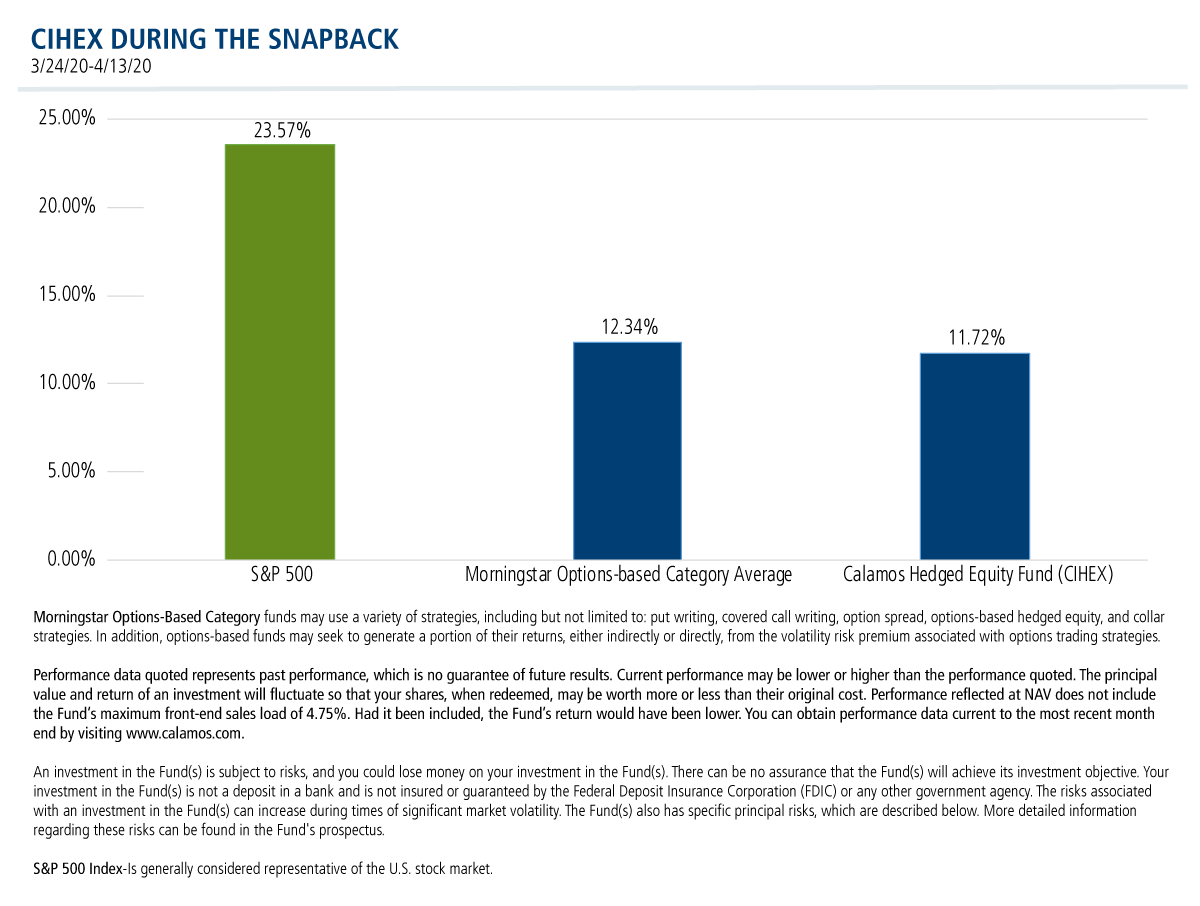
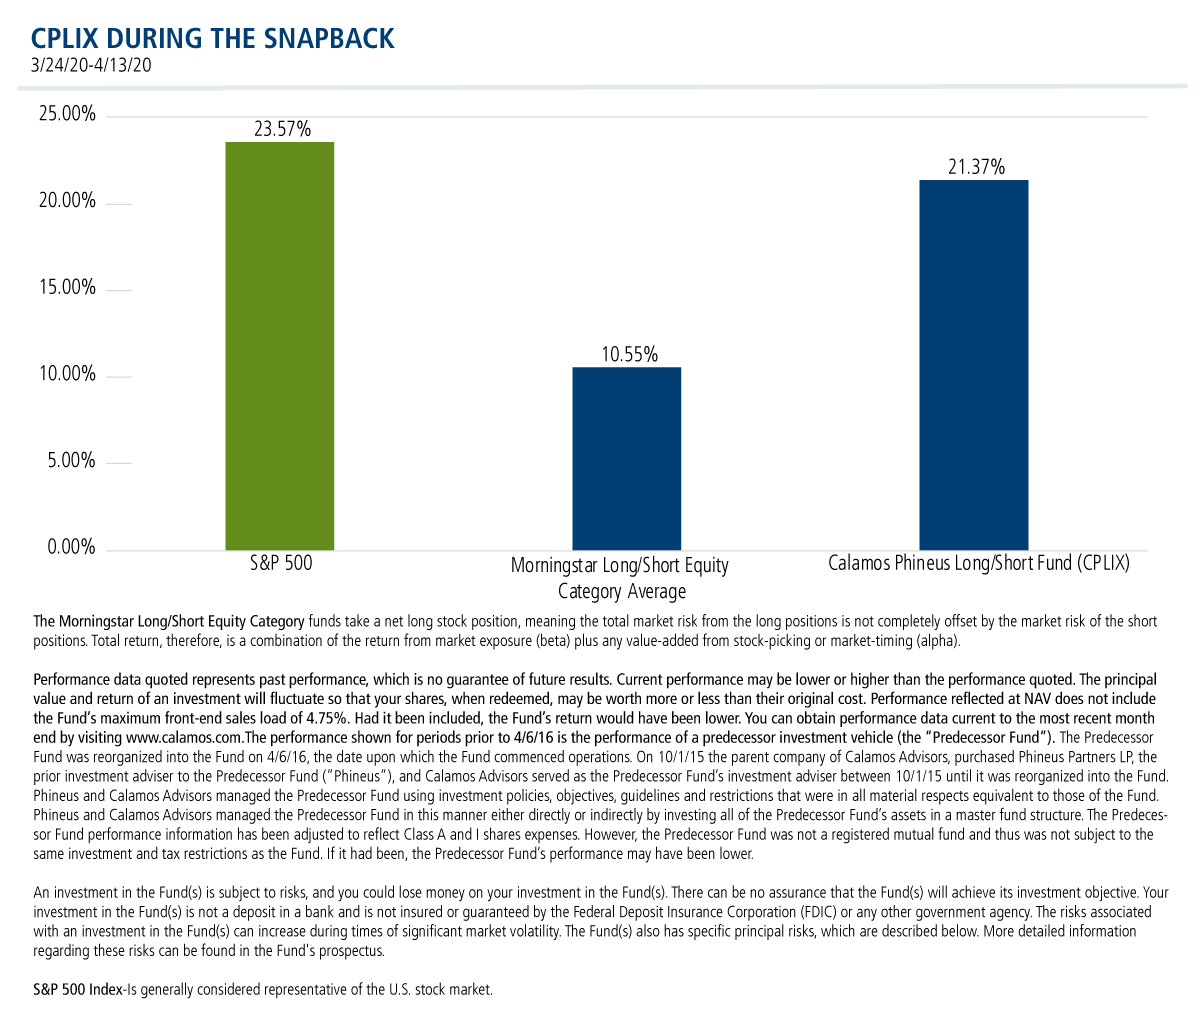
An article last week in Citywire, the publication for professional fund buyers, raises the bar by putting a spotlight on not just the alts’ performance in the “swoon” but also their participation in the snapback. Citywire considered the snapback period beginning March 24 and running through April 13, the cutoff date for the publication's analysis.
As a high level conclusion, “the liquid alts categories held up better,” according to Citywire. One exception noted: “lackluster” performance by the Nontraditional Bonds category during both swoon and snapback. Nontraditional bonds is the largest alts category (see Liquid Alternatives: 2019 in Review).
“Overall, the funds beat the S&P 500 for the entire swoon-and-snapback periods, though, of course, the snapback may not be over yet. All the categories we examined outpaced the S&P 500’s nearly 19% loss. None lost more than 11.9%.”
How Calamos Alternatives Worked
Calamos’ alternatives work, as we like to say. So, we took the challenge and measured our equity alts Calamos Hedged Equity Fund (CIHEX) and Calamos Phineus Long/Short Fund (CPLIX) against the Citywire standards and using the same dates for the snapback period. In fact, as short as the time periods are, they help illustrate the differences in what to expect from the two funds.
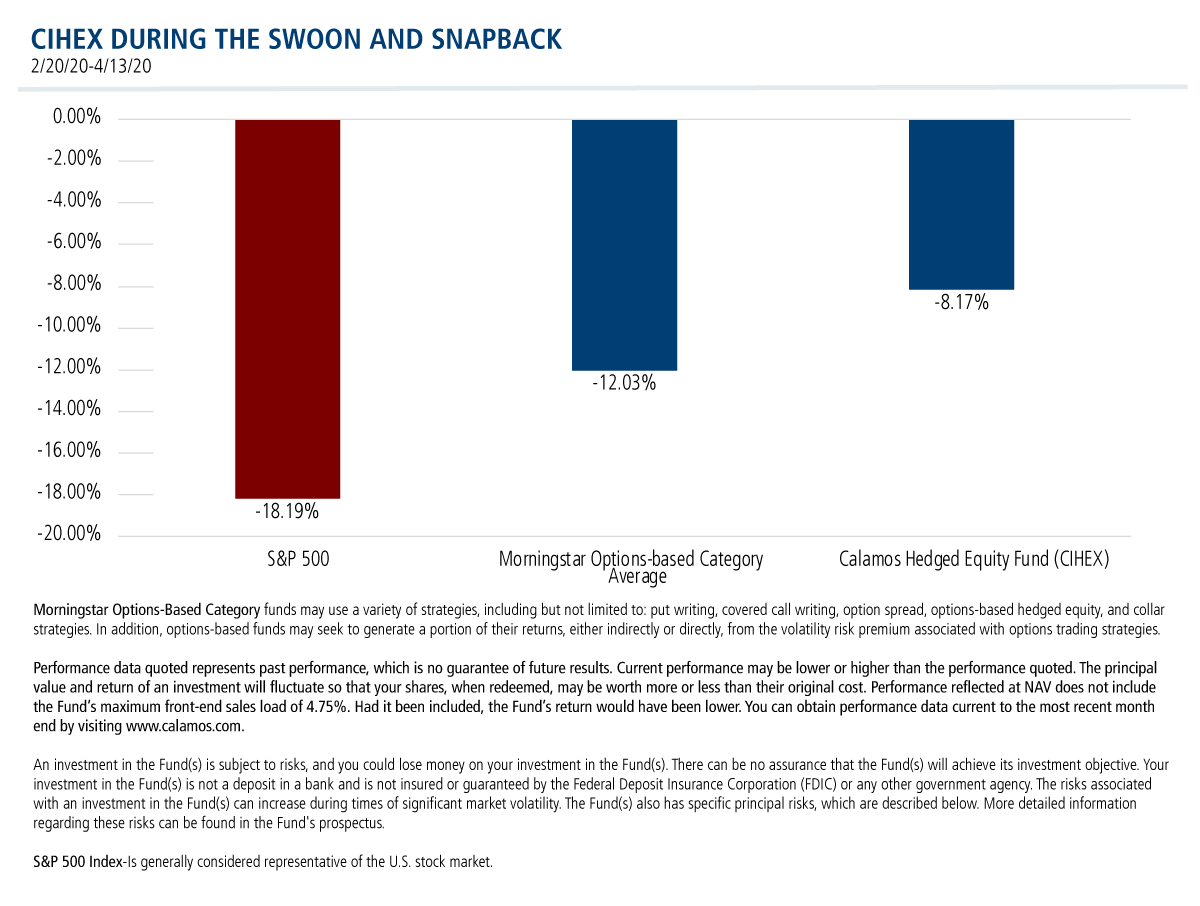
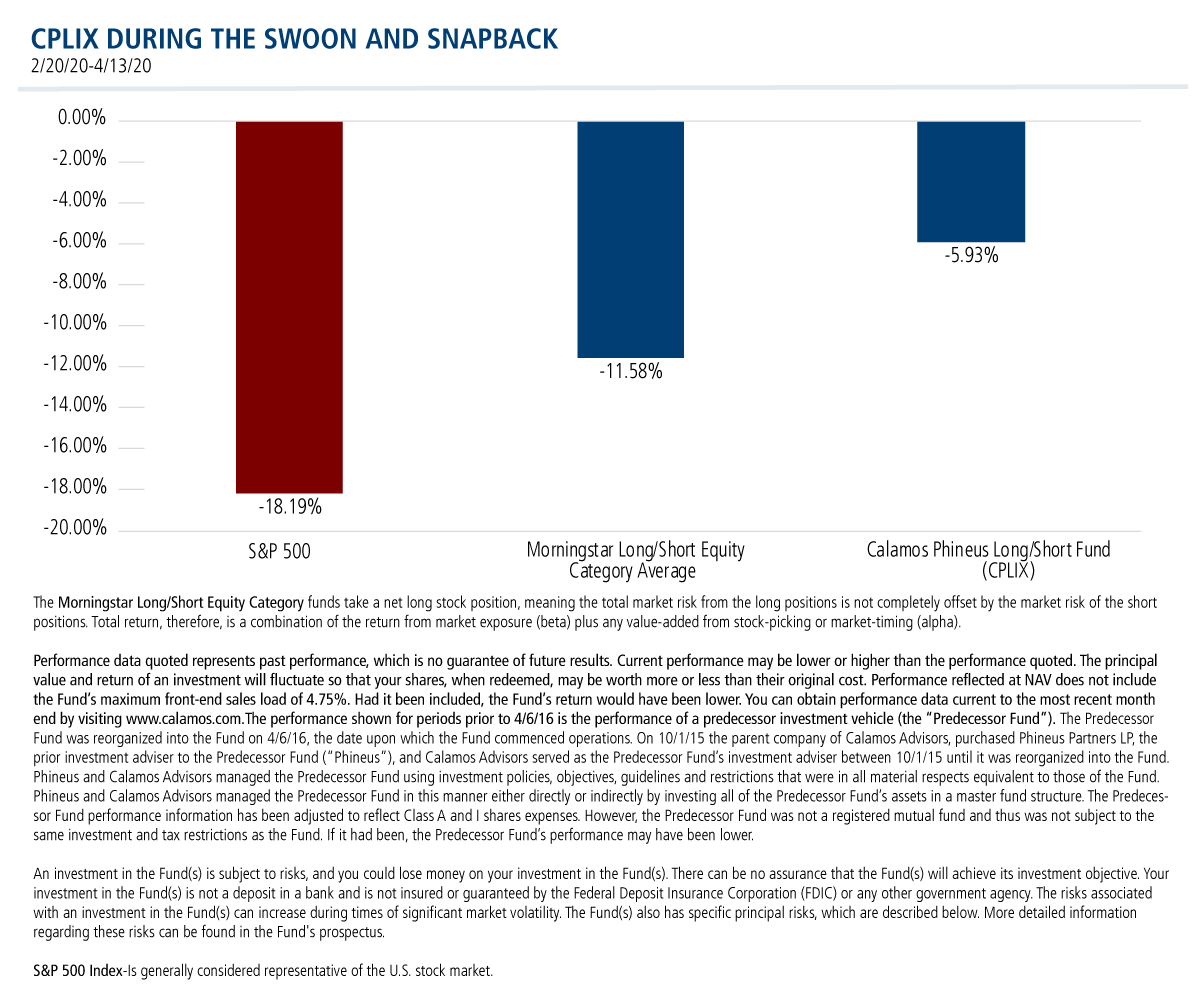
Performance in the drawdown? See below (also see this post and this post for different looks at Calamos funds’ historical outperformance). CIHEX took part in about half the S&P drawdown and outperformed its peers by more than 400 basis points. CPLIX minimized the downside but underperformed its category peers.
Performance in the snapback? CIHEX slightly underperformed its category average. See how CPLIX comes close to the S&P gain, more than doubling the snapback of its long/short peers.
Finally, here are the alts' performance during the combined swoon/snapback period. While significantly mitigating the drawdown and taking part in the snapback, CIHEX outperformed its peers by more than 400 basis points. The combination of CPLIX downside mitigation and strong rebound produced a return that was twice as good as the Long/Short category average. The Calamos alts worked as designed.
Citywire also considered alts’ performance during the most recent bout of volatility in late 2018. For our full report, see Why Our Alternatives Worked in 2018.
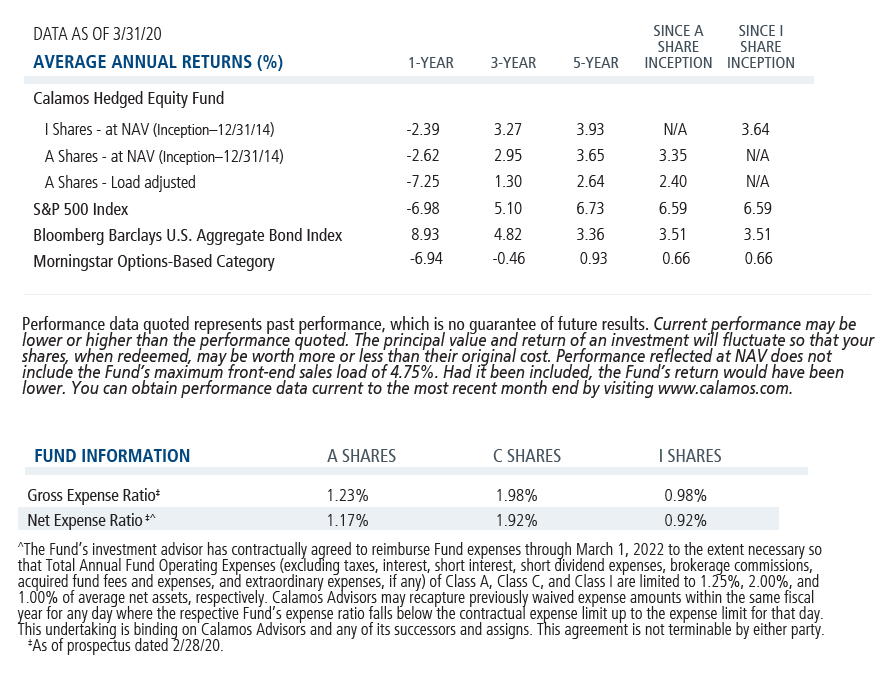
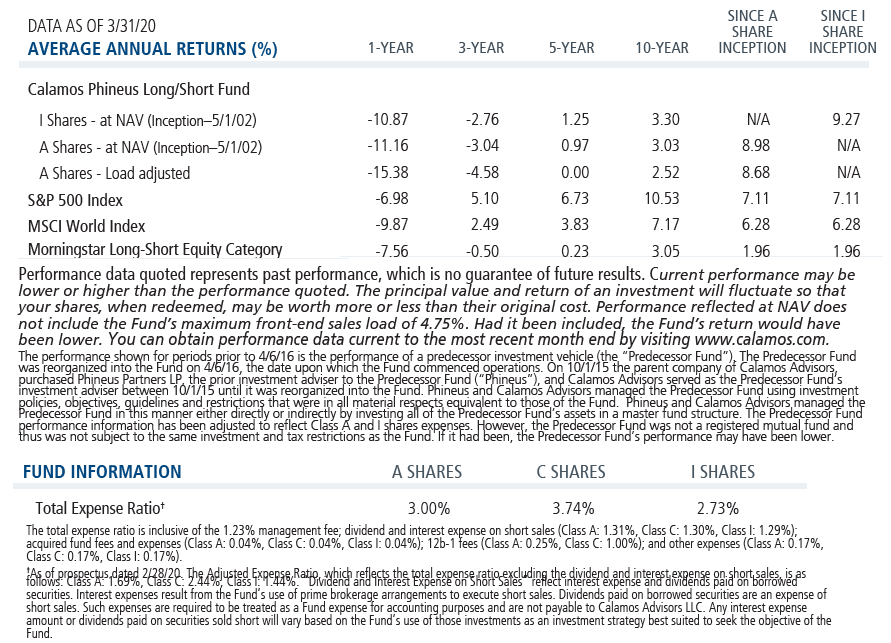
The publication is unimpressed by the alts’ categories longer term (five-year) returns. “None of them have mustered more than a 1% return, and two categories [Managed futures and Multialternative] have posted modest losses,” they write. As you can see in the standardized performance tables below, CIHEX and CPLIX five-year returns both exceed the admittedly low 1% bar.
The analysis closes with the comment that alts’ “saving grace has been their lower volatility over that longer period. While the S&P 500 had 13.7% standard deviation of returns, no liquid alts category had more than 10.3%, and half the categories we examined had 6.2% or less.”
This prompts us to make another point about our funds. While CIHEX five-year standard deviation is 6.64%, investment professionals will note that the CPLIX five-year standard deviation is higher—9.66%.
“This can come up in the due diligence of the fund,” confirms Elise Pondel, CFA, Calamos Product Manager, Strategic Product Management & Analytics. “Remember that standard deviation is a measure of total volatility which includes both upside and downside deviation. CPLIX tends to have periods of large positive returns that increase its standard deviation. Focusing on metrics such as the Sortino ratio, which is a measure of risk-adjusted returns using downside deviation, may be a more useful measure.”
Investment professionals, for more information about our liquid alts, talk to your Calamos Investment Consultant at 888-571-2567 or caminfo@calamos.com. Calamos is the largest alternatives provider as of 3/31/20 based on Morningstar AUM data.
Before investing, carefully consider the fund’s investment objectives, risks, charges and expenses. Please see the prospectus and summary prospectus containing this and other information which can be obtained by calling 1-866-363-9219. Read it carefully before investing.
An investment in the Fund(s) is subject to risks, and you could lose money on your investment in the Fund(s). There can be no assurance that the Fund(s) will achieve its investment objective. Your investment in the Fund(s) is not a deposit in a bank and is not insured or guaranteed by the Federal Deposit Insurance Corporation (FDIC) or any other government agency. The risks associated with an investment in the Fund(s) can increase during times of significant market volatility. The Fund(s) also has specific principal risks, which are described below. More detailed information regarding these risks can be found in the Fund's prospectus.
The principal risks of investing in the Calamos Hedged Equity Fund include: covered call writing risk, options risk, equity securities risk, correlation risk, mid-sized company risk, interest rate risk, credit risk, liquidity risk, portfolio turnover risk, portfolio selection risk, foreign securities risk, American depository receipts, and REITs risks.
Options Risk - The Fund's ability to close out its position as a purchaser or seller of an over-the-counter or exchange-listed put or call option is dependent, in part, upon the liquidity of the option market. There are significant differences between the securities and options markets that could result in an imperfect correlation among these markets, causing a given transaction not to achieve its objectives. The Fund's ability to utilize options successfully will depend on the ability of the Fund's investment adviser to predict pertinent market movements, which cannot be assured.
The principal risks of investing in the Calamos Phineus Long/Short Fund include: equity securities risk consisting of market prices declining in general, short sale risk consisting of potential for unlimited losses, foreign securities risk, currency risk, geographic concentration risk, other investment companies (including ETFs) risk, derivatives risk, options risk, and leverage risk. As a result of political or economic instability in foreign countries, there can be special risks associated with investing in foreign securities, including fluctuations in currency exchange rates, increased price volatility and difficulty obtaining information. In addition, emerging markets may present additional risk due to potential for greater economic and political instability in less developed countries.
Standard deviation is a measure of volatility.
Sortino ratio is the excess return over the risk-free rate divided by the downside semi-variance, and so it measures the return to "bad" volatility. (Volatility caused by negative returns is considered bad or undesirable by an investor, while volatility caused by positive returns is good or acceptable.)
Downside deviation measures only deviations below a specified benchmark.
S&P 500 Index-Is generally considered representative of the U.S. stock market.
The Morningstar Long/Short Equity Category funds take a net long stock position, meaning the total market risk from the long positions is not completely offset by the market risk of the short positions. Total return, therefore, is a combination of the return from market exposure (beta) plus any value-added from stock-picking or market-timing (alpha).
Morningstar Options-Based Category funds may use a variety of strategies, including but not limited to: put writing, covered call writing, option spread, options-based hedged equity, and collar strategies. In addition, options-based funds may seek to generate a portion of their returns, either indirectly or directly, from the volatility risk premium associated with options trading strategies.
801999 420
Archived material may contain dated performance, risk and other information. Current performance may be lower or higher than the performance quoted in the archived material. For the most recent month-end fund performance information visit www.calamos.com. Archived material may contain dated opinions and estimates based on our judgment and are subject to change without notice, as are statements of financial market trends, which are based on current market conditions at the time of publishing. We believed the information provided here was reliable, but do not warrant its accuracy or completeness. This material is not intended as an offer or solicitation for the purchase or sale of any financial instrument. The views and strategies described may not be suitable for all investors. This material has been prepared for informational purposes only, and is not intended to provide, and should not be relied on for, accounting, legal or tax advice. References to future returns are not promises or even estimates of actual returns a client portfolio may achieve. Any forecasts contained herein are for illustrative purposes only and are not to be relied upon as advice or interpreted as a recommendation.
Performance data quoted represents past performance, which is no guarantee of future results. Current performance may be lower or higher than the performance quoted. The principal value and return of an investment will fluctuate so that your shares, when redeemed, may be worth more or less than their original cost. Performance reflected at NAV does not include the Fund’s maximum front-end sales load. Had it been included, the Fund’s return would have been lower.
Archived on April 19, 2021