 Investment Team Voices Home Page
Calamos CEFs: Unusual Dynamics Signal Rare Opportunities for Income-oriented Investors
By Robert F. Bush, Jr., SVP, Director of Closed-End Products
September 17, 2020
As investors face a challenging search for income in a low interest rate environment, Calamos closed-end funds provide a time-tested approach, with distribution histories and current distribution levels that make them a compelling choice for income-oriented investors. Additionally, at current market prices, the Calamos closed-end funds offer an attractive opportunity for long-term investors. The funds are advantageously positioned for a potential narrowing of discounts, supported by dynamic allocation across asset classes, including convertible securities, a core capability of the firm.
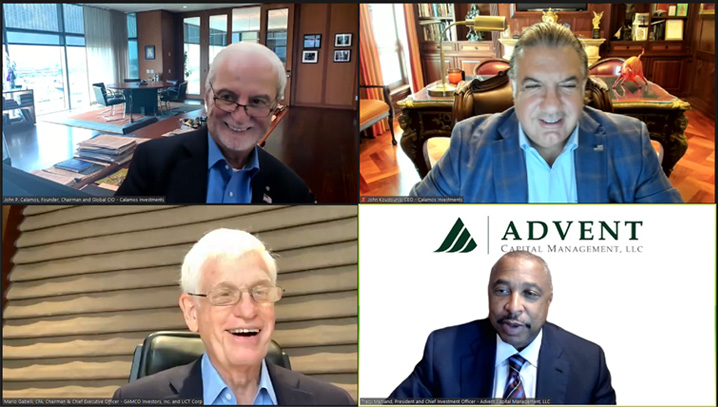
On September 10, 2020, Capital Link hosted a lively panel discussion that brought together preeminent innovators in the closed-end industry to share a wealth of insights. Moderated by Calamos Chief Executive Officer John Koudounis, “Industry Leaders on Challenges & Opportunities” featured John P. Calamos, Sr., Founder, Chairman and Global Chief Investment Officer of Calamos Investments; Mario Gabelli, CFA, Chairman and Chief Executive Officer of GAMCO Investors and LICT Corp., and Tracy Maitland, President and Chief Investment Officer of Advent Capital Management, LLC. The group discussed current trends and dynamics in the closed-end fund (CEF) market. They agreed that unusual market conditions in the closed-end space created an especially attractive window of opportunity for long-term investors.
For example, John Calamos observed that in spite of the recoveries in financial markets since the Q1 selloff, many closed-end funds have continued to trade at wider-than-usual discounts. Fueled largely by rallying financial markets and inexpensive leverage, the NAV performances of CEFs have, in most cases, outperformed those of related indexes, but price returns have markedly lagged their corresponding NAVs, thereby creating the disparity.
While most discounts are typically related to waning investor interest in the stock due to lackluster NAV performance, distribution cuts, or large components of return of capital as a source of distributions, John Calamos believes another dynamic may be at work. More specifically, discounts in the current environment appear attributable to the inability of prices to keep up with sharp NAV accretion. Contributing to this dynamic is investor anxiety about having exposure to the CEF secondary market given its Q1 selloff, especially as several funds cut distributions earlier this year in the wake of asset declines and deleveraging.
These concerns are not without merit, but given the performance of many underlying portfolios, compelling valuations in closed-end funds currently exist, both on an absolute and relative basis. Accordingly, Calamos believes investors should give serious consideration to building or increasing exposure to closed-end funds at discounts—as prices are likely to eventually converge to more typical historical relationships relative to NAVs.
The Case for Calamos Closed-End Funds
Building on the insights shared at the Capital Link panel discussion, we believe the case for Calamos closed-end funds is especially attractive in the current environment.
- The funds are advantageously positioned for a potential narrowing of discounts, supported by dynamic allocation across asset classes, including convertible securities, a core capability of the firm.
- The funds’ historical and current distributions, managed and level distribution policies, and judicious use of leverage provide a compelling choice for income-oriented investors.
Opportunity in actively managed convertible securities. In spite of the extreme volatility caused by the pandemic and economic shutdowns in Q1 2020, financial markets have generally offered positive returns in both equity and fixed income investments. While equities have generally outperformed fixed income securities year-to-date through August, convertibles have notably been the top performers through the period. Global convertibles have offered nearly twice the returns of global equities, and U.S. convertibles have nearly tripled the returns of U.S. stocks.
This is potentially advantageous for the Calamos closed-end funds, all of which typically have meaningful exposure to convertible securities. Our active approach draws upon decades of experience going back to the 1970s when John Calamos developed pioneering strategies using convertibles. Each fund’s allocation differs depending upon the product mandate and our team’s view of opportunity. As of August 31, 2020, the funds’ allocations to convertibles ranged between 20% of assets for CSQ to 87% for CCD. (Here and throughout the remainder of this article, we will consider those Calamos closed-end funds that have typically included significant allocations to convertibles over time.)
Figure 1. Calamos CEFs: Dynamic Allocation to Convertible Securities
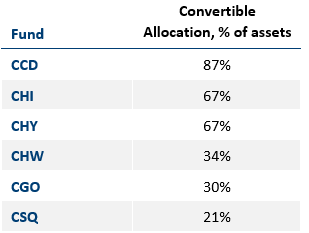
Data as of 8/31/2020. The funds are actively managed. Portfolio holdings subject to change.
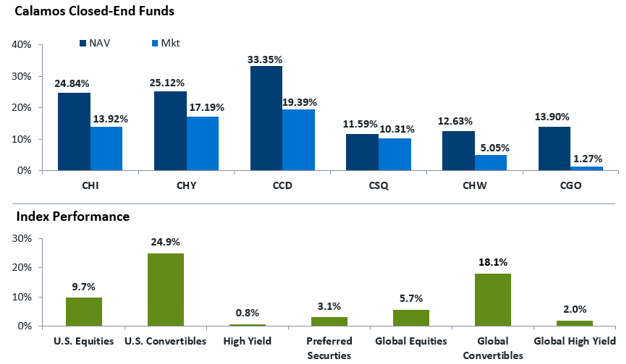
The allocation in our CEFs to convertibles clearly contributed to their overall outperformance on NAV, relative to either individual or blended indexes, where applicable. Additionally, we believe the funds may benefit as their market prices eventually reflect a recognition of value in convertibles and other risk assets.
Figure 2. Year-to-Date Performance Review
Data as of 8/31/2020
Data as of 8/31/2020
Performance data quoted represents past performance, which is no guarantee of future results. Current performance may be lower or higher than the performance quoted. The principal value of an investment will fluctuate so that your shares, when sold, may be worth more or less than their original cost. You can purchase or sell common shares daily. Like any other stock, market price will fluctuate with the market. Upon sale, your shares may have a market price that is above or below net asset value and may be worth more or less than your original investment. Shares of closed-end funds frequently trade at a discount which is a market price that is below their net asset value.
There are differences between the funds and the indexes. Indexes are unmanaged, do not include fees or expenses and are not available for direct investment. Index performance represented by: S&P 500 (U.S. equities), ICE BofA All Convertibles Index (U.S. convertible securities), ICE BofA High Yield Index II (U.S. high yield securities), ICE BofA US All Capital Securities Index (preferred securities), MSCI World (global equities from developed markets), Refinitiv Global Convertible Bond (global convertibles) and ICE BofA Global HY Index (global high yield securities).
Calamos CEFs: Innovative Approaches for the Search for Income. As John Calamos noted in his recent paper, “Addressing the Search for Income and Growth: The Opportunity of Calamos Closed-End Funds,” “for investors seeking income, we understand that a predictable level of cash is a key priority.” The Calamos closed-end funds are managed to provide consistent distributions for income-oriented investors, through changing market environments.
As an increasing of number of retirees seek income sources in a historically low interest rate environment, the funds seek to provide high levels of monthly cash flow. The funds can employ inexpensive leverage to earn a positive spread on investment, supporting distributions through income and capital gains. These investment features position the product well for inherent investor demand.
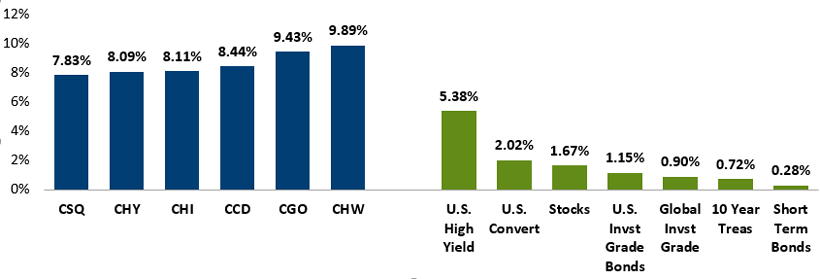
In Figures 3 and 4, we illustrate the results for our funds with longer-term histories (those of more than one year). As shown in Figure 3, the funds’ current annualized distribution rates are competitive in a global environment of low rates. Figure 4 shows cumulative distributions since each fund’s inception.
Figure 3. Competitive Distributions, Designed to Address the Search for Income
Current annualized distribution rates (funds) versus yields of market benchmarks, as of August 31, 2020
Current annualized distribution rates (funds) versus yields of market benchmarks, as of August 31, 2020
Performance data quoted represents past performance, which is no guarantee of future results. Current performance may be lower or higher than the performance quoted. The principal value of an investment will fluctuate so that your shares, when sold, may be worth more or less than their original cost. You can purchase or sell common shares daily. Like any other stock, market price will fluctuate with the market. Upon sale, your shares may have a market price that is above or below net asset value and may be worth more or less than your original investment. Shares of closed-end funds frequently trade at a discount which is a market price that is below their net asset value.
Current Annualized Distribution Rate is the Fund’s most recent distribution, expressed as an annualized percentage of the Fund’s current market price per share. Information regarding the Fund’s most recent distribution can be found in the table titled “Distribution Details,” which appears below. Estimates are calculated on a tax basis rather than on a generally accepted accounting principles (GAAP) basis, but should not be used for tax reporting purposes. Distributions are subject to re-characterization for tax purposes after the end of the fiscal year. This information is not legal or tax advice. Consult a professional regarding your specific legal or tax matters. Under the level rate distribution policy of CGO and CHW and the managed rate distribution policy of CHI, CHY, CSQ, and CCD, the distributions paid to common shareholders may include net investment income, net realized short-term capital gains and return of capital. When the net investment income and net realized short-term capital gains are not sufficient, a portion of the level rate distribution will be a return of capital. In addition, a limited number of distributions per calendar year may include net realized long-term capital gains. Distribution rate may vary.
Dividend yield is shown for stocks, yield to worst for remaining indexes. There are material differences between the indexes and the Calamos closed-end funds. Indexes are unmanaged, do not include fees and expenses and are not available for direct investments. Stocks are represented by the S&P 500 Index; U.S. investment grade bonds are represented by the Bloomberg Barclays U.S. Aggregate Bond Index; global investment grade bonds are represented by the Bloomberg Barclays Global Aggregate Index; short term bonds are represented by Bloomberg Barclays U.S. Govt/Credit 1-3 Year Index and high yield bonds are represented by the ICE BofA U.S. High Yield Index. Source for data: Bloomberg and the U.S. Department of the Treasury.
Figure 4. Calamos CEFs: Helping Investors Meet Cash Flow Needs in Challenging Markets
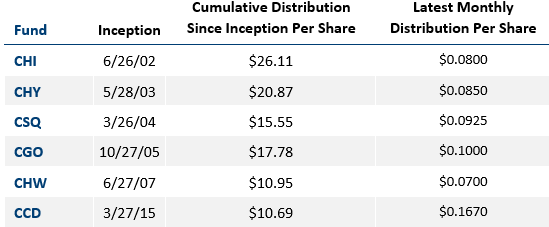
Past performance is no guarantee of future results. The Cumulative Distribution is a sum of all monthly ordinary income, capital gains, and return of capital distributions since the Fund’s inception. Includes all distributions payable through 9/18/20. Latest distribution date was payable 9/18/20, please see the end notes for additional information.
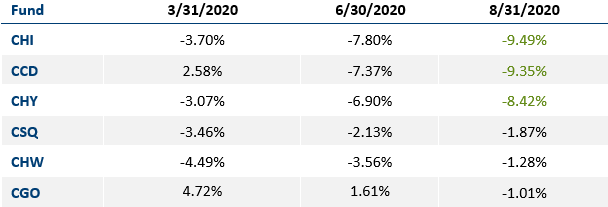
Compelling Absolute and Relative Valuations of Calamos Closed-End Funds. As the financial markets dropped precipitously due to the onset of Covid-19’s economic impact, many closed-end funds suffered sharp selloffs in mid-February, which resulted in discounts exceeding the 20% level, far above their respective historical averages. However, by the end of Q1, many had returned to levels that were far more modest and more representative of a normalized price/NAV relationship.
While financial markets continued to recover during Q2, and into Q3, the price relationship of our global and equity funds (CSQ, CGO and CHW) traded at levels in proximity to their respective NAVs, finishing the month of August at discounts all less than 2%. In comparison, in spite of convertible markets vastly outperforming equity and fixed income markets year-to-date through August 2020, our convertible-oriented CEFs (CHI, CHY and CCD) experienced widening discounts since the end of Q1.
Figure 5. Select Premium and Discounts in 2020
Ranked by widest discount on 8/31/20
Ranked by widest discount on 8/31/20
Past performance is no guarantee of future results.
Fundamentals and issuance in the convertible bond market remain strong, with approximately $114 billion of new securities coming to market globally year-to-date through August. In addition, the BofA All U.S. Convertible Index returned nearly 25% year-to-date through August. Our sense is that as a result of the abrupt Q1 CEF selloff, a downturn precipitated by deleveraging and distribution cuts, investors remain cautious about CEFs today. Profit taking by investors who entered the market in February and March may be contributing to selling pressure. The fact that the prices of our convertible CEFs have not kept up with their soaring NAV valuations has resulted in unusually large discounts that offer good price values on an absolute and relative basis.
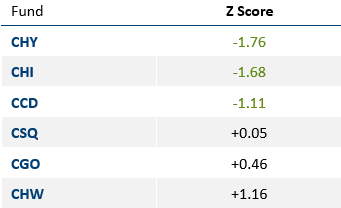
Z Scores. The Z Score is a relative valuation assessment of a CEF that measures the current price/NAV relationship relative to its historical relationship. (The calculation subtracts a fund’s mean premium or discount for a period from the current premium or discount, and divides the result by the standard deviation of the premiums and discounts during that period.) Assuming a normal distribution, Z Scores of -1.0 are expected to occur statistically less than 16% of the time. Z Scores of -2.0 are expected to occur statistically less than 2% of the time.
All of our convertible-focused CEFs (CHI, CCD and CHY) currently trade within this Z Score range (Figure 6). What makes this even more compelling is that this valuation dynamic appears attributable not to poor performance, ability to pay distributions, or any fundamental concerns about the convertible bond market. Rather, it is more of a function of recent market dynamics and the inefficiencies of a closed-end fund space largely inhabited by retail investors.
Figure 6. Z Scores Support our View of Current Valuation Opportunity
Ranked from lowest to highest, as of 9/10/20
Ranked from lowest to highest, as of 9/10/20
Past performance is no guarantee of future results.
Based on these overarching considerations, we believe our convertible CEFs offer compelling valuations at current prices relative to their corresponding NAVs. We expect over time the price levels will eventually converge towards their corresponding NAVs, moving toward their historical mean relationship, thereby offering opportunities for price appreciation. In essence, the ability to access an actively managed Calamos portfolio that consists primarily of convertible bonds, at 90 cents on the dollar, is a compelling investment thesis in and of itself.
Conclusion
Capital Link’s recent panel discussion provided insights into the unusual dynamics shaping the closed end fund market. The panel’s assessment supports our view that current market conditions provide compelling valuations for long-term investor to either establish or add to allocations in Calamos closed-end funds—with especially pronounced potential for our convertible-focused CEFs. Supported by dynamic allocation optimized by over five decades of experience in convertibles, rigorous security selection through active management, and judicious use of leverage, the Calamos closed-end funds provide an innovative approach for investors seeking solutions to achieve more income.
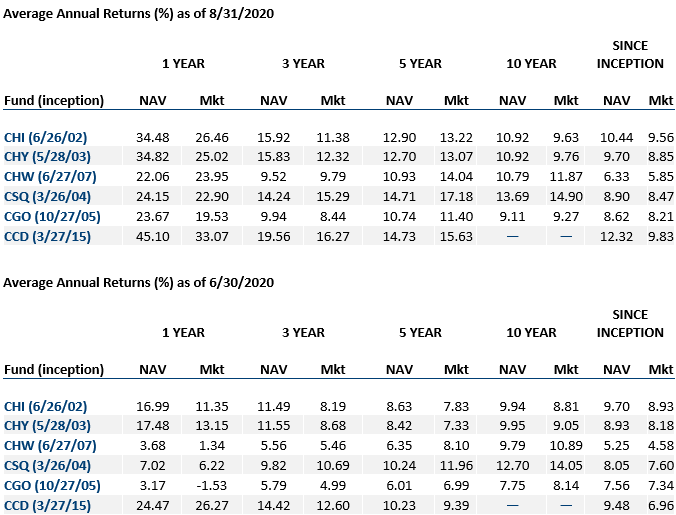
Past performance is no guarantee of future results. Average annual return measures net investment income and capital gain or loss from portfolio investments as an annualized average, assuming reinvestment of income and capital gain distributions. In calculating net investment income, all applicable fees and expenses are deducted from the returns. As with other investments, market price will fluctuate with the market and upon sale, your shares may have a market price that is above or below net asset value and may be worth more or less than your original investment. Returns at NAV reflect the deduction of the Fund’s management fee, debt leverage costs and other expenses. You can purchase or sell common shares daily. Like any other stock, market price will fluctuate with the market. Upon sale, your shares may have a market price that is above or below net asset value and may be worth more or less than your original investment. Shares of closed-end funds frequently trade at a discount which is a market price that is below their net asset value.
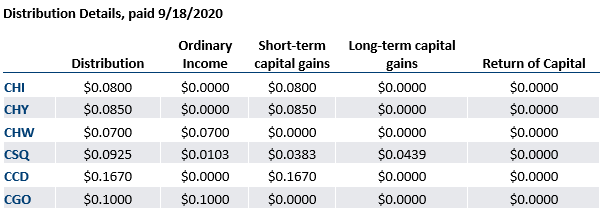
Ordinary income includes net investment income and short-term capital gains. The distribution tables provided here are for informational purposes only. Estimates are calculated on a tax basis rather than on a generally accepted accounting principles (GAAP) basis, but should not be used for tax reporting purposes. Distributions may be subject to re-characterization for tax purposes after the end of the fiscal year. Individual (non-corporate) shareholders with taxable accounts will receive written notification regarding the components and tax treatment for distributions via Form 1099-DIV. If your distributions are reinvested in additional shares, you will receive a statement reflecting the reinvestment of the distribution. This information is not legal or tax advice. Consult a professional regarding your specific legal or tax matters.
All Calamos closed-end funds: Investments by the Fund in lower-rated securities involve substantial risk of loss and present greater risks than investments in higher rated securities, including less liquidity and increased price sensitivity to changing interest rates and to a deteriorating economic environment.
Fixed income securities are subject to interest-rate risk; as interest rates go up, the value of debt securities in the Fund’s portfolio generally will decline.
There are certain risks associated with an investment in a convertible bond such as default risk—that the company issuing a convertible security may be unable to repay principal and interest, and interest rate risk—that the convertible may decrease in value if interest rates increase.
CCD: The Fund’s ability to close out its position as a purchaser or seller of an over-the-counter or exchange-listed put or call option is dependent, in part, upon the liquidity of the option market. There are significant differences between the securities and options markets that could result in an imperfect correlation among these markets, causing a given transaction not to achieve its objectives. The Fund’s ability to utilize options successfully will depend on the ability of the Fund’s investment adviser to predict pertinent market movements, which cannot be assured. Investment Adviser Purchase Risk. As contemplated in the Fund’s prospectus, Calamos Advisors LLC (the “Adviser”) has entered into a 10b5-1 Plan under which a registered broker-dealer (not a member of the underwriting syndicate involved in the offering of the Fund), as agent for the Adviser, will purchase in the open market up to $20 million of our common shares in the aggregate, on such terms and at times, and subject to a variety of market and discount conditions and a daily purchase limit, to be described in a subsequent press release. See “Management of the Fund — Related-Party Transactions” in the Fund’s prospectus. Whether purchases will be made under the 10b5-1 Plan and how much will be purchased at any time is uncertain, dependent on prevailing market prices and trading volumes, all of which we cannot predict. Although intended to provide liquidity, these activities may have the effect of maintaining the market price of our common shares or suppressing a decline in the market price of the common shares, and, as a result, the price of our common shares may be higher than the price that otherwise might exist in the open market. Conversely, any eventual sale of purchased common shares by the Adviser and its affiliates may act as a catalyst for a decline in the Fund’s market price, and therefore the market price of our common shares may be lower than the price that might otherwise exist in the open market. Limited Term Risk. Unless the Termination Date is amended by shareholders in accordance with the Declaration of Trust, the Fund will be terminated on the 15th anniversary of its effective date, currently expected to be March 26, 2030. If the Fund’s Board of Trustees believes that under then current market conditions it is in the best interests of the Fund to do so, the Fund may extend the Termination Date for one year, which is anticipated to be March 26, 2031, without a shareholder vote, upon the affirmative vote of three-quarters of the Trustees then in office. Beginning one year before the Termination Date (the “wind-down period”), the Fund may begin liquidating all or a portion of the Fund’s portfolio. During the wind-down period the Fund may deviate from its investment strategy. As a result, during the wind-down period the Fund’s distributions may decrease, and such distributions may include a return of capital.
CHW: The Fund may invest up to 100% of its assets in foreign securities and invest in an array of security types and market cap sizes, each of which has a unique risk profile. As a result of political or economic instability in foreign countries, there can be special risks associated with investing in foreign securities. These include fluctuations in currency exchange rates, increased price volatility, and difficulty obtaining information. The Fund may invest in derivative securities, including options and swap agreements. The use of derivatives presents risks different from, and possibly greater than, the risks associated with investing directly in traditional securities. There is no assurance that any derivative strategy used by the Fund will succeed. One of the risks associated with purchasing an option is that the Fund pays a premium whether or not the option is exercised.
Leverage creates risks which may adversely affect return, including the likelihood of greater volatility of net asset value and market price of common shares; and fluctuations in the variable rates of the leverage financing. The ratio is the percent of borrowing to total assets.
Level Rate Distribution Policy and Managed Distribution Policy are each an investment company’s commitment to common shareholders to provide a predictable, but not assured, level of cash flow.
Source ICE Data Indices, LLC, used with permission. ICE permits use of the ICE BofA indices and related data on an ‘as is’ basis, makes no warranties regarding same, does not guarantee the suitability, quality, accuracy, timeliness, and/or completeness of the ICE BofA Indices or data included in, related to, or derived therefrom, assumes no liability in connection with the use of the foregoing and does not sponsor, endorse or recommend Calamos Advisors LLC or any of its products or services.
Opinions and estimates offered constitute our judgment and are subject to change without notice, as are statements of financial market trends, which are based on current market conditions as of the date of publication. We believe information provided here is reliable, but do not warrant its accuracy or completeness. The material is not intended as an offer or solicitation for the purchase of any financial instrument. The views and strategies described may not be suitable for all investors. This material has been prepared for informational purposes only and is not intended to provide—and should not be relied on for—accounting, legal or tax advice. References to future returns are not promises or even estimates of actual returns a client may achieve. Any forecasts contained herein are for illustrative purposes only and are not to be relied upon as advice or interpreted as a recommendation. The securities highlighted are discussed for illustrative purposes only. They are not recommendations.
Calamos Advisors LLC
Calamos Financial Services LLC, Distributor
2020 Calamos Court | Naperville, IL 60563-2787 800.582.6959 | calamos.com | caminfo@calamos.com | © 2020 Calamos Investments LLC. All Rights Reserved. Calamos® and Calamos Investments® are registered trademarks of Calamos Investments LLC.
NOT FDIC INSURED | NO BANK GUARANTEE | MAY LOSE VALUE
18832 0920R