How to Evaluate Options-based Strategies
August 21, 2019
The story of much of 2019 was about the flows out of equity funds at the very wrong time. With its return of 18.5% by June 30, the S&P 500 had an excellent first half of the year, and many optimists thought the rally could continue indefinitely.
Here’s another side of the story: The flows into options-based funds, making the Morningstar category the largest flowing alternatives category over the trailing one year ended June 30.
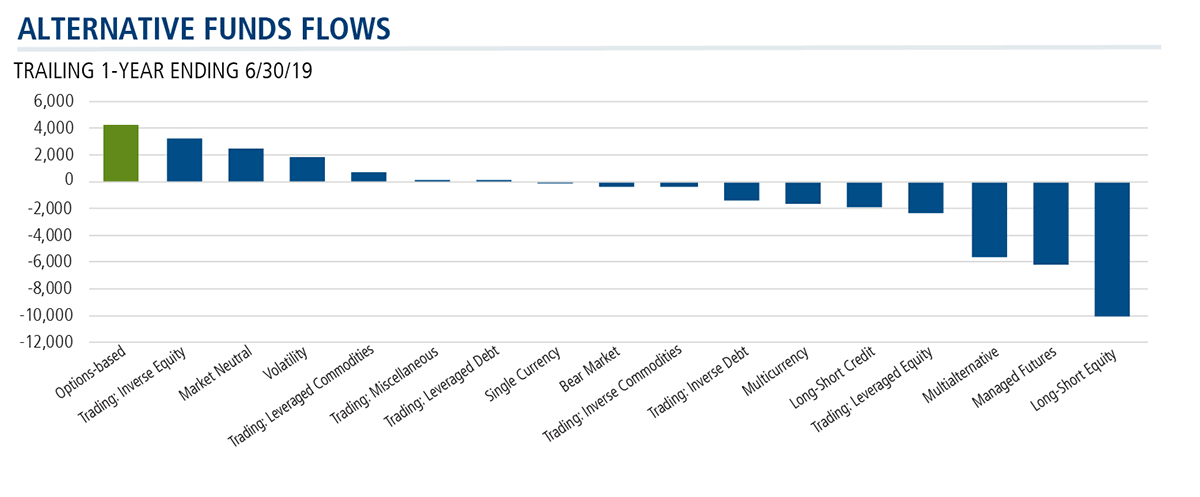
The strength of the flows—more than $4.2 billion—suggests that advisors have been:
- Determined to prepare their clients for the return of volatility and equity drawdowns.
- Looking for true uncorrelated, liquid and transparent solutions unavailable from traditional funds.
- Willing to forfeit the potential for added market upside if the strategy delivers better risk-adjusted returns.
But the 95 funds in the Options-based category apply a broad set of approaches with varying risk profiles and reactions to market environments. We recommend financial advisors ask the following three questions when conducting due diligence on these strategies.
3 Questions to Ask When You’re Evaluating Options-based Strategies
Q1. Where is the fund taking risks?
What problem does the fund attempt to solve? Is the fund’s goal to generate income? Is the goal to reduce risk? And how does that align with your portfolio objective?
The CIHEX AnswerThe CIHEX portfolio management team uses options to create a particular outcome or a particular series of outcomes. The approach is to buy cheap and sell expensive. That’s why we buy lower options volatility and sell more expensive option volatility all around an optimized S&P 500 equity sleeve. This active approach—buying what is cheap and selling what is expensive—seeks better risk-adjusted returns.
Q2. How are the option trades implemented?
Many options-based funds follow a systematic strategy with known ranges and resets. These are in place for a reason, but it’s important to understand the implications of a passive strategy. In the case of an upside that is capped at a certain percentage each quarter, for example, the timing of a new investment will be paramount.
The CIHEX AnswerThe process/set-up is key to any investment. The investment process is one of the few aspects of investing that the manager can fully control. The CIHEX team executes only the trades that it wants to do, and only those that they believe will benefit the total portfolio. When deploying an options-based equity strategy, the critical elements of the investment process include:
- Developing an assumption about direction (up-down-neutral).
- Consideration of the implied volatility regime/environment of the stock/options market.
- Identifying and defining the optimal time frame (i.e., expiration month to trade).
- Establishing the risk profile, choosing appropriate market exposure/participation based on risk preference.
CIHEX is opportunistic. The team seeks to take advantage of whatever the current market provides. The strategy is dynamic (able to adjust to take advantage of the market opportunities) and flexible (able to structure the hedge however the team thinks is best). In contrast to a strategy whose trading is prescribed by a system, the team can’t be forced into trades where the risk/reward is lacking.
Q3. What controls are in place?
Tail risk, specifically, is something to be mindful of. The “unhappy outcomes” that have occurred in the options space were experienced by investors shorting tails—e.g., the $1 million fund that shorted $5 million worth of puts far out of the money.
The CIHEX AnswerThe CIHEX team has the freedom to optimize implementation and generate diversifying alpha from option market dynamics. But guardrails are in place. To maintain a degree of potential downside protection, the fund is net long puts. The team won’t write over more than 100% calls to the upside. (Please note, however, that this strategy may limit potential upside participation and presents the risk that the associated option premiums may be lost if the underlying stock increases in price.)
Delta, on the most basic level, helps determine the risk profile of the total position. The delta of the individual options approximates the probability of being in the money and the delta of a portfolio helps determine portfolio participation when markets move up and down. This helps confirm that the fund is staying within the established guardrails.
Direction and Duration: 2 Key Considerations
In researching options strategies, there are two key considerations to understanding how the investment team is driving toward an optimal profit/loss scenario. Here’s added detail about how the CIHEX team seeks to minimize the subjectivity of trying to time market upswings and downswings.
- The directional assumption of the trade
There are just three outright positional stances to be taken: bullish, bearish or neutral. The core CIHEX portfolio is naturally bullish. The core long equity portfolio is an S&P 500 tracking sleeve of stocks that can benefit from the market’s natural positive drift.
Using ETF SPY as a proxy for the S&P 500, from 2005 through July 31, 2019, the market roughly has a 65% upward drift probability over 30/45/60 days vs. an approximate 34% downward probability during the same time frame. This implies a positive drift and an opportunity to take advantage of this “natural” upward drift and be net long the market.
Taking a bullish tilt offers the potential of a better “win rate,” but is not without potential risks. It’s unknown whether the next 10 years will provide the same positive drift as the past decade.
The team looks to mitigate this downside risk with the purchase of put option strategies. These downside “bullets” are in place to minimize the impact of sharp downside moves. The team is willing to trade off some upside of the core S&P 500 tracking portfolio, by selling calls trying to generate excess returns, to pay for the put strategies. The approach has lowered the standard deviation, i.e., volatility, of risk but improved the average annualized return of our investment capital on a risk-adjusted basis.
- Definition of the optimal time frame (i.e., expiration month to trade)
The probability of an outlier move with the S&P 500, i.e., more than 2 standard deviations, to the downside vs. upside is almost a 3-to-1 tilt to the downside over a 30/45/60 day cycle. That said, positioning the duration of the option positions 90/120/200 days until expiry may not deliver on the intended goal.
The CIHEX team positions strategies and duration to work when they’re needed, and they’re actively managed to optimize the risk and return preference, in line with the return on capital goal.
Implied Volatility (IV) is the measure used for monitoring future move expectations in the underlying. The team looks at where IV is today relative to where it has been in the past, which helps define what is cheap and what is expensive. The team likes to buy cheap volatility and sell high volatility since volatility is mean-reverting. No single options strategy works in all environments; the matrix to the right lays out the ideal IV environment for most strategies that CIHEX might deploy.
In his more than 40 years of study and real-world experience, John P. Calamos, Sr. has pioneered strategies used to manage convertible bonds, options and volatility. This expertise underlies the team’s approach—which is to manage risk and then profits. Together, the portfolio managers have a combined 60-plus years of options experience.
For more on options-based investing or CIHEX, contact your Investment Consultant at 888-571-2567 or caminfo@calamos.com.
Before investing, carefully consider the fund’s investment objectives, risks, charges and expenses. Please see the prospectus and summary prospectus containing this and other information which can be obtained by calling 1-866-363-9219. Read it carefully before investing.
Opinions and estimates offered constitute our judgment and are subject to change without notice, as are statements of financial market trends, which are based on current market conditions. We believe the information provided here is reliable, but do not warrant its accuracy or completeness. This material is not intended as an offer or solicitation for the purchase or sale of any financial instrument. The views and strategies described may not be suitable for all investors. This material has been prepared for informational purposes only, and is not intended to provide, and should not be relied on for, accounting, legal or tax advice. References to future returns are not promises or even estimates of actual returns a client portfolio may achieve. Any forecasts contained herein are for illustrative purposes only and are not to be relied upon as advice or interpreted as a recommendation.
An investment in the Fund(s) is subject to risks, and you could lose money on your investment in the Fund(s). There can be no assurance that the Fund(s) will achieve its investment objective. Your investment in the Fund(s) is not a deposit in a bank and is not insured or guaranteed by the Federal Deposit Insurance Corporation (FDIC) or any other government agency. The risks associated with an investment in the Fund(s) can increase during times of significant market volatility. The Fund(s) also has specific principal risks, which are described below. More detailed information regarding these risks can be found in the Fund’s prospectus.
The principal risks of investing in the Calamos Hedged Equity Fund include: covered call writing risk, options risk (see definition below), equity securities risk, correlation risk, mid-sized company risk, interest rate risk, credit risk, liquidity risk, portfolio turnover risk, portfolio selection risk, foreign securities risk, American depository receipts, and REITs risks.
Options Risk—the Fund’s ability to close out its position as a purchaser or seller of an over-the-counter or exchange-listed put of call option is dependent, in part, upon the liquidity of the options market. There are significant differences between the securities and options markets that could result in an imperfect correlation among these markets, causing a given transaction not to achieve its objectives. The Fund’s ability to utilize options successfully will depend on the ability of the Fund’s investment advisor to predict pertinent market movements, which cannot be assured.
Alternative investments are not suitable for all investors.
The S&P 500 Index is generally considered representative of the U.S. stock market.
Short Naked Put Option involves writing (selling) a put option without the reserved cash on hand to purchase the underlying stock.
Short Naked Call Option involves writing (selling) a call option without owning shares of the underlying stock todeliver the shares specified.
Short Put/Call Vertical Spread involves the simultaneous buying and selling of options of the same type (puts or calls) and expiry, but at different strike prices.
Short Strangle Strategy is a neutral strategy in options trading that involves the simultaneous selling of a slightly out-of-the-money put and a slightly out-of-the-money call of the same underlying stock and expiration date.
Short Straddle Strategy is a combination of writing uncovered calls (bearish) and writing uncovered puts (bullish), both with the same strike price and expiration.
Front Ratio Put/Call Spread is a neutral strategy in options trading that involves buying a number of put or call options and selling a larger number of put or call options of the same underlying stock and expiration date at a different strike price.
Long Put/Call Diagonal Spread is an options strategy established by simultaneously entering into a long and short position in two options of the same type (two call options or two put options) but with different strike prices and different expiration dates.
Long Put/Call Vertical Spread involves the simultaneous buying and selling of options of the same type (puts or calls) and expiry, but at different strike prices.
Archived material may contain dated performance, risk and other information. Current performance may be lower or higher than the performance quoted in the archived material. For the most recent month-end fund performance information visit www.calamos.com. Archived material may contain dated opinions and estimates based on our judgment and are subject to change without notice, as are statements of financial market trends, which are based on current market conditions at the time of publishing. We believed the information provided here was reliable, but do not warrant its accuracy or completeness. This material is not intended as an offer or solicitation for the purchase or sale of any financial instrument. The views and strategies described may not be suitable for all investors. This material has been prepared for informational purposes only, and is not intended to provide, and should not be relied on for, accounting, legal or tax advice. References to future returns are not promises or even estimates of actual returns a client portfolio may achieve. Any forecasts contained herein are for illustrative purposes only and are not to be relied upon as advice or interpreted as a recommendation.
Performance data quoted represents past performance, which is no guarantee of future results. Current performance may be lower or higher than the performance quoted. The principal value and return of an investment will fluctuate so that your shares, when redeemed, may be worth more or less than their original cost. Performance reflected at NAV does not include the Fund’s maximum front-end sales load. Had it been included, the Fund’s return would have been lower.
Archived on August 21, 2020