Preparing Portfolios for the Return of Volatility: Advisors’ Questions Answered
April 30, 2019
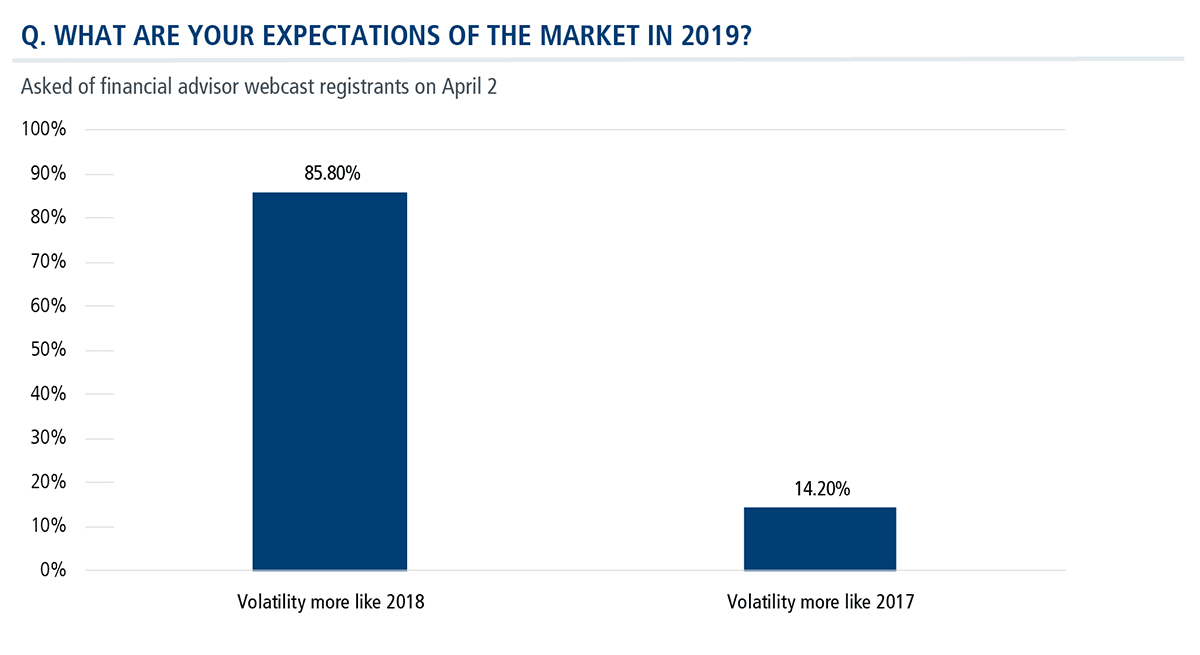
Several hundred financial advisors joined us for a Monetizing Volatility: A Deep Dive webcast on April 2. The first quarter had just closed with the S&P 500 up double digits, equity valuations were elevated, and the VIX (CBOE volatility index) was low and on its way to dropping further—all conditions that have continued into the second quarter.
While low volatility and rising stocks make for an attractive environment, many advisors are cautious. When we polled our webcast participants, eight of 10 expect a return of volatility, such as was experienced last year (see this post on 2018’s three drawdowns).
To help advisors navigate these crosscurrents, our webcast focused on the opportunities of equity and fixed income liquid alternatives as strategic allocations, including in times of turbulence. The webcast featured equity alternative Calamos Hedged Equity Fund (CIHEX) and income alternative Calamos Market Neutral Income Fund (CMNIX).
Advisors, to learn how these strategies can capitalize on market volatility and generate diversifying alpha, we invite you to watch the on-demand replay.
Below, we excerpt some highlights of the webcast’s extended Q&A, edited for clarity. Moderated by Calamos Senior Vice President Tim Brand, Head of U.S. Intermediary Distribution, the discussion featured Eli Pars, CFA, Co-CIO, Head of Alternative Strategies and Co-Head of Convertible Strategies, Sr. Co-PM; Jason Hill, Senior Vice President, Co-Portfolio Manager; David O’Donohue, Senior Vice President, Co-Portfolio Manager; and Jimmy Young, CFA, Vice President, Co-Portfolio Manager.
Q. Please compare the two funds and how the hedged strategy is used in Market Neutral Income versus in the Hedged Equity Fund.
A. They have comparable equity portfolios, and our philosophy in constructing the hedge is similar in that we're using SPX options in both funds to build the hedge that the team believes will have the best risk/reward tradeoff.
But, the two funds do have different risk profiles and different investor bases. The exact hedge profile between the two funds can be quite different at times.
While Hedged Equity is positioned as a more defensive equity fund or equity substitute, the Market Neutral Income Fund aims for a more stable, consistent, fixed income-like return stream over time.
We generally have an eye on maintaining greater downside protection in the Market Neutral Income Fund. In the Hedged Equity Fund, we are focused on achieving more upside participation. The graphs on this chart compare the delta hedge and general option positioning for the two funds at each quarter-end in 2018.
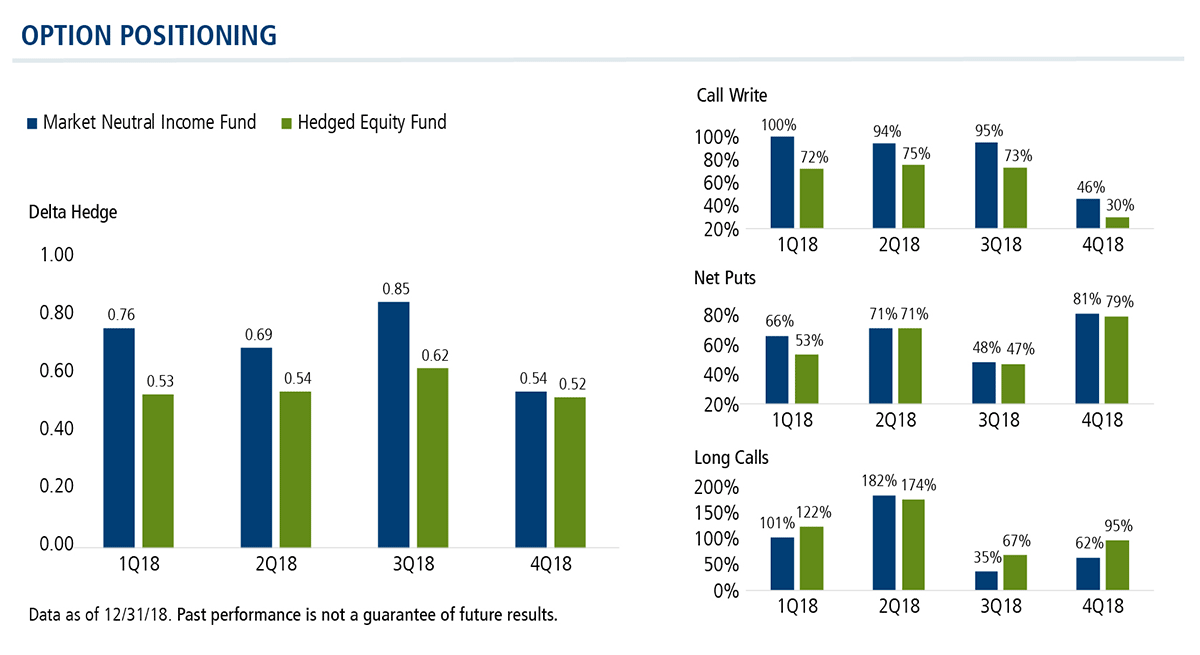
Generally, with a delta hedge, the higher the number, the more likely the fund has greater opportunity for potential downside protection. As you can see, throughout the year, Market Neutral consistently had a higher delta hedge than Hedged Equity.
It’s important to note that these numbers are just a snapshot in time and looking at one number in isolation doesn't tell the whole story.
For example, in the fourth quarter of 2018, the delta hedge for Market Neutral looks relatively low compared to earlier in the year. However, the fund had a relatively high put notional (81%), giving the fund good skew to the downside. In the event of a large market selloff, the hedge would quickly increase, giving the fund greater opportunity for potential downside protection.
Market Neutral maintained a higher call write and as much or more put notional throughout the year than Hedged Equity, which illustrates the different positioning of the two funds. Hedged Equity had a lower delta hedge during the year, which we achieved with a lower call write. And through the use of call spreads, Hedged Equity often had more long calls, giving the fund the opportunity for more additional upside participation.
Q. From your perspective, how would the two funds fit in an asset allocation?
A. In our experience, many advisors use Market Neutral Income Fund as a fixed income alternative. It has a similar return profile to what intermediate-term fixed income used to have. To date, it hasn’t had a lot of interest rate sensitivity.
When people were concerned about the downside of fixed income, particularly the Treasury market with rates being as low as they were, we didn't really have a lot of that downside interest rate risk. When the bond market is rallying like it has been over the last couple of months, we don't have that opportunity either. We're just not correlated that closely to the bond market.
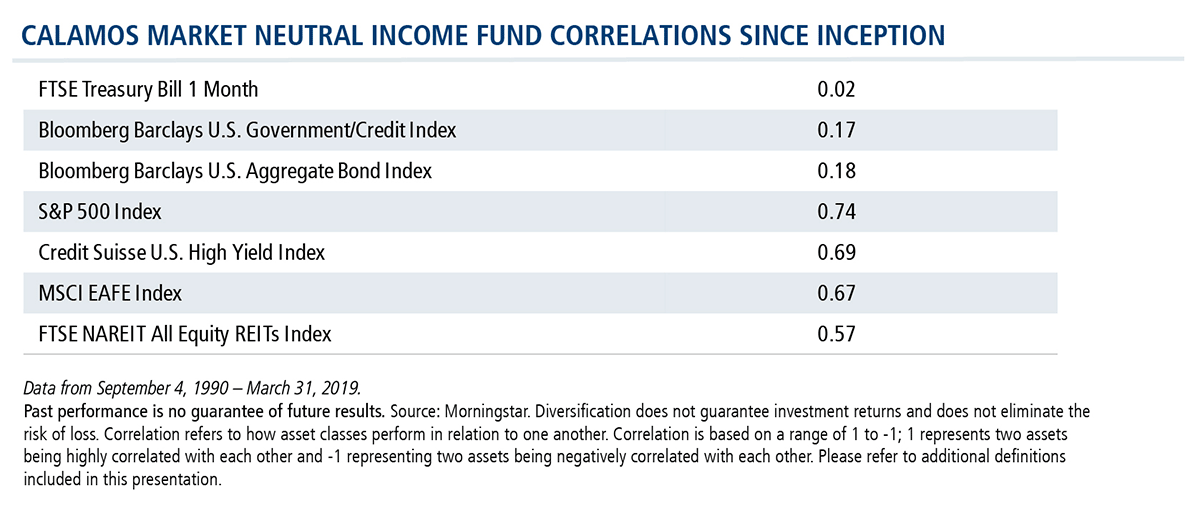
We think Market Neutral Income is especially compelling as a fixed income substitute when the risk reward profile for bonds is less attractive, particularly for Treasuries or higher investment-grade credits. From a risk/reward basis, we believe there's a pretty strong argument for many investors to move some money out of traditional fixed income and into alternatives like Market Neutral Income.
The fund is also often used by sophisticated advisors who have big allocations to alternatives already. Market Neutral serves as a great anchor to that part of the portfolio. It has been a steady-return, lower-risk fund you can allocate to that allows you, at the edges of that alternative portfolio, to maybe take on some more high flyers with higher return—and higher risk—potential.
Hedged Equity Fund is an equity alternative. We're trying to find equity returns with lower volatility to help manage investors’ instincts to get out of the market at the wrong time.
Our hedged equity approach could be a good choice for those who have missed out on some of the post-2008 bull market and are reluctant to put money into equities now. This is a way to dip your toe in with potentially less risk. It could be for those who had a nice equity allocation for a while and want to take some risk off the table but don't necessarily want to take it all the way to fixed income or cash.
A lower-volatility equity strategy like Hedged Equity Fund fits very well for that. We think we can do more than what a blend of fixed income and equities would give you in your portfolio. Our ability to manage that option book on an active basis has proven its ability to generate alpha.
Q. What is the market environment that would present the most headwinds for the strategy?
A. Some of our competitors tend to be systematic and dogmatic about how they construct their hedge, which can work well in some market environments and not well in others. We are more active in trying to take advantage of what the market gives us, which means that in a lower vol environment like 2017: a) we’re probably going to have more of a long vol approach to our hedge than we would in other market environments; and b) we're not presented with as many opportunities to monetize that volatility.
Often, people are focused on some of our options competitors that have blown up in different manners over the last few years, and they're concerned about what market environment could blow up the Hedged Equity Fund.
We just don't run it that way. We don't want to oversell calls, overwrite puts or take those tails on. If anything, we’d want to get long those tails rather than short them. We just don't want that risk.
We did lag a few of our more systematic competitors in 2017 when volatility was at historically low levels. We think that's probably the worst-case scenario market environment for the fund. For an equity alternative, that's maybe not the worst thing in the world, because if you're deciding where you're going to place your risk, what you don't want to do is underperform in a down market.
Our worst-case market isn't some crazy spike that blows up the fund, it’s more of a drifting up market when we’re earning a decent return but lagging a bit more than we'd like.
Q. Do the funds use leverage?
A. We've never used leverage in either fund. Although it is common for hedged funds to use convertible arbitrage on a levered basis, we run Market Neutral Income’s convertible arbitrage sleeve on an unlevered basis. We think it provides greater balance to a portfolio without introducing too much risk.
Q. How do you construct the underlying equity basket that's a foundation for the option strategy of both funds?
A. In our Hedged Equity Fund and hedged equity strategy in the Market Neutral Income Fund, we are buying about 250 to 275 stocks to replicate and ideally beat the S&P 500. We aren’t taking large sector or factor bets. Our goal is to add alpha in our equity books. But foremost we want to have a minimal tracking error to the S&P because we trade S&P 500 Index options.
Q. Please explain Hedged Equity Fund’s increase in turnover in 2018.
A. It’s important to note and understand that turnover is not inherent to the core strategy. The strategy itself actually has had a reasonably low turnover.
The turnover in 2018 was really a function of our rapid AUM growth, and more specifically how we manage and invest those inflows. As the fund grows and we reach more of a steady state, you should see that turnover come back down.
To elaborate: as we get inflows, we have to invest them. Sometimes that can be tricky for managers. One benefit to the structure of our fund is we actually have some flexibility in how we do that. When we get an inflow, normally that would involve us going out and buying that portfolio of 250 to 270 stocks. But due to the nature of our strategy and the low tracking error we maintain, another option available to us is to purchase an ETF that closely tracks the index.
As we build up that ETF position over a couple of days, we can sell the ETF and simultaneously roll that into a portfolio of equities.
We like this for two reasons. One, it reduces our slippage versus the index. It's quick. It's efficient. We can match up the ETF sale with those single-name buys. But it also gives us some greater flexibility on timing, which allows us to be a bit more opportunistic.
Take for example, if we have a larger inflow. We come in that morning and S&P futures are down. It's not realistic for us to purchase all 270 equities pre-open. We can't do it very efficiently. But we can purchase an ETF that tracks the S&P 500, which allows us to take advantage of that discount.
One of the core strengths of the strategy is its liquidity. We’ve been able to handle the inflows fairly seamlessly. Unfortunately, the drawback is that it does affect the turnover calculation. But this is a somewhat temporary problem that will ultimately fix itself.
As the AUM of the fund grows, the denominator in the calculation grows, the impact of each subsequent inflow diminishes, and that turnover will come down naturally.
Q. How do you account for the fact that puts might get more expensive as volatility spikes? Would you ever go unhedged because of the cost of the puts or the cost of the options that you're trying to implement?
A. Generally, our base or model trade is an 80% call over write matched with a minimum 40% put protection and a 40 delta to the downside. While these are the guardrails that we will typically stick to, we are continuously trying to improve this baseline trade based on the market environment.
We have gone either close or completely unwritten on the call side. For example, if you think about it mathematically, we might go out and sell a call for $25. And the market breaks meaningfully—10%-15%. A little time passes. All of a sudden that call that we sold for $25 is now $4. Well, it can only go to $0. It's not going to be negative. And at some point, we may buy that back.
If the sell-off in December had continued a couple more days, we might have reached a point there where we were zero call written, because we were reaching the point where the value of our calls was dropping relatively quickly. We had the advantage of having a lot of puts—more than the 40% notional guardrail—to lean on in that environment.
We will do that on the call side, but we won't on the put side. We're always going to make sure we have some potential downside protection.
This is an example of how we dynamically manage our options positions. We like having either put spreads or incremental puts on top of the 40% notional, so we have something to monetize, to roll out, to maintain that put hedge even as the vol environment gets trickier. And we'll do some things with playing around with expiries. Generally, if put vol is expensive, call vols usually get at least a better bid, so there's something we can do on the call side as well.
As managers, it’s important to understand the core nature of your investor. For both of these strategies, we always have to be cognizant of the downside and of making sure that we do flatten out that downside tail. The goal is to have left ourselves in a position where we can trade out of a position of strength in those markets and have the ability to monetize a little bit of that and take out some of the upside. But we also remain focused on the fact that we need to continue to manage and protect capital when the market really gets ugly.
We are mindful of our guardrails, but there are times when puts are expensive and times when they are relatively affordable. There are times when selling calls makes a lot of sense. And there are times when it's tougher when you're selling low implied volatility calls.
We really want to have flexibility. There will be times when we need to dampen down the risk of our equity books. But how we do that is going to be determined by what the opportunity set in the market is. We step back and ask what's unique to this market environment today and how can we use that to build up a better hedge?
Q. Isn’t the put spread an aggressive trade? How does it fit into the overall profile of the Hedged Equity Fund?
A. Put spreads are risk-reducing positions. We're buying one put and we're selling a lower strike put. So, the only amount we can lose on that is what we paid for that put spread. They don't inherently increase risk, they diminish risk. The downside is that they pay off only for a certain distribution—in between the two strikes but not all the way down.
It’s the same for call spreads. If we sell a call spread, it's a little less risky because it caps us only for a certain move in the market. So, it offers less cap than just a pure call sell. And once again, we're not going to overwrite that. We'll never oversell 100%, even if we have long calls. So, our call spreads will be included in that. We want to make sure that we're not short a tail at the upside as well.
For More Information
The webcast tapped into growing interest—and increasing asset flows—in the options-based alternative category over the past two years. For more information, also see our options-based explainer).
Calamos was #1 in flows to funds in the Morningstar Alternatives Category in 2018, and ranks fourth on the list of alternative fund managers by assets under management as of 3/31/19 (Morningstar data).
Click here to view CIHEX's standardized performance.
Click here to view CMNIX's standardized performance.
Before investing, carefully consider the fund’s investment objectives, risks, charges and expenses. Please see the prospectus and summary prospectus containing this and other information which can be obtained by calling 1-866-363-9219. Read it carefully before investing.
Opinions and estimates offered constitute our judgment and are subject to change without notice, as are statements of financial market trends, which are based on current market conditions. We believe the information provided here is reliable, but do not warrant its accuracy or completeness. This material is not intended as an offer or solicitation for the purchase or sale of any financial instrument. The views and strategies described may not be suitable for all investors. This material has been prepared for informational purposes only, and is not intended to provide, and should not be relied on for, accounting, legal or tax advice. References to future returns are not promises or even estimates of actual returns a client portfolio may achieve. Any forecasts contained herein are for illustrative purposes only and are not to be relied upon as advice or interpreted as a recommendation.
Active management does not guarantee investment returns or eliminate the risk of loss. It should not be assumed that any securities mentioned in this recording will be profitable or experience equal performance in the future.
Important Risk Information. An investment in the Fund(s) is subject to risks, and you could lose money on your investment in the Fund(s). There can be no assurance that the Fund(s) will achieve its investment objective. Your investment in the Fund(s) is not a deposit in a bank and is not insured or guaranteed by the Federal Deposit Insurance Corporation (FDIC) or any other government agency. The risks associated with an investment in the Fund(s) can increase during times of significant market volatility. The Fund(s) also has specific principal risks, which are described below. More detailed information regarding these risks can be found in the Fund’s prospectus.
Alternative investments may not be suitable for all investors, and the risks of alternative investments vary based on the underlying strategies used. Many alternative investments are highly illiquid, meaning that you may not be able to sell your investment when you wish to.
Some of the risks associated with investing in alternatives may include hedging risk – hedging activities can reduce investment performance through added costs; derivative risk – derivatives may experience greater price volatility than the underlying securities; short sale risk – investments may incur a loss without limit as a result of a short sale if the market value of the security increases; interest rate risk – loss of value for income securities as interest rates rise; credit risk – risk of the borrower to miss payments; liquidity risk – low trading volume may lead to increased volatility in certain securities; non-U.S. government obligation risk – non-U.S. government obligations may be subject to increased credit risk; portfolio selection risk – investment managers may select securities that fare worse than the overall market.
The principal risks of investing in the Calamos Hedged Equity Fund include: covered call writing risk, options risk, equity securities risk, correlation risk, mid-sized company risk, interest rate risk, credit risk, liquidity risk, portfolio turnover risk, portfolio selection risk, foreign securities risk, American depository receipts and REITs risks.
Covered Call Writing: As the writer of a covered call option on a security, the fund foregoes, during the option’s life, the opportunity to profit from increases in the market value of the security, covering the call option above the sum of the premium and the exercise price of the call.
Convertible Securities Risk: The value of a convertible security is influenced by changes in interest rates, with investment value declining as interest rates increase and increasing as interest rates decline. The credit standing of the issuer and other factors also, may have an effect on the convertible security’s investment value.
Convertible Hedging Risk: If the market price of the underlying common stock increases above the conversion price on a convertible security, the price of the convertible security will increase. The fund’s increased liability on any outstanding short position would, in whole or in part, reduce this gain.
Convertible Securities Risk: The value of a convertible security is influenced by changes in interest rates, with investment value declining as interest rates increase and increasing as interest rates decline. The credit standing of the issuer and other factors also may have an effect on the convertible security’s investment value.
The principal risks of investing in the Calamos Market Neutral Income Fund include: equity securities risk consisting of market prices declining in general, convertible securities risk consisting of the potential for a decline in value during periods of rising interest rates and the risk of the borrower to miss payments, synthetic convertible instruments risk, convertible hedging risk, covered call writing risk, options risk, short sale risk, interest rate risk, credit risk, high yield risk, liquidity risk, portfolio selection risk, and portfolio turnover risk.
As a result of political or economic instability in foreign countries, there can be special risks associated with investing in foreign securities, including fluctuations in currency exchange rates, increased price volatility and difficulty obtaining information. In addition, emerging markets may present additional risk due to potential for greater economic and political instability in less developed countries.
S&P 500 Index is generally considered representative of the U.S. stock market.
Bloomberg Barclays U.S. Aggregate Bond Index is a broad-based benchmark that measures the investment-grade, U.S. dollar-denominated, fixed-rate, taxable bond market of SEC-registered securities. The index includes bonds from the Treasury, Government-Related, Corporate, MBS (agency fixed-rate and hybrid ARM pass-throughs), ABS and CMBS sectors.
Bloomberg Barclays U.S. Government/Credit Index comprises long-term government and investment grade corporate debt securities and is generally considered representative of the performance of the broad U.S. bond market. Unlike convertible bonds, U.S. Treasury bills are backed by the full faith and credit of the U.S. government and offer a guarantee as to the timely repayment of principal and interest.
Citigroup 30-Day T-Bill Index is generally considered representative of the performance of short-term money market instruments.
Alpha is a historical measure of risk-adjusted performance. Alpha measures how much of a portfolio’s performance is attributable to investment-specific factors versus broad market trends. A positive alpha suggests that the performance of a portfolio was higher than expected given the level of risk in the portfolio. A negative alpha suggests that the performance was less than expected given the risk.
Beta is an historic measure of a fund’s relative volatility, which is one of the measures of risk; a beta of 0.5 reflects 1/2 the market’s volatility as represented by the fund’s primary benchmark, while a beta of 2.0 reflects twice the volatility.
Delta measures how much the convertible value rises or falls for a given stock move.
Drawdown is the peak-to-trough decline during a specific record period of an investment. A drawdown is usually quoted as the percentage between the peak and the trough.
Gamma is the change in delta as stock price moves.
Notional value is a term often used to describe the value of the underlying asset in an options trade. It can be the total value of a position, how much value a position controls, or an agreed-upon amount in a contract. The notional value accounts for the total value of the position, while the market value is the price at which that position can be bought or sold in the marketplace.
Skewness describes asymmetry of returns from the normal distribution.
Tracking error is a measure of the divergence between the price behavior of a position or a portfolio and the price behavior of a benchmark, usually expressed as a standard deviation percentage.
© 2019 Calamos Investments LLC. All Rights Reserved. Calamos® and Calamos Investments® are registered trademarks of Calamos Investments LLC.
801553 0419
Archived material may contain dated performance, risk and other information. Current performance may be lower or higher than the performance quoted in the archived material. For the most recent month-end performance information, please CLICK HERE. Archived material may contain dated opinions and estimates based on our judgment and are subject to change without notice, as are statements of financial market trends, which are based on current market conditions at the time of publishing. We believed the information provided here was reliable, but do not warrant its accuracy or completeness. This material is not intended as an offer or solicitation for the purchase or sale of any financial instrument. The views and strategies described may not be suitable for all investors. This material has been prepared for informational purposes only, and is not intended to provide, and should not be relied on for, accounting, legal or tax advice. References to future returns are not promises or even estimates of actual returns a client portfolio may achieve. Any forecasts contained herein are for illustrative purposes only and are not to be relied upon as advice or interpreted as a recommendation.
Performance data quoted represents past performance, which is no guarantee of future results. Current performance may be lower or higher than the performance quoted. The principal value and return of an investment will fluctuate so that your shares, when redeemed, may be worth more or less than their original cost. Performance reflected at NAV does not include the Fund’s maximum front-end sales load. Had it been included, the Fund’s return would have been lower. For the most recent month-end fund performance information visit www.calamos.com.
Archived material may contain dated performance, risk and other information. Current performance may be lower or higher than the performance quoted in the archived material. For the most recent month-end fund performance information visit www.calamos.com. Archived material may contain dated opinions and estimates based on our judgment and are subject to change without notice, as are statements of financial market trends, which are based on current market conditions at the time of publishing. We believed the information provided here was reliable, but do not warrant its accuracy or completeness. This material is not intended as an offer or solicitation for the purchase or sale of any financial instrument. The views and strategies described may not be suitable for all investors. This material has been prepared for informational purposes only, and is not intended to provide, and should not be relied on for, accounting, legal or tax advice. References to future returns are not promises or even estimates of actual returns a client portfolio may achieve. Any forecasts contained herein are for illustrative purposes only and are not to be relied upon as advice or interpreted as a recommendation.
Performance data quoted represents past performance, which is no guarantee of future results. Current performance may be lower or higher than the performance quoted. The principal value and return of an investment will fluctuate so that your shares, when redeemed, may be worth more or less than their original cost. Performance reflected at NAV does not include the Fund’s maximum front-end sales load. Had it been included, the Fund’s return would have been lower.
Archived on April 29, 2020