Don’t Go—Here’s How You Might Hedge the Equity Risk
May 14, 2019
This promises to be the kind of week when financial advisors prove their value. Monday’s pullback and market volatility overall is unnerving clients, many of whom may be ready to take their 2019 equities gains and bolt, even if just for a while.
It’s easy to understand why going away this May has appeal—which is why your clients are smart to work with an advisor. If your clients’ investment objectives depend upon the long-term growth of equities, they need you to make the argument for staying in the market.
Big Gains Have Historically Followed Big Losses
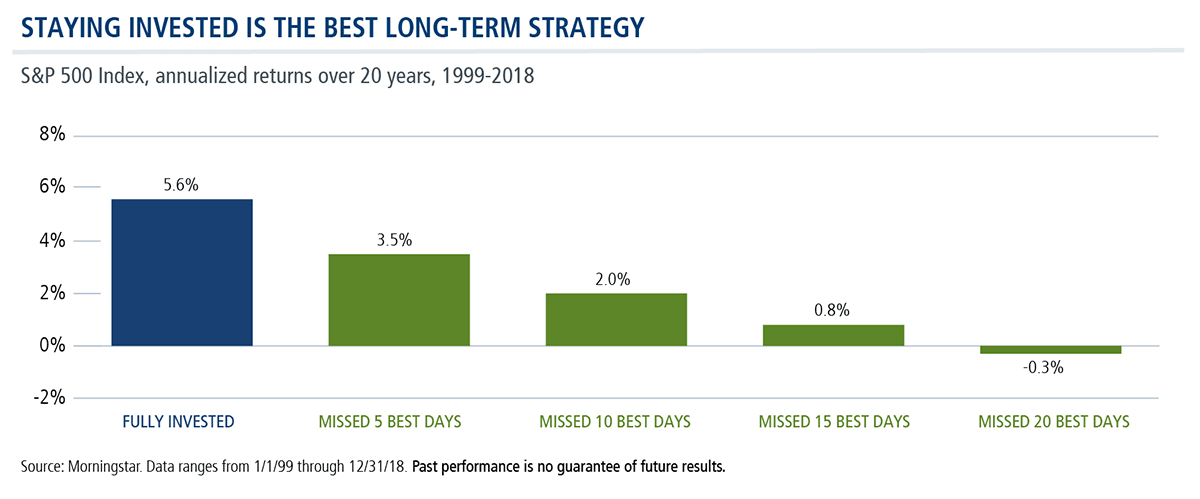
Timing the market is a risky strategy because market-timers often miss the market’s best days. Even a handful of days can make a difference in investment returns, as shown below.
Here’s what’s especially relevant for this May.
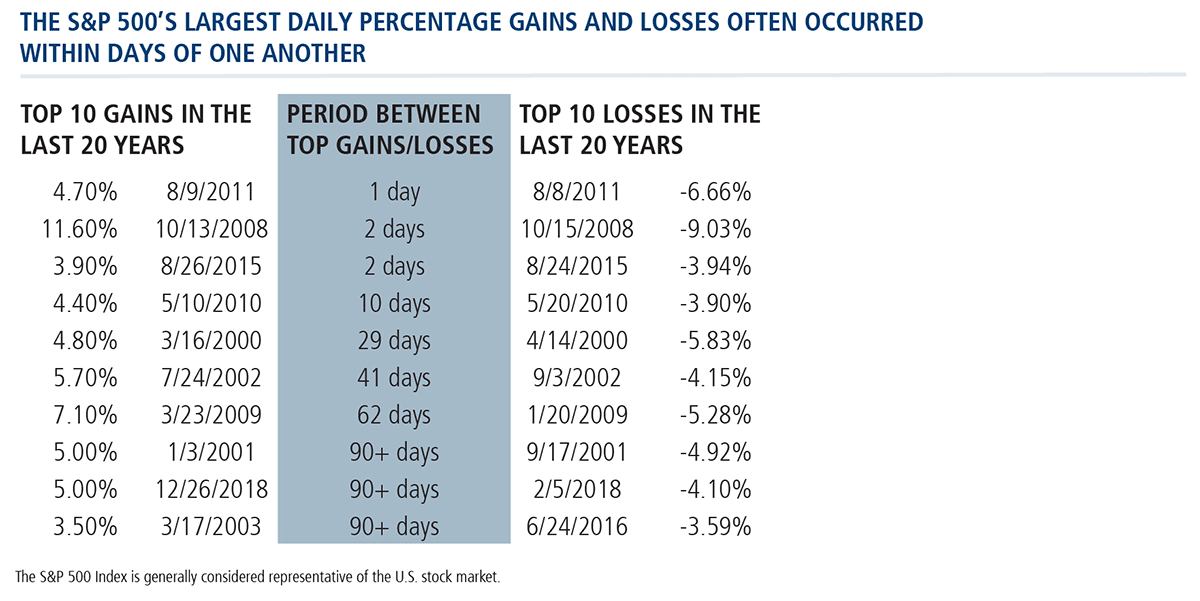
It's not unusual for a year's best gains to occur within days and weeks of the year's deepest losses. The table below takes the point to the extreme—three of the S&P 500’s largest daily percentage gains over the last 20 years took place within days and weeks of deep drawdowns.
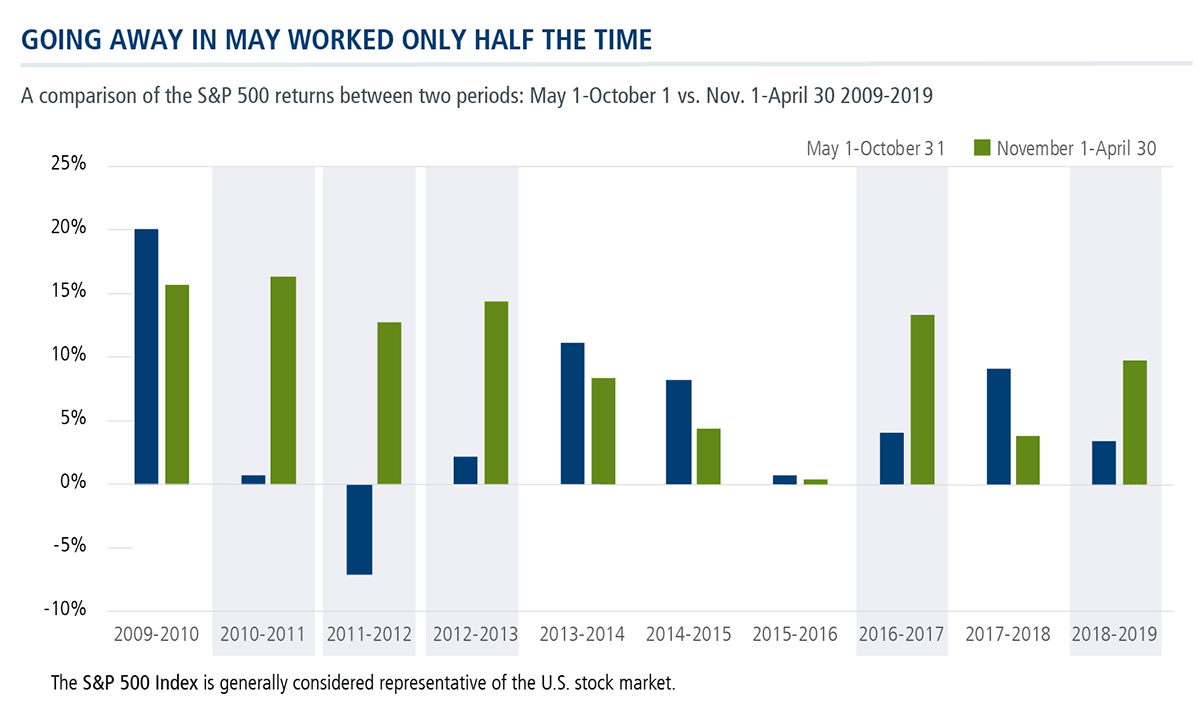
Historical performance data just doesn’t support an overall plan to sit out part of the year. Since 1928 the S&P has gained, on average, about 5% from November through April while adding less than half of that—2%—from May through October, according to FactSet data.
In the shorter 10-year period shown below, the S&P outperformed from November to April just half of the time or five out of the last 10 years. (Of course, with the 2008-2009 global economic crisis and the quantitative easing that was implemented in response, some would argue that the previous decade was an anomaly.)
Your Potential De-Risking Options
In and of itself, "Sell in May and go away" is less relevant to mutual fund investors, who seek to build wealth by remaining invested over market cycles, let alone calendar years.
Advisors know all of this. But, let’s say that you agree with your client that it’s time to de-risk—even if it means surrendering any potential for further equity gains from May through October.
Let’s look at your potential options. You could move your clients to:
- Cash/money markets, which currently offer low yields, far less than the historical 2% cited above during the May-October period over the last 10 years.
- Short-term or intermediate-term fixed income to provide some return, but again well below 2%.
These options do little to mitigate the risk of market timing. They still require you to pick the top (when to exit equities in May) and when to buy back in. Few succeed at getting both decisions right.
We suggest you have another option—don’t leave equities, hedge them using Calamos Hedged Equity Fund (CIHEX). CIHEX seeks to hedge equity downside, dampen volatility and still provide exposure to equity markets in the event of a May to October rally.
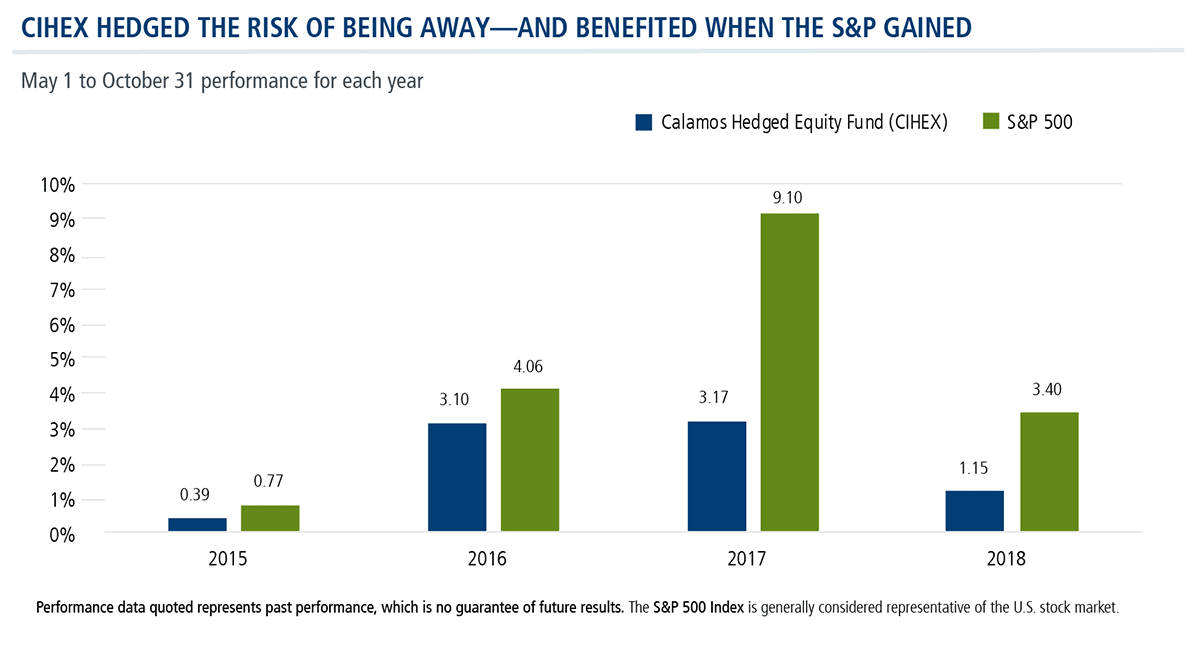
The graph below compares the May to October performance of cash and short-term fixed income over the last 10 years. Investors sitting out six months of the year missed significant S&P gains.

Now here’s how CIHEX—whose May to November performance history starts in 2015—would have been the better alternative for those seeking to de-risk. When the S&P moved, CIHEX participated.
In summary, for clients with long-term investment objectives, we don’t advocate portfolio moves triggered by the month of the year. However, in those instances (and this year may prompt more of them) when the instinct is to “go away,” CIHEX is a long-leaning equity alternative to getting completely out of the market.
Financial advisors, for additional information talk to your Calamos Investment Consultant at 888-571-2567 or caminfo@calamos.com.
Click here to view CIHEX's standardized performance.
Before investing, carefully consider the fund’s investment objectives, risks, charges and expenses. Please see the prospectus and summary prospectus containing this and other information which can be obtained by calling 1-866-363-9219. Read it carefully before investing.
Opinions and estimates offered constitute our judgment and are subject to change without notice, as are statements of financial market trends, which are based on current market conditions. We believe the information provided here is reliable, but do not warrant its accuracy or completeness. This material is not intended as an offer or solicitation for the purchase or sale of any financial instrument. The views and strategies described may not be suitable for all investors. This material has been prepared for informational purposes only, and is not intended to provide, and should not be relied on for, accounting, legal or tax advice. References to future returns are not promises or even estimates of actual returns a client portfolio may achieve. Any forecasts contained herein are for illustrative purposes only and are not to be relied upon as advice or interpreted as a recommendation.
Active management does not guarantee investment returns or eliminate the risk of loss. It should not be assumed that any securities mentioned in this recording will be profitable or experience equal performance in the future.
Important Risk Information. An investment in the Fund(s) is subject to risks, and you could lose money on your investment in the Fund(s). There can be no assurance that the Fund(s) will achieve its investment objective. Your investment in the Fund(s) is not a deposit in a bank and is not insured or guaranteed by the Federal Deposit Insurance Corporation (FDIC) or any other government agency. The risks associated with an investment in the Fund(s) can increase during times of significant market volatility. The Fund(s) also has specific principal risks, which are described below. More detailed information regarding these risks can be found in the Fund’s prospectus.
Alternative investments may not be suitable for all investors, and the risks of alternative investments vary based on the underlying strategies used. Many alternative investments are highly illiquid, meaning that you may not be able to sell your investment when you wish to.
Some of the risks associated with investing in alternatives may include hedging risk – hedging activities can reduce investment performance through added costs; derivative risk – derivatives may experience greater price volatility than the underlying securities; short sale risk – investments may incur a loss without limit as a result of a short sale if the market value of the security increases; interest rate risk – loss of value for income securities as interest rates rise; credit risk – risk of the borrower to miss payments; liquidity risk – low trading volume may lead to increased volatility in certain securities; non-U.S. government obligation risk – non-U.S. government obligations may be subject to increased credit risk; portfolio selection risk – investment managers may select securities that fare worse than the overall market.
The principal risks of investing in the Calamos Hedged Equity Fund include: covered call writing risk, options risk, equity securities risk, correlation risk, mid-sized company risk, interest rate risk, credit risk, liquidity risk, portfolio turnover risk, portfolio selection risk, foreign securities risk, American depository receipts, and REITs risks. As of March 1, Calamos Hedged Equity Income Fund’s name has been changed to Calamos Hedged Equity Fund.
801576 519
Archived material may contain dated performance, risk and other information. Current performance may be lower or higher than the performance quoted in the archived material. For the most recent month-end performance information, please CLICK HERE. Archived material may contain dated opinions and estimates based on our judgment and are subject to change without notice, as are statements of financial market trends, which are based on current market conditions at the time of publishing. We believed the information provided here was reliable, but do not warrant its accuracy or completeness. This material is not intended as an offer or solicitation for the purchase or sale of any financial instrument. The views and strategies described may not be suitable for all investors. This material has been prepared for informational purposes only, and is not intended to provide, and should not be relied on for, accounting, legal or tax advice. References to future returns are not promises or even estimates of actual returns a client portfolio may achieve. Any forecasts contained herein are for illustrative purposes only and are not to be relied upon as advice or interpreted as a recommendation.
Performance data quoted represents past performance, which is no guarantee of future results. Current performance may be lower or higher than the performance quoted. The principal value and return of an investment will fluctuate so that your shares, when redeemed, may be worth more or less than their original cost. Performance reflected at NAV does not include the Fund’s maximum front-end sales load. Had it been included, the Fund’s return would have been lower. For the most recent month-end fund performance information visit www.calamos.com.
Archived material may contain dated performance, risk and other information. Current performance may be lower or higher than the performance quoted in the archived material. For the most recent month-end fund performance information visit www.calamos.com. Archived material may contain dated opinions and estimates based on our judgment and are subject to change without notice, as are statements of financial market trends, which are based on current market conditions at the time of publishing. We believed the information provided here was reliable, but do not warrant its accuracy or completeness. This material is not intended as an offer or solicitation for the purchase or sale of any financial instrument. The views and strategies described may not be suitable for all investors. This material has been prepared for informational purposes only, and is not intended to provide, and should not be relied on for, accounting, legal or tax advice. References to future returns are not promises or even estimates of actual returns a client portfolio may achieve. Any forecasts contained herein are for illustrative purposes only and are not to be relied upon as advice or interpreted as a recommendation.
Performance data quoted represents past performance, which is no guarantee of future results. Current performance may be lower or higher than the performance quoted. The principal value and return of an investment will fluctuate so that your shares, when redeemed, may be worth more or less than their original cost. Performance reflected at NAV does not include the Fund’s maximum front-end sales load. Had it been included, the Fund’s return would have been lower.
Archived on May 13, 2020