High Yield and Investment Grade Corporates: What’s Suggested by Duration Extremes?

This post was written by Christian Brobst, Calamos Vice President, Portfolio Specialist.

As the year draws to a close, we’ll call your attention to two extremes in the duration of high yield and investment grade corporate bonds that you may want to consider as you position your clients’ fixed income allocations for 2018.

Duration in investment grade credit has never been higher since 1993, and duration in high yield credit has never been lower.

duration: investment grade corporate vs high yield

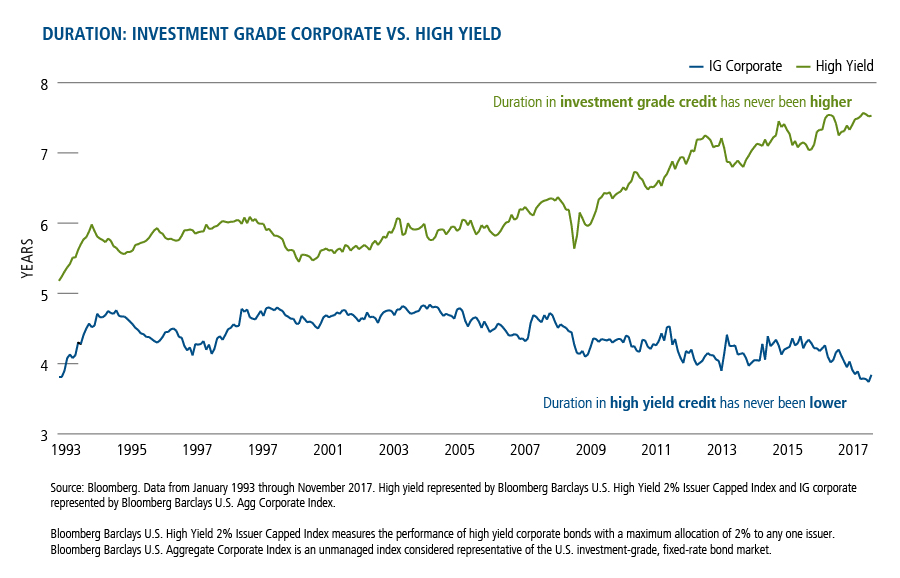
What could cause such divergent trends? The answer is largely supply-driven.

High Yield Market Has Been Contracting

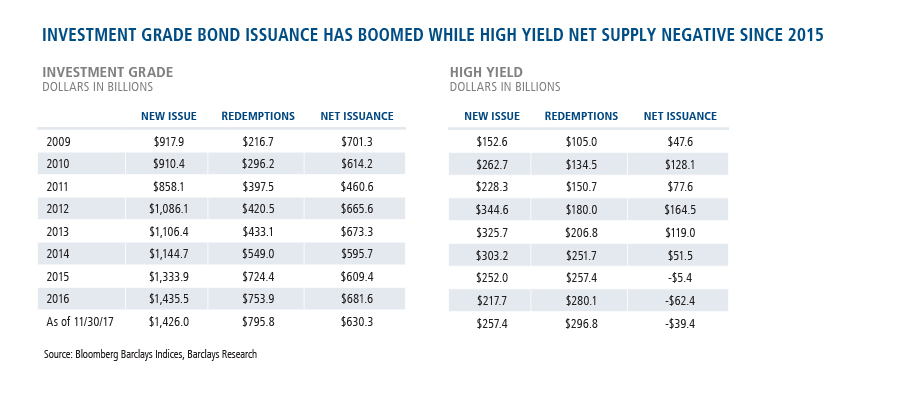
While anecdotes abound of irresponsible corporate borrowing and debt-fueled shareholder friendly activity, the reality is that net supply in the high yield market has been negative since 2015. This implies that redemptions of outstanding debt by companies is outpacing the issuance of new bonds. At -$39.4B YTD through November 30, net issuance was on pace to finish the year at -$43.0B. While this represents an uptick from the -$62.4B in 2016, it is only the fourth annual contraction in the size of the high yield market since 1998.

The lower level of supply has the effect of shortening the duration of the overall high yield market as outstanding issuance ages and new issues do not contain enough duration to replenish the aging debt.

investment grade bond issuance has boomed while high yield net supply negative since 2015

The Boom in Investment Grade Corporates

Meanwhile, investment grade corporate debt issuance has been robust with an average annual net issuance total of $626.1B since 2009. The 2017 total through November 30 stood at $630.3B, on pace to finish the year at $687.6B. That would be the second highest total since 1993.

Moreover, as the term premium has been declining in the form of a flattening curve, companies have continued to “term-out” debt in the form of longer maturity fixed-rate issuance. As this issuer behavior has continued, the duration of the investment grade corporate bond market has continued to extend.

What Does the Divergence Mean?

Duration is a measure of risk for fixed income portfolios, it is an estimate of how much the value of a bond portfolio will change for a given change in yield. Spread duration is an estimate of how much the value of a bond portfolio will change for a given change in spreads. A lower overall duration implies a lower spread duration.

As such, this data indicates that there is less spread duration risk in the high yield market, and more spread duration risk in the investment grade market than there has been since 1993.

Credit markets have had a strong 2017 across ratings categories, and we continue to be constructive on both investment grade and high yield credit for 2018 while recognizing that there will be limited opportunity for broad-based spread tightening from current levels. We continue our focus on uncovering value in out-of-favor sectors through bond-by-bond fundamental research.

Duration management is a piece of the argument to be made in favor of active management of fixed income portfolios.

Advisors, for more information, please talk to your Calamos Investment Consultant at 888-571-2567 or email caminfo@calamos.com.


    Before investing carefully consider the fund’s investment objectives, risks, charges and expenses. Please see the prospectus and summary prospectus containing this and other information which can be obtained by calling 1-866-363-9219. Read it carefully before investing.

    Opinions and estimates offered constitute our judgment and are subject to change without notice, as are statements of financial market trends, which are based on current market conditions. We believe the information provided here is reliable, but do not warrant its accuracy or completeness. This material is not intended as an offer or solicitation for the purchase or sale of any financial instrument. The views and strategies described may not be suitable for all investors. The opinions and views of third parties do not represent the opinions or views of Calamos Investments LLC. Opinions are subject to change due to changes in the market, economic conditions or changes in the legal and/or regulatory environment and may not necessarily come to pass. This information is provided for informational purposes only and should not be considered tax, legal, or investment advice. References to specific securities, asset classes and financial markets are for illustrative purposes only and are not intended to be, and should not be interpreted as, recommendations.

    Fixed income securities entail interest rate risk. High yield securities are also subject to increased credit risk and liquidity risk.

    Bloomberg Barclays U.S. High Yield 2% Issuer Capped Index measures the performance of high yield corporate bonds with a maximum allocation of 2% to any one issuer.

    Bloomberg Barclays U.S. Aggregate Corporate Index is an unmanaged index considered representative of the U.S. investment-grade, fixed-rate bond market.

    800956 12/17

    Archived material may contain dated performance, risk and other information. Current performance may be lower or higher than the performance quoted in the archived material. For the most recent month-end performance information, please CLICK HERE. Archived material may contain dated opinions and estimates based on our judgment and are subject to change without notice, as are statements of financial market trends, which are based on current market conditions at the time of publishing. We believed the information provided here was reliable, but do not warrant its accuracy or completeness. This material is not intended as an offer or solicitation for the purchase or sale of any financial instrument. The views and strategies described may not be suitable for all investors. This material has been prepared for informational purposes only, and is not intended to provide, and should not be relied on for, accounting, legal or tax advice. References to future returns are not promises or even estimates of actual returns a client portfolio may achieve. Any forecasts contained herein are for illustrative purposes only and are not to be relied upon as advice or interpreted as a recommendation.

    Performance data quoted represents past performance, which is no guarantee of future results. Current performance may be lower or higher than the performance quoted. The principal value and return of an investment will fluctuate so that your shares, when redeemed, may be worth more or less than their original cost. Performance reflected at NAV does not include the Fund’s maximum front-end sales load. Had it been included, the Fund’s return would have been lower. For the most recent month-end fund performance information visit www.calamos.com.

    Archived material may contain dated performance, risk and other information. Current performance may be lower or higher than the performance quoted in the archived material. For the most recent month-end fund performance information visit www.calamos.com. Archived material may contain dated opinions and estimates based on our judgment and are subject to change without notice, as are statements of financial market trends, which are based on current market conditions at the time of publishing. We believed the information provided here was reliable, but do not warrant its accuracy or completeness. This material is not intended as an offer or solicitation for the purchase or sale of any financial instrument. The views and strategies described may not be suitable for all investors. This material has been prepared for informational purposes only, and is not intended to provide, and should not be relied on for, accounting, legal or tax advice. References to future returns are not promises or even estimates of actual returns a client portfolio may achieve. Any forecasts contained herein are for illustrative purposes only and are not to be relied upon as advice or interpreted as a recommendation.

    Performance data quoted represents past performance, which is no guarantee of future results. Current performance may be lower or higher than the performance quoted. The principal value and return of an investment will fluctuate so that your shares, when redeemed, may be worth more or less than their original cost. Performance reflected at NAV does not include the Fund’s maximum front-end sales load. Had it been included, the Fund’s return would have been lower.

    Archived on December 21, 2018