Give Your Clients An Edge When High Yield Spreads Widen
November 2, 2017
High yield spreads could remain narrow for an extended period, as we discussed in August (see post). But when they do begin to widen, an actively managed, risk-aware approach could potentially have the edge over an index-based allocation.
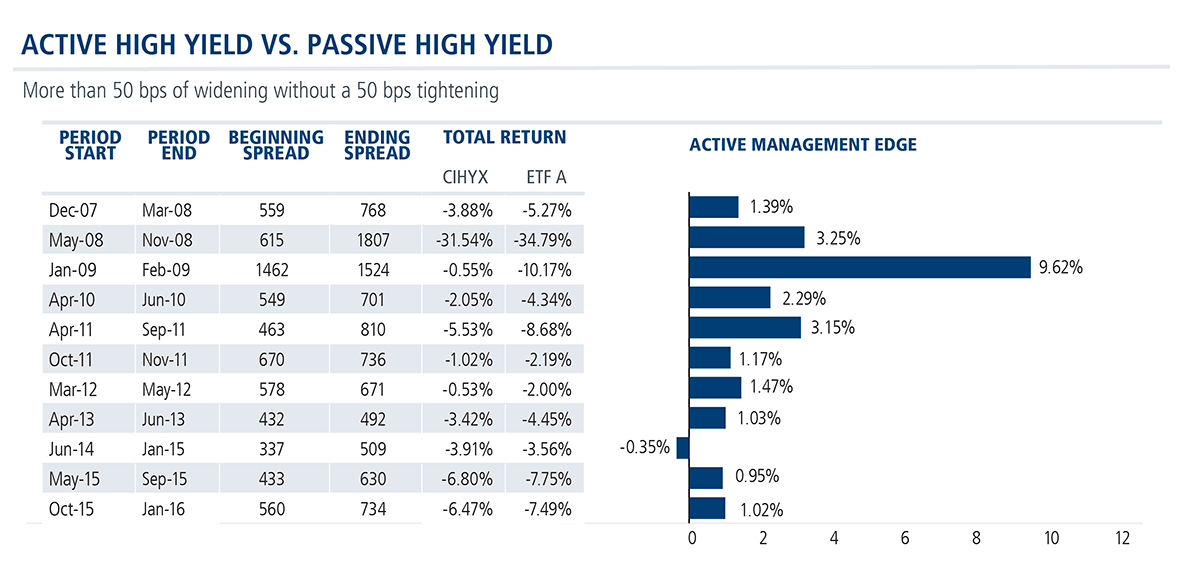
Below we compare the performance results of one of the oldest and largest high yield ETFs with Calamos High Income Opportunities Fund (CIHYX) the 11 times when high yield spreads widened at least 50 basis points over the last 10 years. The periods shown are from the start of the period until the end of the period, when spreads tightened 50 bps.
CIHYX outperformed in all but one period, with an average outperformance of 2.27%.

The explanation for the consistent outperformance, says Christian Brobst, Calamos Vice President, Portfolio Specialist, is the active management of CIHYX. While ETF A is a basket of index-determined securities, the CIHYX portfolio is constructed “bond by bond” based on decisions supported by fundamental research informed by macroeconomic insights.
Further, the investment process is “benchmark aware, not benchmark constrained,” explains Matt Freund, CFA, Co-Chief Investment Officer and Head of Fixed Income Strategies. “When our proprietary credit research leads us to what we consider to be a ‘best idea,’ we’re more than willing to establish a meaningful overweight. Conversely, we’ll hold meaningful underweights (or often nothing at all) in names where credit risks are not rewarded.”
For more on the Calamos active management edge, talk to your Calamos Investment Consultant at 888-571-2567 or caminfo@calamos.com.
Before investing, carefully consider the fund’s investment objectives, risks, charges and expenses. Please see the prospectus and summary prospectus containing this and other information which can be obtained by calling 1-866-363-9219. Read it carefully before investing.

Opinions, estimates, forecasts, and statements of financial market trends that are based on current market conditions constitute our judgment and are subject to change without notice. The views and strategies described may not be suitable for all investors. References to specific securities, asset classes and financial markets are for illustrative purposes only and are not intended to be, and should not be interpreted as, recommendations.
An investment in the Fund(s) is subject to risks, and you could lose money on your investment in the Fund(s). There can be no assurance that the Fund(s) will achieve its investment objective. Your investment in the Fund(s) is not a deposit in a bank and is not insured or guaranteed by the Federal Deposit Insurance Corporation (FDIC) or any other government agency. The risks associated with an investment in the Fund(s) can increase during times of significant market volatility. The Fund(s) also has specific principal risks, which are described below. More detailed information regarding these risks can be found in the Fund’s prospectus.
The principal risks of investing in the Calamos High Income Opportunities Fund include: high yield risk consisting of increased credit and liquidity risks, convertible securities risk consisting of the potential for a decline in value during periods of rising interest rates and the risk of the borrower to miss payments, synthetic convertible instruments risk, interest rate risk, credit risk, liquidity risk, portfolio selection risk, foreign securities risk and liquidity risk.
The Bloomberg Barclays U.S. High Yield 2% Issuer Capped Index measures the performance of high yield corporate bonds with a maximum allocation of 2% to any one issuer.
The BofA Merrill Lynch BB-B U.S. High Yield Constrained Index contains all securities in The BofA Merrill Lynch U.S. High Yield Index rated BA1 through B3, based on an average of Moody’s, S&P and Fitch, but caps issuer exposure at 2%. Index constituents are capitalization-weighted, based on their current amount outstanding, provided the total allocation to an individual issuer does not exceed 2%.
Morningstar High Yield Bond Category represents funds with at least 65% of assets in bonds rated below BBB. 30-Day SEC Yield reflects the dividends and interest earned by the Fund during the 30-day period ended as of the date stated after deducting the Fund’s expenses for that same period.
Unmanaged index returns assume reinvestment of any and all distributions and, unlike fund returns, do not reflect fees, expenses or sales charges. Investors cannot invest directly in an index.
NOT FDIC INSURED | MAY LOSE VALUE | NO BANK GUARANTEE
800875 1017


