TIPS vs. Market Neutral Income Funds
September 16, 2016
Updated January 20, 2017
At the start of 2017, we continue to hear from advisors who are weighing their options for hedging risks in their clients’ fixed income portfolios. Specifically, we’ve been fielding more questions about the comparative benefits of Treasury Inflation Protected Securities (TIPS) and market neutral income funds.
TIPS have appeal now as investors seek to protect against unexpected upward pressure on inflation resulting from the growth initiatives of the Trump administration, a transition to higher interest rates, rising oil prices and increasing wages.
TIPS returns are based on changes in real yields, changes in inflation, and supply and demand. In the first half of 2016, declining real yields drove up TIPS prices which contributed to TIPS total return. In the second half of 2016, increasing inflation expectations, as measured by the breakeven inflation rate charted below, have increased the demand for TIPS, despite the rise in interest rates.
How TIPS Work
TIPS are bonds issued by the U.S Treasury with a fixed coupon and fixed maturity date. Unlike traditional bonds, they have a principal value that is adjusted to keep pace with inflation--measured by changes in the CPI-U (the non-seasonally adjusted CPI for All Urban Consumers). Since coupon payments are calculated as a percentage of principal, the principal adjustment results in a corresponding coupon adjustment. The inflation adjustment provides the protection within the bonds against a spike in unexpected inflation.
Benefits of TIPS
TIPS can be used as a:
- Fixed income portfolio diversifier: Their return stream is less correlated with other fixed income sectors due to their principal adjustments.
- Low volatility inflation hedge: This is compared to other asset classes that provide an indirect inflation hedge (equities, commodities and real estate).
Drawbacks of TIPS
But be aware, too, of TIPS’ drawbacks:
- Duration risk: TIPS are highly sensitive to changes in interest rates. While the price of TIPS return is based on changes in real rates, not nominal rates, real and nominal rates often move together. Changes in real yields have the same directional relationship with bond prices, as do changes in nominal yields. Although positive inflation adjustments will cushion the price impact from an increase in rates, the majority of the duration risk remains.
Investors in TIPS will be compensated during periods of positive unexpected inflation. If inflation does not rise, investors in TIPS are taking on quite a bit of duration risk. Only long-term bonds have greater durations than TIPS. As shown in the illustration below using exchange-traded funds (ETFs) as proxies for different bond maturities, TIPS have greater duration than intermediate term bonds. However, investors are being compensated similar to short term bonds.
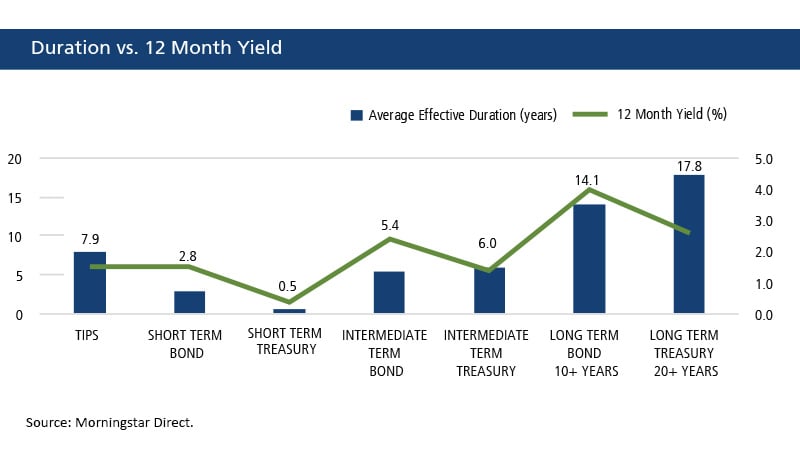
Data as of 12/31/2016.
Calamos Market Neutral Income Fund
The fund’s core market strategies include covered call writing and convertible arbitrage. Together, these strategies intend to provide the fund with an enhanced potential for risk-managed returns due to their differing responses to volatility.
FUND TICKER SYMBOLS
A Shares
C Shares
I Shares
CVSIX
CVSCX
CMNIX
GROSS EXPENSE RATIO
A Shares
C Shares
I Shares
1.23%
1.98%
0.98%
- There’s a difference between an inflation surprise and expected inflation. TIPS provide protection from unexpected increases in inflation and not just rising inflation. If expectations are that inflation will be rising, these prices will already be priced into the bond.
- Besides changes in interest rates, TIPS are highly sensitive to moves in the fixed income market when measured by beta, correlation, and down capture ratios relative to the Bloomberg Barclays U.S. Aggregate Bond index.
For some, Calamos Market Neutral Income Fund (CMNIX) may be a preferred alternative to TIPS.
- It can be used as a fixed income portfolio diversifier. Depending on the time period, CMNIX had low to negative return correlations to the broad fixed income market (using the Barclays U.S. Aggregate Bond Index as the fixed income market proxy) as its returns are generated from diverse sources unrelated to common fixed income exposures.
- Its underlying equity exposure can provide an indirect hedge against inflation. Corporate earnings increase with inflation, which flows through to stock prices.
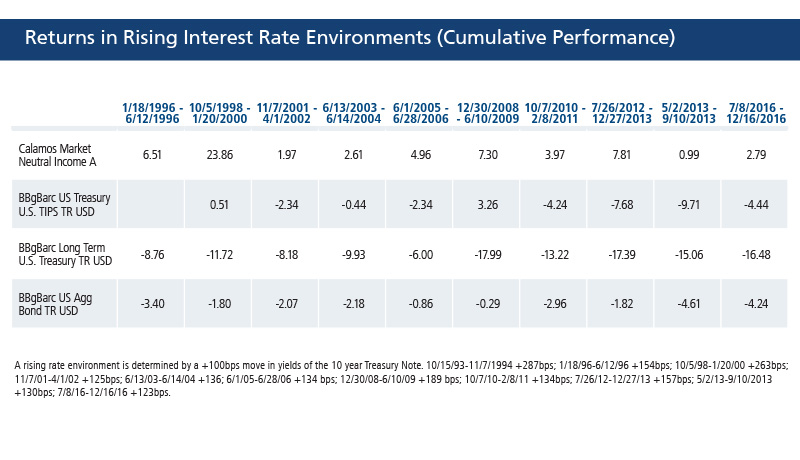
- It has demonstrated resilience when interest rates rise.
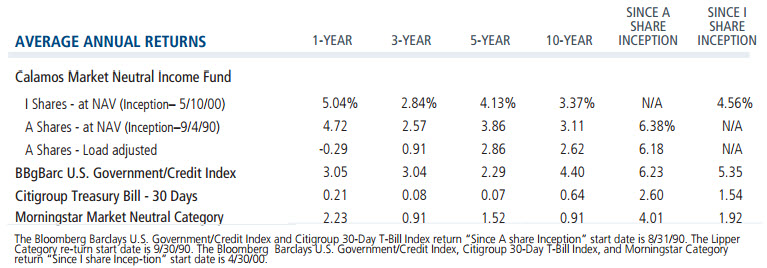
Performance data quoted represents past performance, which is no guarantee of future results. Current performance may be lower or higher than the performance quoted. The principal value and investment return of an investment will fluctuate so that your shares, when redeemed, maybe worth more or less than their original cost. You can obtain performance data current to the most recent month end by visiting http://advisor.morningstar.com/familyinfo.asp. Average annual total return measures net investment income and capital gain or loss from portfolio investments as an annualized average. All performance shown assumes reinvestment of dividends and capital gains distributions. Performance shown is for Class A (or equivalent) shares at net asset value and do not take into account any sales loads. Performance would have been reduced had such loads been included. The Funds offer multiple other share classes, the performance of which may vary.
- It had lower volatility compared to the Morningstar US OE Inflation Protected Category.
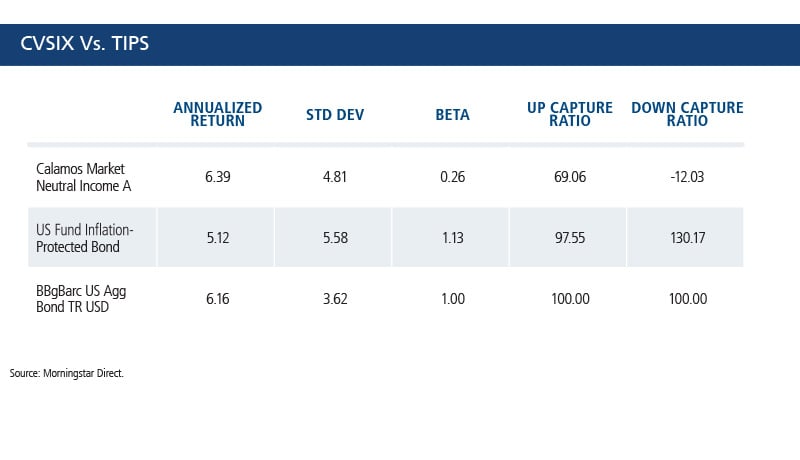
Data from CVSIX inception date of 9/4/90 through 12/31/2016.
Financial advisors, contact your investment consultant for access to Calamos portfolio analytics consulting.
Data as of 12/31/2016.
Source: Morningstar Direct.
Before investing, carefully consider the fund’s investment objectives, risks, charges and expenses. Please see the prospectus and summary prospectus containing this and other information which can be obtained by calling 1-866-363-9219. Read it carefully before investing.
Performance data quoted represents past performance, which is no guarantee of future results. Current performance may be lower or higher than the performance quoted. The principal value and return of an investment will fluctuate so that your shares, when redeemed, may be worth more or less than their original cost. Performance reflected at NAV does not include the Fund’s maximum front-end sales load of 4.75%. Had it been included, the Fund’s return would have been lower. For the most recent month-end fund performance information visit www.Calamos.com.
See the Calamos Market Neutral Income Fund profile for the most recent performance.
ETFs used for the following proxies are as follows: TIPS, iShares TIPS bond; Short-term bond, Vanguard Short-Term Bond ETF; Short-term Treasury, iShares Short Treasury Bond; Intermediate Term Bond, iShares Core US Aggregate Bond; Intermediate Term Treasury, iShares Core US Treasury Bond; Long Term Bond, iShares Core 10+ Year Bond; Long-Term Treasury, iShares 20+ Year Treasury Bond.
The Bloomberg Barclays U.S. Aggregate Bond Index covers the U.S.- denominated, investment-grade, fixed-rate, taxable bond market of SEC-registered securities. The index includes bonds from the Treasury, Government-Related, Corporate, MBS (agency fixed-rate and hybrid ARM passthroughs), ABS, and CMBS sectors.
The Bloomberg Barclays U.S. Treasury Inflation Protected Securities (TIPS) Index includes all publicly issued, U.S. Treasury inflation-protected securities that have at least one year remaining to maturity, are rated investment grade, and have $250 million or more of outstanding face value.
The Bloomberg Barclays Capital Long U.S. Treasury Index includes all publicly issued, U.S. Treasury securities that have a remaining maturity of 10 or more years, are rated investment grade, and have $250 million or more of outstanding face value.
Bloomberg Barclays U.S. Government/Credit Index comprises long-term government and investment grade corporate debt securities and is generally considered representative of the performance of the broad U.S. bond market. Unlike convertible bonds, U.S. Treasury bills are backed by the full faith and credit of the U.S. government and offer a guarantee as to the timely repayment of principal and interest. Citigroup 30-Day T-Bill Index is generally considered representative of the performance of short-term money market instruments. Morningstar Market Neutral Category represent funds that attempt to eliminate the risks of the market by holding 50% of assets in long positions in stocks and 50% of assets in short positions.
The principal risks of investing in Calamos Market Neutral Income Fund include: convertible securities risk, synthetic convertible instruments risk, convertible hedging risk, covered call writing risk, options risk, short sale risk, interest rate risk, credit risk, high yield risk, liquidity risk and portfolio selection risk.
Beta. A common measure of historic volatility, beta measures how much of an investment’s performance is attributable to market-wide factors (such as a rising stock market). An investment that goes up or down as much as a broad market measure has a beta of 1. An investment that captures only half of the market’s movements would have a beta of 0.5.
Standard Deviation. Measures the overall risk of a fund.
Upside capture ratio measures a manager’s performance in up markets relative to the named index itself. It is calculated by taking the security’s upside capture return and dividing it by the benchmark’s upside capture return.
Downside capture ratio measures manager’s performance in down markets as defined by the named index.
The opinions referenced are as of the date of publication and are subject to change due to changes in the market or economic conditions and may not necessarily come to pass. Information contained herein is for informational purposes only and should not be considered investment advice.
As a result of political or economic instability in foreign countries, there can be special risks associated with investing in foreign securities, including fluctuations in currency exchange rates, increased price volatility and difficulty obtaining information. In addition, emerging markets may present additional risk due to potential for greater economic and political instability in less developed countries.
Archived material may contain dated performance, risk and other information. Current performance may be lower or higher than the performance quoted in the archived material. For the most recent month-end performance information, please CLICK HERE. Archived material may contain dated opinions and estimates based on our judgment and are subject to change without notice, as are statements of financial market trends, which are based on current market conditions at the time of publishing. We believed the information provided here was reliable, but do not warrant its accuracy or completeness. This material is not intended as an offer or solicitation for the purchase or sale of any financial instrument. The views and strategies described may not be suitable for all investors. This material has been prepared for informational purposes only, and is not intended to provide, and should not be relied on for, accounting, legal or tax advice. References to future returns are not promises or even estimates of actual returns a client portfolio may achieve. Any forecasts contained herein are for illustrative purposes only and are not to be relied upon as advice or interpreted as a recommendation.
Performance data quoted represents past performance, which is no guarantee of future results. Current performance may be lower or higher than the performance quoted. The principal value and return of an investment will fluctuate so that your shares, when redeemed, may be worth more or less than their original cost. Performance reflected at NAV does not include the Fund’s maximum front-end sales load. Had it been included, the Fund’s return would have been lower. For the most recent month-end fund performance information visit www.calamos.com.
Archived material may contain dated performance, risk and other information. Current performance may be lower or higher than the performance quoted in the archived material. For the most recent month-end fund performance information visit www.calamos.com. Archived material may contain dated opinions and estimates based on our judgment and are subject to change without notice, as are statements of financial market trends, which are based on current market conditions at the time of publishing. We believed the information provided here was reliable, but do not warrant its accuracy or completeness. This material is not intended as an offer or solicitation for the purchase or sale of any financial instrument. The views and strategies described may not be suitable for all investors. This material has been prepared for informational purposes only, and is not intended to provide, and should not be relied on for, accounting, legal or tax advice. References to future returns are not promises or even estimates of actual returns a client portfolio may achieve. Any forecasts contained herein are for illustrative purposes only and are not to be relied upon as advice or interpreted as a recommendation.
Performance data quoted represents past performance, which is no guarantee of future results. Current performance may be lower or higher than the performance quoted. The principal value and return of an investment will fluctuate so that your shares, when redeemed, may be worth more or less than their original cost. Performance reflected at NAV does not include the Fund’s maximum front-end sales load. Had it been included, the Fund’s return would have been lower.
Archived on September 16, 2017