The Key to CPLIX’s 2022 Success: Knowing When and Where to Lean into Equity Risk
December 7, 2022
To Co-CIO and Senior Portfolio Manager Michael Grant, the year-to-date performance of Calamos Phineus Long/Short Fund (CPLIX) is a classic illustration of the fund’s strategy since its founding 20 years ago.
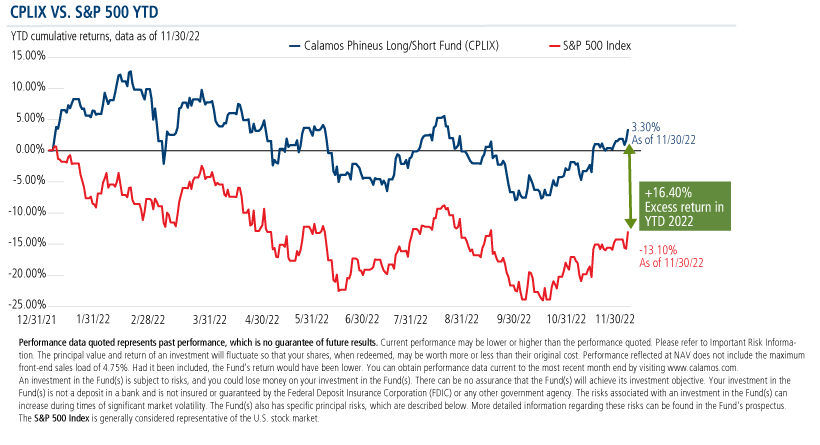
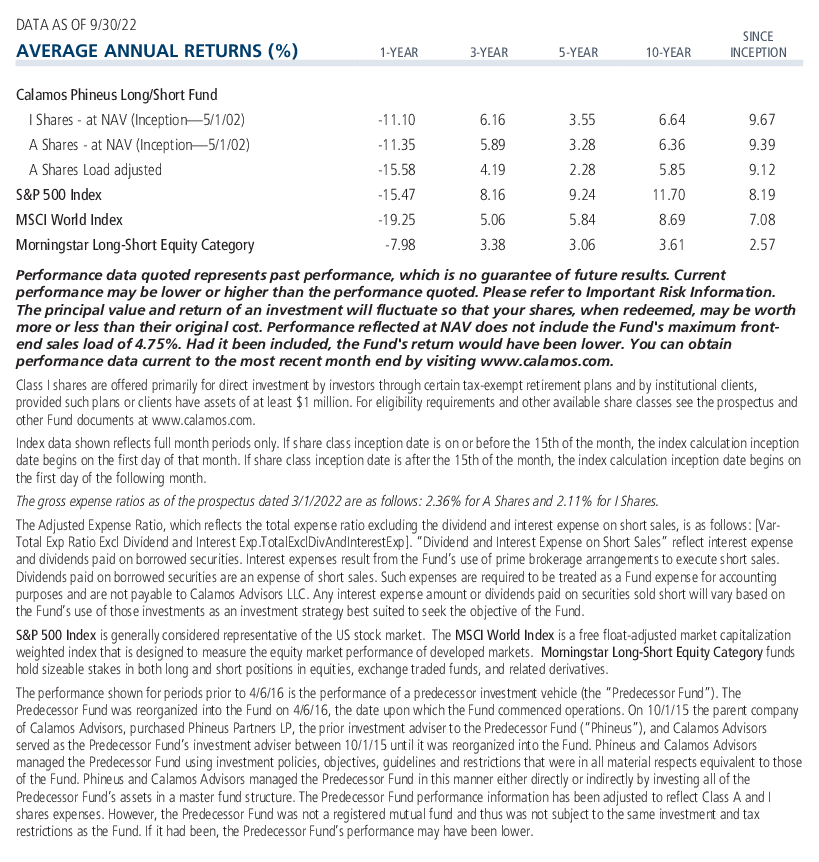
The fund has meaningfully outperformed in a year when its benchmark the S&P 500 Index plunged -13.10% and its peers in the Morningstar Long-Short Equity category declined -5.62%) through November 30. With its 3.30% return through 11/30, CPLIX is one of just 6.6% of actively managed open-end funds that have generated a positive return year-to-date, and one of just 18 funds in its peer group.
In fact, CPLIX has bested the S&P 500 since inception, with an average net equity exposure of less than 30%, Grant noted in a recent meeting with investment professionals. “How can you get competitive equity returns without being fully invested? That might sound like a disconnect,” he acknowledged. “We’ve been successful in understanding when and where to lean into equity risk.”
According to Grant, investors in 2022 emerged from “a bull market in stupidity,” heavily invested as they were in the long duration parts of the market, including concept names (see related post).
“The first reason we’re positive year to date is that, starting in December 2021, we were out of that part of the market in a very big departure from the major benchmarks. Our decisions are driven by an understanding of where the balance of the risks are in the market.”
“Like with any strategy,” Grant said, “we need to be in the right places and not in the wrong places.”
The result of the fund’s active management this year has produced a stunning performance advantage versus the decline of the S&P 500 Index (-13.10%) and the Morningstar Long-Short Equity category (-5.62%) through November 30.
Volatility is what “creates all the problems for client behavior,” according to Grant. “If we can succeed in delivering competitive equity outcomes by cutting off volatility tails, clients tend to behave in a much more favorable way.” (For more on the argument for keeping clients invested, see our volatility chartbook.)
As he looks ahead to 2023, Grant maintains a perspective that’s more optimistic than consensus. With the Fed focused on inflation, investors have been concerned that the Fed would overtighten. But, inflation is a lagging measure. Since Fed Chairman Jerome Powell has acknowledged the dramatic slowdown in inflation, Grant expects Powell to shift to be “forward-looking, not backward looking.”
“We are entering a different period for markets in the sense that Fed policy will no longer be incrementally bearish,” said Grant. Every time in the last 30 years when the 10-year US yield has fallen below the fed funds rate, the Fed stopped tightening, he added.
A pause in the Fed hiking may come as early as next week, said Grant. Or, “maybe the Fed looks for another quarter-point increase.”
He doesn’t look for rate cuts next year, however.
The consensus believes that equities haven’t bottomed because the economy is heading into a recession next year that will result in a decline in earnings. But, said Grant, “Our view is that nominal GDP will remain firmer through the course of next year and we will not see a recession, and therefore financial asset prices will be in a trading range well through the course of next year. Recession will come later and be less severe than is embedded in the consensus view.”
Grant commented on the reversal of fortunes for many companies since the pandemic. Pandemic winners (technology, for example) are now pandemic losers. Beyond technology, the rate of growth in earnings is slowing but not collapsing.
“Yes, there’s a slowdown happening in the economy but big chunks of the service economy only emerged from the recession in the spring of this year, and there’s a deep well of pent-up demand that we can draw from,” he said.
When inflation and not deflation is the problem, it’s hard for the corporate sector to be impacted negatively, according to Grant. Also, there is minimal balance sheet stress anywhere in the system, including the consumer, the banking system, the corporate sector. When there’s no balance sheet stress, it’s uncommon to get an earnings decline of more than 10%-15% even in a severe recession, he said.
Grant concluded his remarks with the comment that “the entire investment landscape is being reconstituted. The easy money of the last several years changed expectations.” Eight percent—what was considered a good return prior to 2008—is the likely equity return for the next decade. He also believes investors will need to think beyond the 60% stocks/40% bonds model.
“Investors know that equities is going to be the best asset class because fixed income cannot work the way it has for the last 30 years. But how do I do that in a less correlated, less volatile way? That’s where I think equity alternatives play an important role.”
For more information about Grant’s perspective or about CPLIX, reach out to your Calamos Investment Consultant at 888-571-2567 or caminfo@calamos.com.
Before investing, carefully consider the fund’s investment objectives, risks, charges and expenses. Please see the prospectus and summary prospectus containing this and other information which can be obtained by calling 1-866-363-9219. Read it carefully before investing.
Opinions and estimates offered constitute our judgment and are subject to change without notice, as are statements of financial market trends, which are based on current market conditions. We believe the information provided here is reliable, but do not warrant its accuracy or completeness. This material is not intended as an offer or solicitation for the purchase or sale of any financial instrument. The views and strategies described may not be suitable for all investors. Opinions are subject to change due to changes in the market, economic conditions or changes in the legal and/or regulatory environment and may not necessarily come to pass. This information is provided for informational purposes only and should not be considered tax, legal, or investment advice. References to specific securities, asset classes and financial markets are for illustrative purposes only and are not intended to be, and should not be interpreted as, recommendations.
The S&P 500 Index is generally considered representative of the US stock market.
The principal risks of investing in the Calamos Phineus Long/Short Fund include: equity securities risk consisting of market prices declining in general, short sale risk consisting of potential for unlimited losses, foreign securities risk, currency risk, geographic concentration risk, other investment companies (including ETFs) risk, derivatives risk, options risk, and leverage risk. As a result of political or economic instability in foreign countries, there can be special risks associated with investing in foreign securities, including fluctuations in currency exchange rates, increased price volatility and difficulty obtaining information. In addition, emerging markets may present additional risk due to potential for greater economic and political instability in less developed countries.
Alternative investments may not be suitable for all investors. The fund takes long positions in companies that are expected to outperform the equity markets, while taking short positions in companies that are expected to underperform the equity markets and for hedging purposes. The fund may lose money should the securities the fund is long decline in value or if the securities the fund has shorted increase in value, but the ultimate goal is to realize returns in both rising and falling equity markets while providing a degree of insulation from increased market volatility.
Morningstar Long-Short Equity Category funds hold sizeable stakes in both long and short positions in equities, exchange traded funds, and related derivatives.
Morningstar RatingsTM are based on risk-adjusted returns and are through 11/30/22 for the share class listed and will differ for other share classes. Morningstar ratings are based on a risk-adjusted return measure that accounts for variation in a fund's monthly historical performance (reflecting sales charges), placing more emphasis on downward variations and rewarding consistent performance. Within each asset class, the top 10%, the next 22.5%, 35%, 22.5%, and the bottom 10% receive 5, 4, 3, 2 or 1 star, respectively. Each fund is rated exclusively against US domiciled funds. The information contained herein is proprietary to Morningstar and/or its content providers; may not be copied or distributed; and is not warranted to be accurate, complete or timely. Neither Morningstar nor its content providers are responsible for any damages or losses arising from any use of this information. Source: ©2022 Morningstar, Inc.
Among 178 Long-Short Equity funds. The Fund's risk-adjusted returns based on load-waived Class I Shares had 4 stars for 3 years and 4 stars for 5 years out of 178 and 161 Long-Short Equity Funds, respectively, for the period ended 11/30/2022.
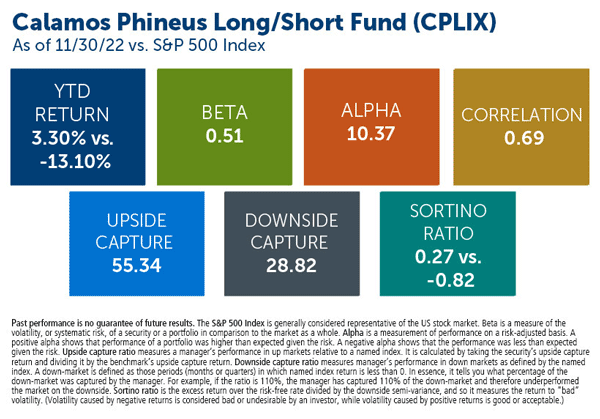
Beta is a measure of the volatility, or systematic risk, of a security or a portfolio in comparison to the market as a whole.
Alpha is a measurement of performance on a risk-adjusted basis. A positive alpha shows that performance of a portfolio was higher than expected given the risk. A negative alpha shows that the performance was less than expected given the risk.
Upside capture ratio measures a manager’s performance in up markets relative to a named index. It is calculated by taking the security’s upside capture return and dividing it by the benchmark’s upside capture return.
Downside capture ratio measures manager’s performance in down markets as defined by the named index. A down-market is defined as those periods (months or quarters) in which named index return is less than 0. In essence, it tells you what percentage of the down-market was captured by the manager. For example, if the ratio is 110%, the manager has captured 110% of the down-market and therefore underperformed the market on the downside.
Sortino ratio is the excess return over the risk-free rate divided by the downside semi-variance, and so it measures the return to “bad” volatility. (Volatility caused by negative returns is considered bad or undesirable by an investor, while volatility caused by positive returns is good or acceptable.)
8320342 1222
Archived material may contain dated performance, risk and other information. Current performance may be lower or higher than the performance quoted in the archived material. For the most recent month-end fund performance information visit www.calamos.com. Archived material may contain dated opinions and estimates based on our judgment and are subject to change without notice, as are statements of financial market trends, which are based on current market conditions at the time of publishing. We believed the information provided here was reliable, but do not warrant its accuracy or completeness. This material is not intended as an offer or solicitation for the purchase or sale of any financial instrument. The views and strategies described may not be suitable for all investors. This material has been prepared for informational purposes only, and is not intended to provide, and should not be relied on for, accounting, legal or tax advice. References to future returns are not promises or even estimates of actual returns a client portfolio may achieve. Any forecasts contained herein are for illustrative purposes only and are not to be relied upon as advice or interpreted as a recommendation.
Performance data quoted represents past performance, which is no guarantee of future results. Current performance may be lower or higher than the performance quoted. The principal value and return of an investment will fluctuate so that your shares, when redeemed, may be worth more or less than their original cost. Performance reflected at NAV does not include the Fund’s maximum front-end sales load. Had it been included, the Fund’s return would have been lower.
Archived on December 07, 2023