Small Caps? Do Your Tax Loss Selling Now and Head into 2023 with CTSIX
November 18, 2022
It’s that wonderful time of the year—this year, especially—to go shopping. More than ready to leave 2022 behind, forward-looking investment professionals are taking stock of their portfolios’ winners and losers. They’re making decisions now about which holdings to take tax losses on and which to bring into 2023, as influenced by their assumptions about growth prospects for the new year.
‘Tis The Tax Loss Selling Season
The market selloff exacted its toll on all equity funds this year. But insult was added to injury as many funds that recently experienced strong performance and inflows today have no choice but to realize capital gains in order to meet outflows. Morningstar’s Small Growth category includes funds that are estimating capital gains of 3%, 4%, and as much as 9% and 12%.
If your forecast provides for small caps to make a strong rebound next year, we have a recommendation for you: Take the losses on your incumbent small cap fund and reallocate to Calamos Timpani Small Cap Growth Fund (CTSIX).
As of October 10, CTSIX was estimated to pay 0% cap gain distributions. Beyond that, the fund is well positioned to make the most of the small cap comeback that Calamos, along with many others, anticipates.
The following charts, presented by Senior Portfolio Manager Brandon Nelson, CFA, at a recent meeting of investment professionals, tell a compelling story.
Small Caps Have Won Over the Long Term
Notwithstanding their deep drawdown year to date, you want small caps in your clients’ portfolios. A large cap-only portfolio historically has not provided the same kind of growth.
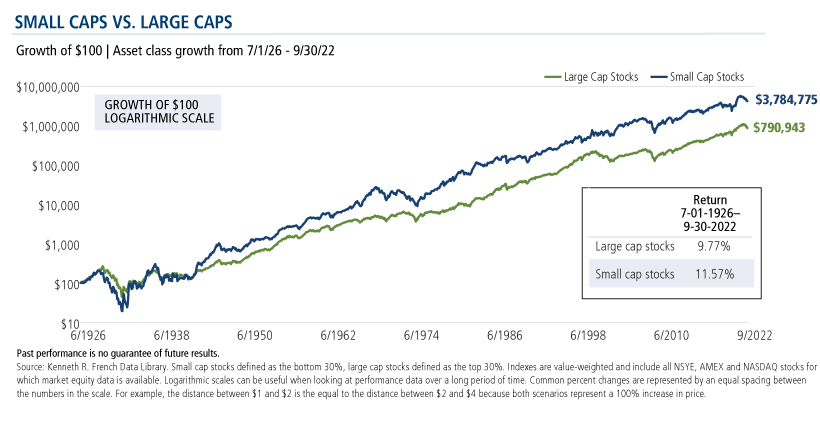
And, by the way, they’ve been quietly outperforming large caps five of the last six months (see the latest Calamos Small Cap Market Snapshot.) “The thesis for small caps to have some traction now is playing out,” commented Nelson.
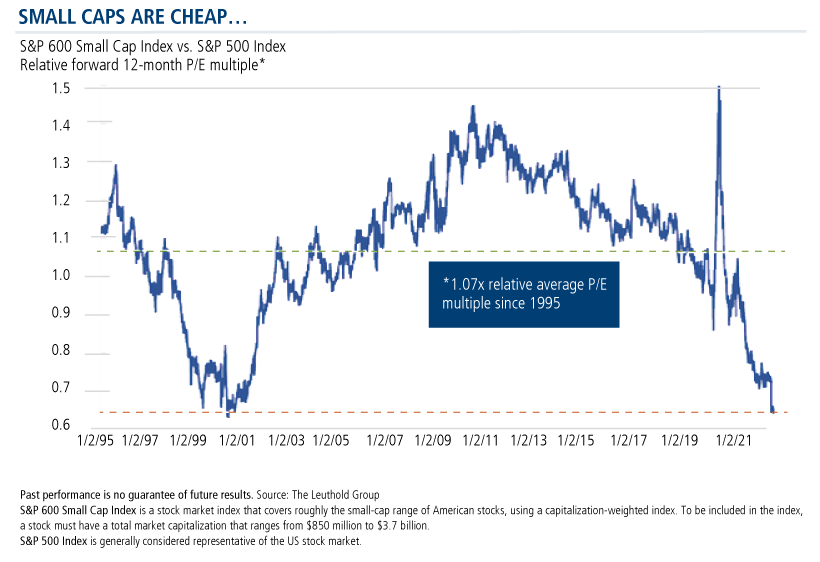
Historically, small caps tend to trade at a 10% premium to large caps but, “look where we are now,” said Nelson. At the end of October, mega caps were trading at 20.3 times earnings while small and microcaps were trading at 13.8 times and 10.7 times, respectively, he said, citing data from The Leuthold Group.
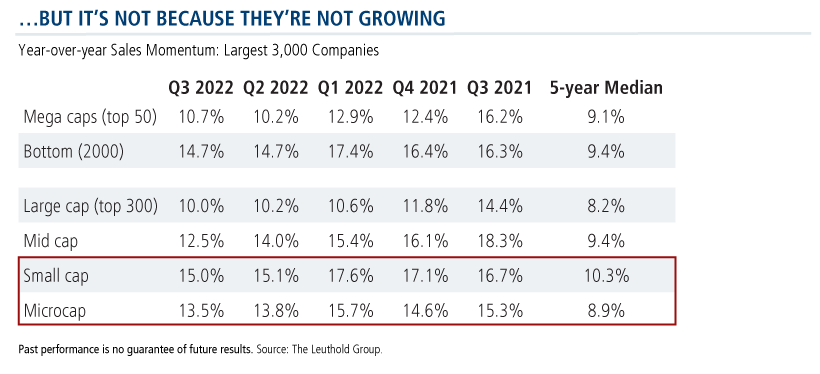
The growth rates in small and microcaps are just as good if not better than mid and large cap stocks. “Additionally, earnings revisions for large companies have been more negative than for small companies,” Nelson said.
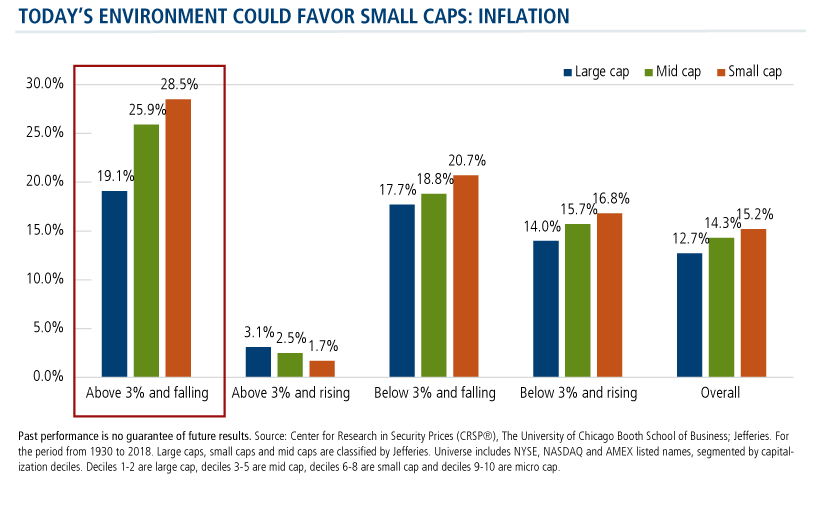
For the short term and through most of 2023, inflation is likely to be above average but falling in trend. According to data presented by Nelson, that’s when small caps rise the most and also outperform large caps the most—with a spread of about 1,000 basis points.
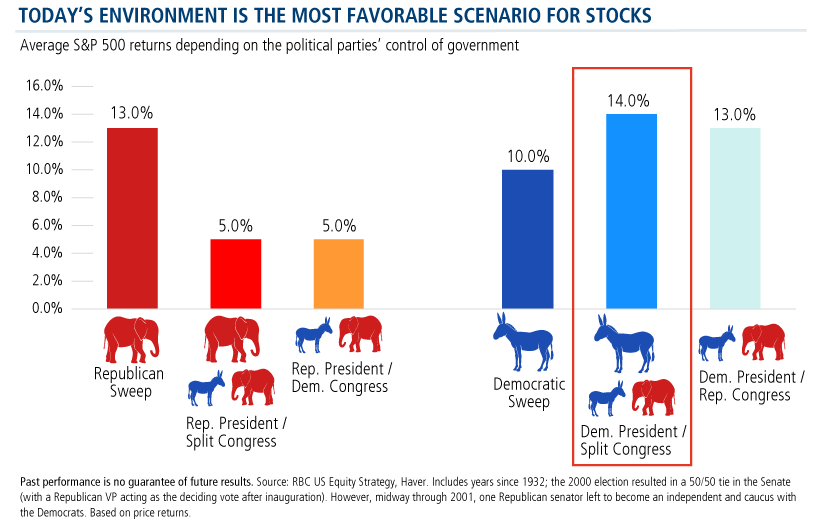
Stocks have historically done their best when a Democrat was in the White House, and the House and Senate were led by opposing political parties. Such is the situation today, after this month’s midterms.
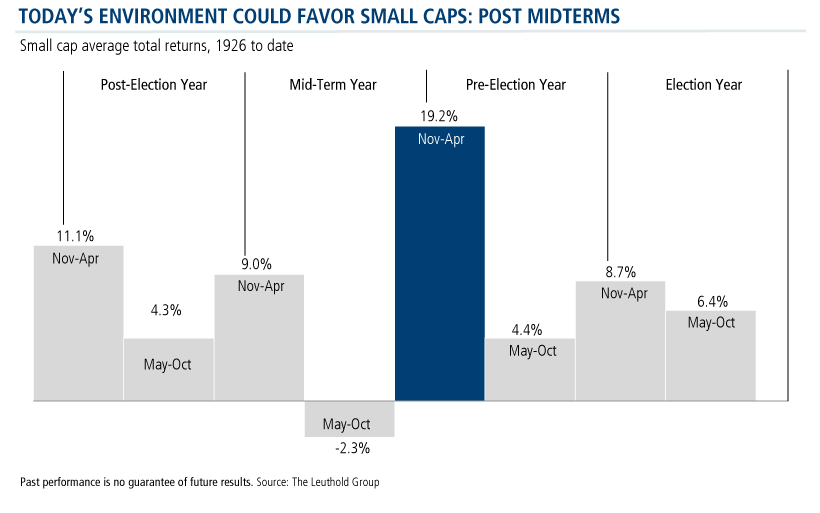
Narrowing the focus to small cap stocks, Nelson presented the next chart to show “we’re just a few weeks into what’s historically been the best six-month period for owning small caps.”
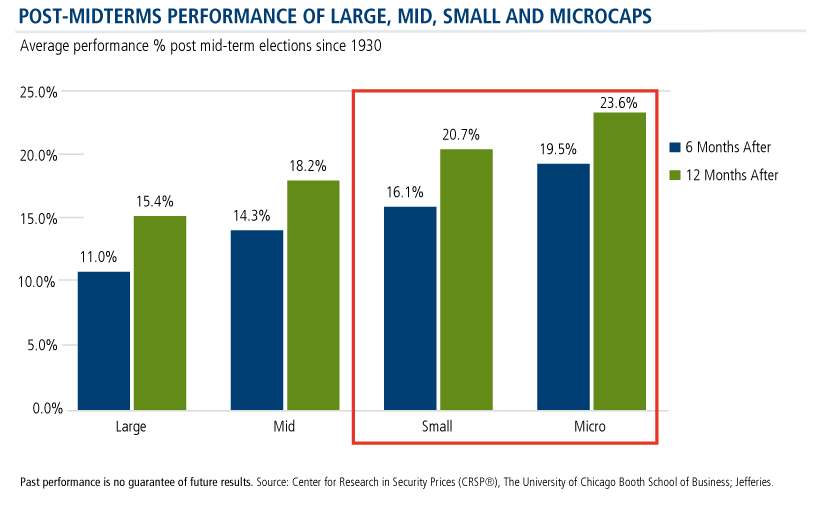
Post-midterms, there’s only one type of stock that has performed better than small caps, and that’s microcaps. “It’s a very linear relationship, and this is based on almost 100 years of data,” said Nelson.
Why CTSIX?
If small cap growth is where you want to be, the Timpani fundamental process merits consideration as it’s demonstrated consistent outperformance. “What we do works, it doesn’t work every day or every year. The market doesn’t always embrace what we do, but it does tend to work,” Nelson said.
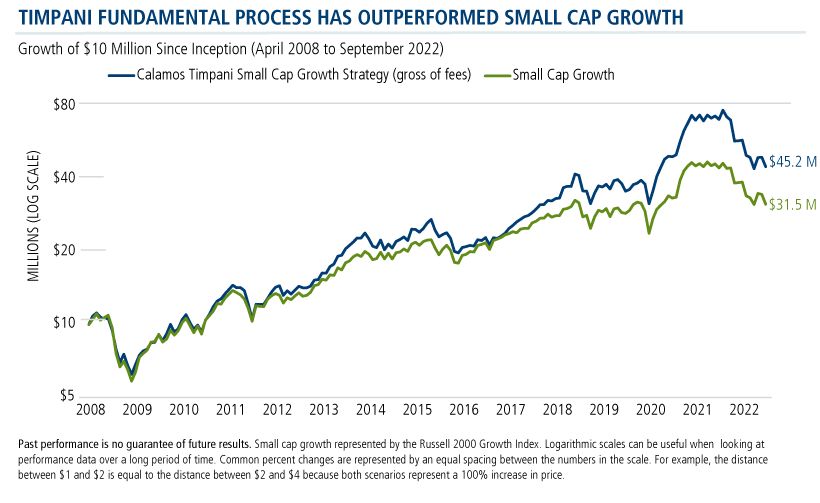
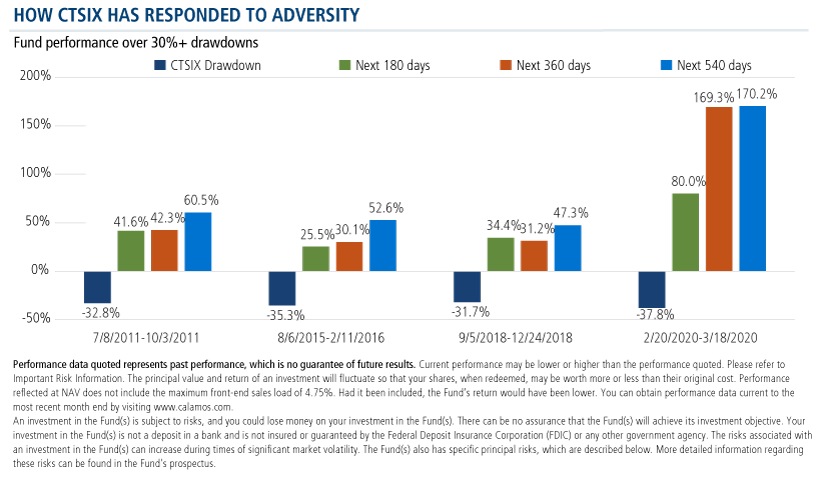
“There are times when you get slapped in the face for 30%, it’s not comfortable, it’s very painful,” he said. “But in my career, those times have proven to be a great entry point to increase exposure. We’ve always gotten it back, and then some,” said Nelson, presenting the following chart.
Anticipating a market rally to be led by microcaps, Nelson commented on the advantage of the fund’s asset size of $324 million (at 9/30/22) as an advantage. “We have a small asset base. Many of our competitors are running $8, $10, $12 billion in assets. Our size is an advantage for us, it doesn’t mean those funds can’t win but we can ramp up positions quicker, we can dial down quicker.”
“We can look at smaller names that many competitors don’t bother looking at,” continued Nelson. “If they bought a microcap and made it a 1% or 2% position in their portfolios, they might own 15%-20% of the company and that’s just not something they want to do.”
“It’s an advantage, you still have to be right, you still have to pick the right stocks, I’m not saying it’s easy. But,” he said, “all else equal, it’s an advantage for us to traffic down the market cap spectrum.”
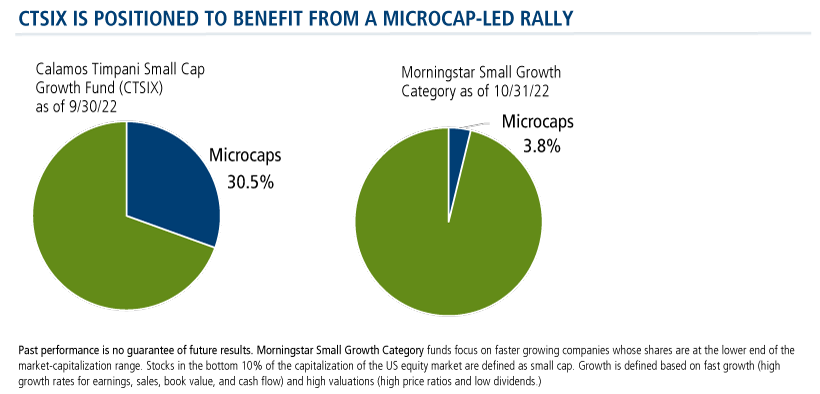
A microcap resurgence would be a welcome tailwind, given the fund’s significantly greater holdings in microcaps.
A Parting Thought
If your 2023 forecast assumes a flat or even secular bear market, that’s even more reason to consider small caps, according to Nelson, presenting this final chart.
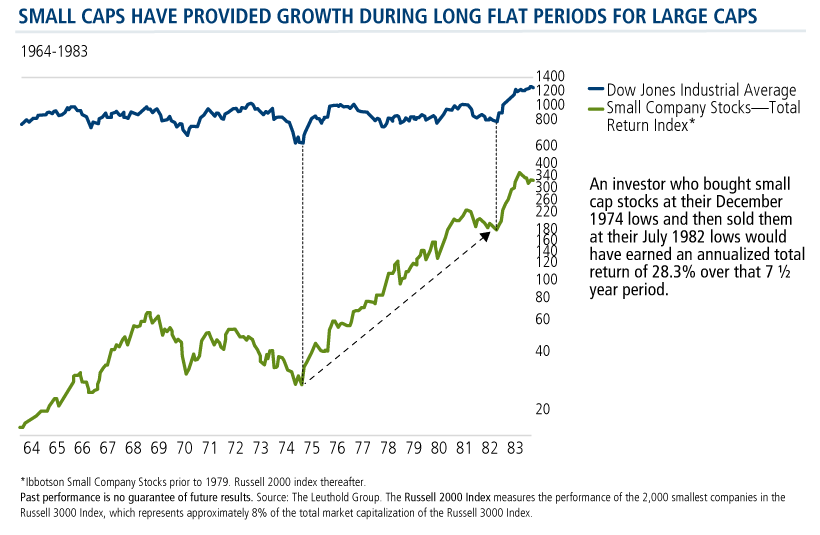
“Maybe the large caps, the S&P 500, need to digest the big moves they’ve seen over the last several years. Maybe we’re in for a half a decade or decade of flattish performance,” he said. The chart above shows a period from 1974-1983 when small caps “crushed it” with a 28% annualized return as large caps “were flatlining. I’m not saying we’re going to do the same," Nelson said, "but maybe we are. We don’t need that to happen but it’s interesting.”
Investment professionals, for more about how the CTSIX team is pursuing the broadband opportunity or the fund’s investment process in general, please reach out to your Calamos Investment Consultant at 888-571-2567 or caminfo@calamos.com.
Before investing, carefully consider the fund’s investment objectives, risks, charges and expenses. Please see the prospectus and summary prospectus containing this and other information which can be obtained by calling 1-866-363-9219. Read it carefully before investing.
The principal risks of investing in the Calamos Timpani Small Cap Growth Fund include: equity securities risk consisting of market prices declining in general, growth stock risk consisting of potential increased volatility due to securities trading at higher multiples, and portfolio selection risk. The Fund invests in small capitalization companies, which are often more volatile and less liquid than investments in larger companies. As a result of political or economic instability in foreign countries, there can be special risks associated with investing in foreign securities, including fluctuations in currency exchange rates, increased price volatility and difficulty obtaining information. In addition, emerging markets may present additional risk due to potential for greater economic and political instability in less developed countries.
Morningstar Small Growth Category funds focus on faster growing companies whose shares are at the lower end of the market-capitalization range. Stocks in the bottom 10% of the capitalization of the US equity market are defined as small cap. Growth is defined based on fast growth (high growth rates for earnings, sales, book value, and cash flow) and high valuations (high price ratios and low dividends.)
The Russell 2000 Index measures the performance of the 2,000 smallest companies in the Russell 3000 Index, which represents approximately 8% of the total market capitalization of the Russell 3000 Index.
820327 1122
Archived material may contain dated performance, risk and other information. Current performance may be lower or higher than the performance quoted in the archived material. For the most recent month-end fund performance information visit www.calamos.com. Archived material may contain dated opinions and estimates based on our judgment and are subject to change without notice, as are statements of financial market trends, which are based on current market conditions at the time of publishing. We believed the information provided here was reliable, but do not warrant its accuracy or completeness. This material is not intended as an offer or solicitation for the purchase or sale of any financial instrument. The views and strategies described may not be suitable for all investors. This material has been prepared for informational purposes only, and is not intended to provide, and should not be relied on for, accounting, legal or tax advice. References to future returns are not promises or even estimates of actual returns a client portfolio may achieve. Any forecasts contained herein are for illustrative purposes only and are not to be relied upon as advice or interpreted as a recommendation.
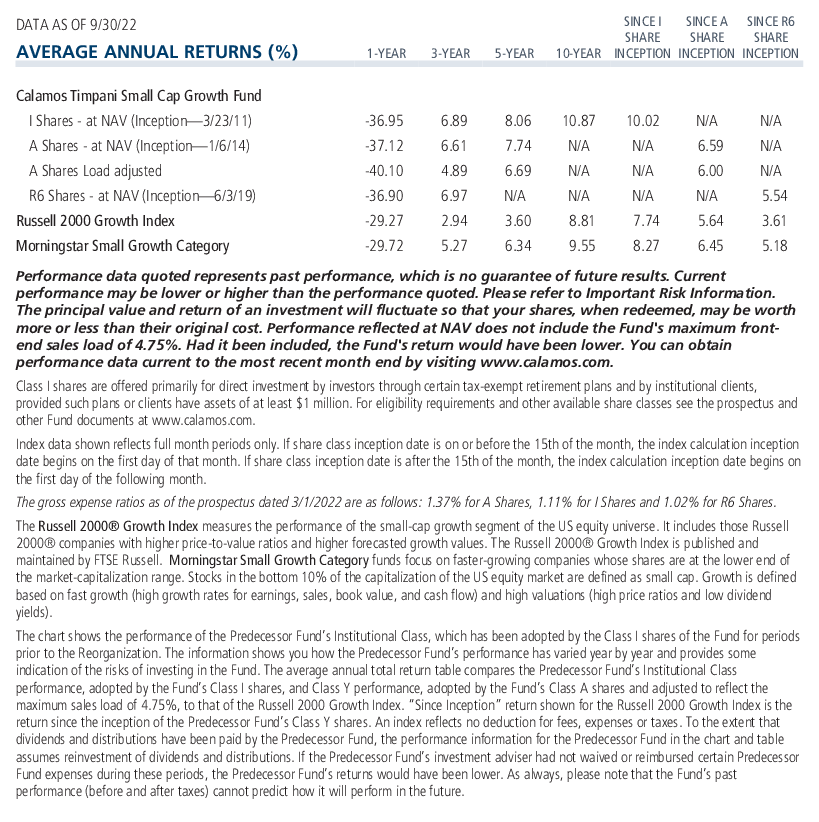
Performance data quoted represents past performance, which is no guarantee of future results. Current performance may be lower or higher than the performance quoted. The principal value and return of an investment will fluctuate so that your shares, when redeemed, may be worth more or less than their original cost. Performance reflected at NAV does not include the Fund’s maximum front-end sales load. Had it been included, the Fund’s return would have been lower.
Archived material may contain dated performance, risk and other information. Current performance may be lower or higher than the performance quoted in the archived material. For the most recent month-end fund performance information visit www.calamos.com. Archived material may contain dated opinions and estimates based on our judgment and are subject to change without notice, as are statements of financial market trends, which are based on current market conditions at the time of publishing. We believed the information provided here was reliable, but do not warrant its accuracy or completeness. This material is not intended as an offer or solicitation for the purchase or sale of any financial instrument. The views and strategies described may not be suitable for all investors. This material has been prepared for informational purposes only, and is not intended to provide, and should not be relied on for, accounting, legal or tax advice. References to future returns are not promises or even estimates of actual returns a client portfolio may achieve. Any forecasts contained herein are for illustrative purposes only and are not to be relied upon as advice or interpreted as a recommendation.
Performance data quoted represents past performance, which is no guarantee of future results. Current performance may be lower or higher than the performance quoted. The principal value and return of an investment will fluctuate so that your shares, when redeemed, may be worth more or less than their original cost. Performance reflected at NAV does not include the Fund’s maximum front-end sales load. Had it been included, the Fund’s return would have been lower.
Archived on November 18, 2023