Small Caps: Signs That Investors’ Cold, Cold Hearts Could Be Thawing
August 22, 2022
Since November 2021, small caps have lived up to their reputation as heart-breakers, with the Russell 2000 and Russell 2000 Growth indexes losing -17% and -25%, respectively.
But here’s a short list of what investors need to understand about small caps, particularly today, according to Calamos Timpani Small Cap Growth Fund (CTSIX) Senior Portfolio Manager Brandon Nelson, CFA.
-
The Best Equity Asset Class Over Time. “If you look back 100 years, it's the best equity asset class there is,” Nelson says. “It goes through periods of winning and losing on a relative basis. It's temporarily down and out. It's lagged for the last 10 years.”
But given small caps' performance recently and citing recent copyrighted research and analysis from Ned Davis Research, Inc. and others, Nelson believes that small caps could be in the early stages of a multiyear run.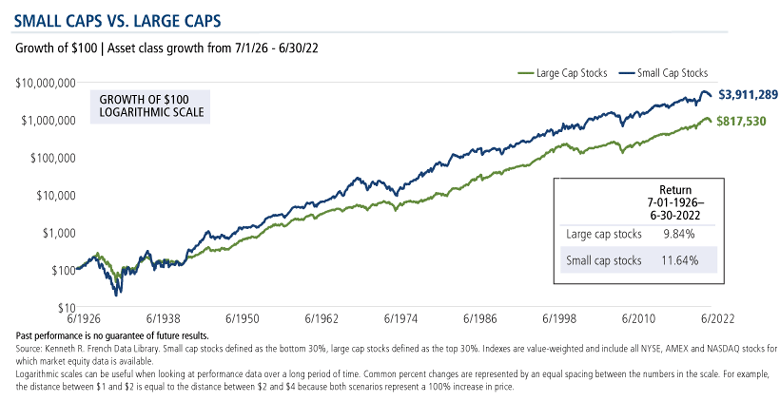
- A ‘Blow-out’ Reversion to Mean. A reversion to mean would have the potential to provide an exciting ride, especially from today’s extremely low valuations. “The excitement is that we could see things mean-revert back to where they typically trade the average valuations and even beyond that. [Small caps] don't typically just go back to the average, they typically blow through it and go to the high end,” according to Nelson.
-
Investors Are Appreciating Earnings Again. Just recently, there’s been a change in a pattern that small cap investors established earlier in the year. Nelson notes this encouraging sign: good earnings reports are getting selectively rewarded. While that’s how it should be, that is not what had been happening.
 Brandon Nelson
Senior Portfolio Manager“That's what we need for us to win and I'm seeing evidence of that happening. This is what we need to see. This is where we thrive. We're good at the bottom-up earnings situations that get magnified. And that’s what’s starting back up again.”
“[Good news] is still not being fully embraced, but what it means is this multiple compression, this valuation compression, that we've been seeing for the last eight-plus months is either completely over or it's in the final stages.”
“That’s a big deal,” according to Nelson. “It means the market, hopefully, will go from being completely obsessed with the macro, where that drives 95% of a stock's movement, to maybe going back to something closer to a 50/50 ratio, where 50% is driven by the macro and 50% is driven by the company specifics.”
For CTSIX, in particular, “That's what we need for us to win and I'm seeing evidence of that happening. This is what we need to see. This is where we thrive. We're good at the bottom-up earnings situations that get magnified. And that’s what’s starting back up again.”
To track, Nelson and team have been studying outlier price reactions. “We look at the one-day performance after an earnings report gets released, how each stock did, and we look at the outliers—up 5% or more, down 5% or more—and it's extremely lopsided to the positive this earnings season. It's just one way of measuring how the earnings season is going. It's the best quarter we've seen in many quarters, so it's very encouraging.”
Small caps overall have been staging what Nelson calls a “quiet three-month winning streak” of about 150 basis points of outperformance May to July relative to large caps. “You’ve got to start somewhere, it's quietly turning the corner.”
As encouraged as he is, Nelson acknowledges a headwind that’s particularly vexing for the high quality, small cap growth manager: “Recently the market has been rewarding low quality, unprofitable down-and-out stocks that got hit the hardest during the last year and a half. That stuff is doubling and tripling off the bottom. We don't own as much of that stuff. We've got a higher quality portfolio, it's more profitable, and that's been punishing us on a relative basis versus the Russell 2000 Growth.” This is a short-term trend, he suspects.
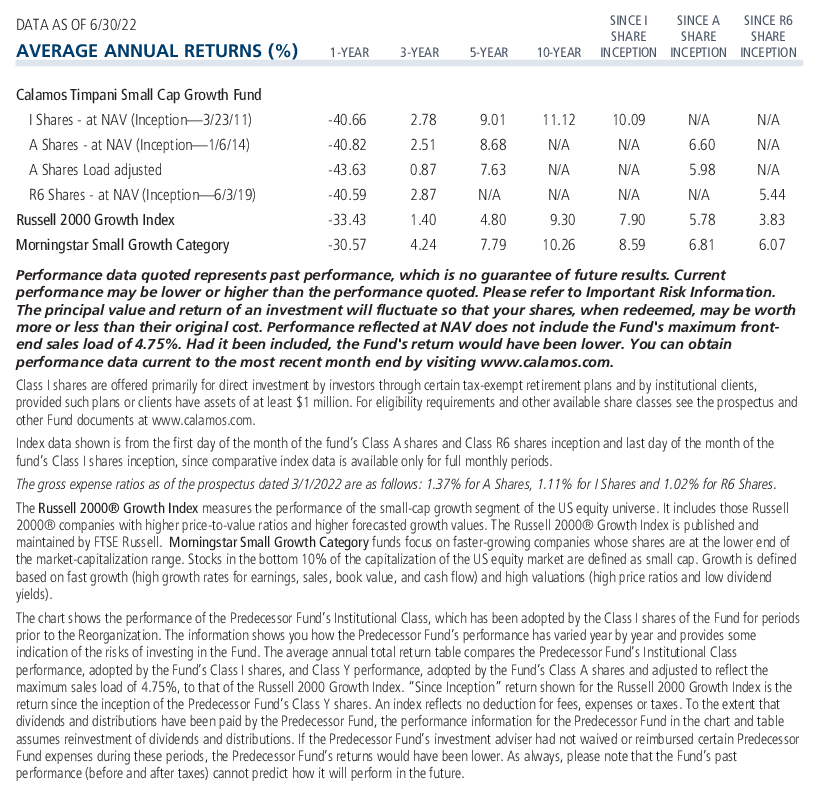
Nelson compared CTSIX’s valuations to the Russell 2000 Growth.
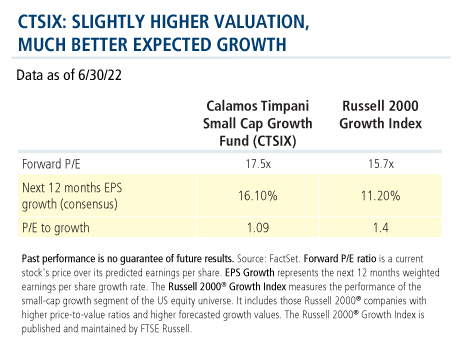
“We have a higher valuation—we always do. I have never seen us have a lower P/E ratio in my 26 years of doing this. However, our valuation premium is small relative to history less than two P/E multiple points above the Russell 2000 Growth (17.5x less 15.7x).”
He says, “In addition to fundamental momentum, I think there is a valid valuation argument here that can be made—a low P/E ratio relative to the expected growth profile.”
“Also, keep in mind that these are consensus numbers, and we have consistently been better than consensus,” adds Nelson. “I would confidently tell you that 16.1% expected growth has more upside than the 11.2% expected growth for the Russell 2000 Growth. You put those two numbers together, take 17.5 divided by 16.1, you get a relationship of 1.09, compare that to the Russell 2000 Growth, 1.4.”
In short, according to Nelson, the timing may be opportune. "There is a valuation argument that needs to be made here in addition to just fundamental momentum.”
-
Midterms Over, Bear Markets Ending—Both Have Benefited Small Caps. Whether it’s after the midterm elections take place or as the bear market inevitably comes to an end, Nelson likes small caps’ prospects in the several months ahead.
“There’s the potential for a Fed pivot coming up at the late September meeting,” he said. “That could be a huge catalyst for the stock market. We’re seeing the inflation metrics roll over. You’ve seen a lot of commodity prices roll over. Copper’s down big. Lumber is down big. Wheat’s down big. You’re seeing other leading indicators of economic growth start to roll over that are tied to hot inflation figures.”
The midterm elections, which have historically favored small and microcap stocks, will be a key event.
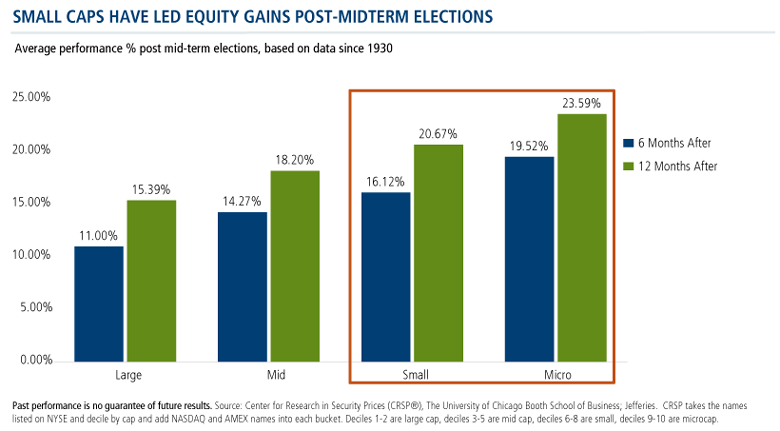
“We’re going to be really well positioned if this plays out like it has historically,” says Nelson. The fund’s relatively low asset base ($334 million as of 6/30/22) enables the fund to be nimble.
“If microcaps rip after the midterms, that will come in handy. We’ll be heavy in small. We’ll be heavier than the peer group in the micro area. This could play perfectly to our approach.”
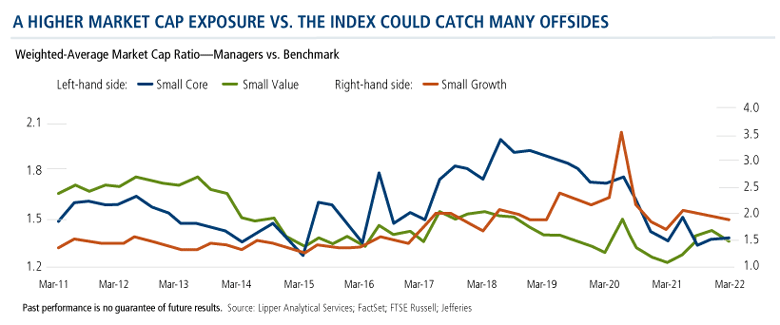
While a small cap rally led by the smallest companies could be a tailwind for a pure small cap fund like CTSIX, it could catch other managers offsides. As shown below, the average small manager has high market cap exposure relative to the benchmark—especially in small growth—at about two times the benchmark.
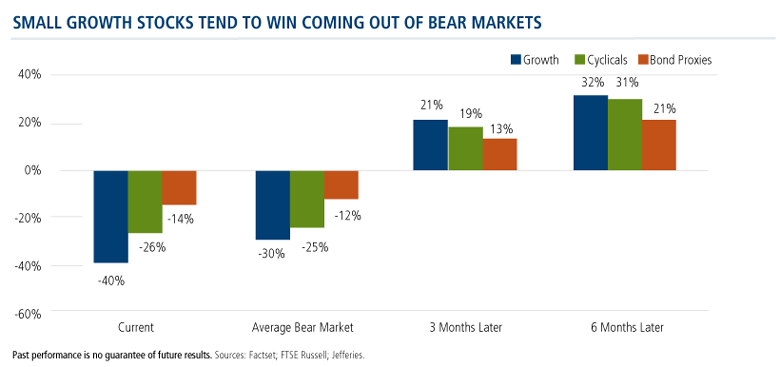
Finally, the bear market in equities will eventually come to an end, and a new bull market will begin. Historically, the average small cap growth companies’ bear market—down 30% from peak to trough—has been followed by a strong bounce back. The chart below shows the average recovery, including the recovery of cyclicals and bond proxies for reference.
-
Company name Date of announcement One Medical 7/21 EVO Payments 8/1 Sierra Wireless 8/2 (a 1.26% position in CTSIX as of 6/30/22) Ping Identity 8/3 Chemocentryx 8/4 iRobot 8/5 Global Blood Therapeutics 8/8 Avalara 8/8 M&A Activity Points to the Value. “One way or the other, the value in small caps will get recognized,” says Nelson, noting the recent flurry of merger and acquisition activity this summer. Since just July 21, the following eight companies announced they were getting bought out by larger companies for premium valuations.
“I take this as a sign of confidence by management teams that are doing the buying. Also, it’s a sign that the buyers see value in these companies that is not getting properly recognized by the overall market,” says Nelson.
Investment professionals, to learn more about small caps, subscribe to our monthly Small Cap Market Snapshot. For specifics on where CTSIX is finding the opportunities, reach out to your Calamos Investment Consultant at 888-571-2567 or caminfo@calamos.com.
Before investing, carefully consider the fund’s investment objectives, risks, charges and expenses. Please see the prospectus and summary prospectus containing this and other information which can be obtained by calling 1-866-363-9219. Read it carefully before investing.
Top 10 Holdings
As of 6/30/22
| Company | Industry | % |
|---|---|---|
| Patterson-UTI Energy, Inc. | Oil & Gas Drilling | 3.5% |
| Lpl Financial Holdings, Inc. | Investment Banking & Brokerage | 3.2% |
| Celsius Holdings, Inc. | Soft Drinks | 3.0% |
| ExlService Holdings, Inc. | Data Processing & Outsourced Services | 2.9% |
| SiTime Corp. | Semiconductors | 2.7% |
| Privia Health Group, Inc. | Health Care Services | 2.5% |
| Acadia Healthcare Company, Inc. | Health Care Facilities | 2.4% |
| International Money Express, Inc. | Data Processing & Outsourced Services | 2.2% |
| Inspire Medical Systems, Inc. | Health Care Technology | 2.2% |
| Murphy USA, Inc. | Automotive Retail | 2.1% |
| Total | 26.7% |
Opinions and estimates offered constitute our judgment and are subject to change without notice, as are statements of financial market trends, which are based on current market conditions. We believe the information provided here is reliable, but do not warrant its accuracy or completeness. This material is not intended as an offer or solicitation for the purchase or sale of any financial instrument. The views and strategies described may not be suitable for all investors. This material has been prepared for informational purposes only, and is not intended to provide, and should not be relied on for, accounting, legal or tax advice. References to future returns are not promises or even estimates of actual returns a client portfolio may achieve. Any forecasts contained herein are for illustrative purposes only and are not to be relied upon as advice or interpreted as a recommendation. References to specific securities, asset classes and financial markets are for illustrative purposes only and are not intended to be, and should not be interpreted as, recommendations.
Opinions are subject to change due to changes in the market, economic conditions or changes in the legal and/or regulatory environment and may not necessarily come to pass. This information is provided for informational purposes only and should not be considered tax, legal, or investment advice. References to specific securities, asset classes and financial markets are for illustrative purposes only and are not intended to be, and should not be interpreted as, recommendations.
Important Risk Information. An investment in the Fund(s) is subject to risks, and you could lose money on your investment in the Fund(s). There can be no assurance that the Fund(s) will achieve its investment objective. Your investment in the Fund(s) is not a deposit in a bank and is not insured or guaranteed by the Federal Deposit Insurance Corporation (FDIC) or any other government agency. The risks associated with an investment in the Fund(s) can increase during times of significant market volatility. The Fund(s) also has specific principal risks, which are described below. More detailed information regarding these risks can be found in the Fund's prospectus.
The principal risks of investing in the Calamos Timpani Small Cap Growth Fund include: equity securities risk consisting of market prices declining in general, growth stock risk consisting of potential increased volatility due to securities trading at higher multiples, and portfolio selection risk. The Fund invests in small capitalization companies, which are often more volatile and less liquid than investments in larger companies. As a result of political or economic instability in foreign countries, there can be special risks associated with investing in foreign securities, including fluctuations in currency exchange rates, increased price volatility and difficulty obtaining information. In addition, emerging markets may present additional risk due to potential for greater economic and political instability in less developed countries.
The Russell 2000® Growth Index measures the performance of the small-cap growth segment of the US equity universe. It includes those Russell 2000® companies with higher price-to-value ratios and higher forecasted growth values. The Russell 2000® Growth Index is published and maintained by FTSE Russell.
The Russell 2000 Index measures the performance of the 2,000 smallest companies in the Russell 3000 Index, which represents approximately 8% of the total market capitalization of the Russell 3000 Index.
810232 822
Archived material may contain dated performance, risk and other information. Current performance may be lower or higher than the performance quoted in the archived material. For the most recent month-end fund performance information visit www.calamos.com. Archived material may contain dated opinions and estimates based on our judgment and are subject to change without notice, as are statements of financial market trends, which are based on current market conditions at the time of publishing. We believed the information provided here was reliable, but do not warrant its accuracy or completeness. This material is not intended as an offer or solicitation for the purchase or sale of any financial instrument. The views and strategies described may not be suitable for all investors. This material has been prepared for informational purposes only, and is not intended to provide, and should not be relied on for, accounting, legal or tax advice. References to future returns are not promises or even estimates of actual returns a client portfolio may achieve. Any forecasts contained herein are for illustrative purposes only and are not to be relied upon as advice or interpreted as a recommendation.
Performance data quoted represents past performance, which is no guarantee of future results. Current performance may be lower or higher than the performance quoted. The principal value and return of an investment will fluctuate so that your shares, when redeemed, may be worth more or less than their original cost. Performance reflected at NAV does not include the Fund’s maximum front-end sales load. Had it been included, the Fund’s return would have been lower.
Archived on August 22, 2023