It’s Time to Think Out of the (Fixed Income) Box to Diversify Equity Risk, Provide Total Return
July 1, 2021
The cryptocurrency craze, meme trading, and TikTok tutorials—the last six months have been so noisy with the new stuff that it’s easy to lose sight of what’s most important to clients.
It’s not how to score the next triple-digit stock gain in a week’s time. It’s loss aversion, the preservation of a hard-earned investment portfolio. That—and how to continually generate investment returns—is what the smartest investment professionals we know are focusing on at this point halfway through 2021.
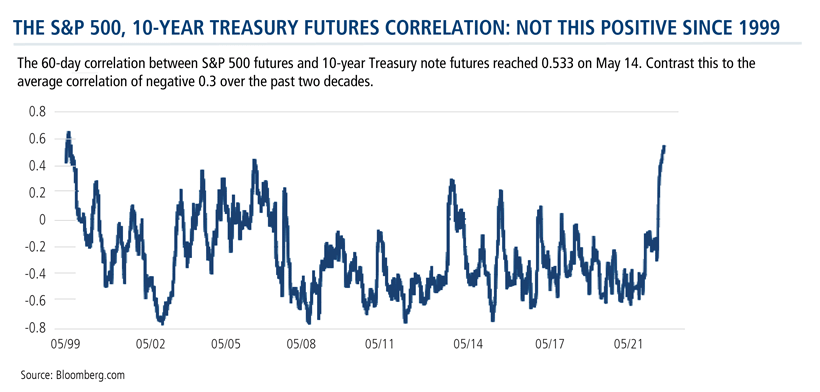
The S&P 500 closed the second quarter Wednesday on a fifth consecutive all-time high, the market hasn’t had a 5% pullback since last October, and—a new challenge—fixed income isn’t providing the expected diversification. After being mostly in negative territory over the past 15 years, the correlation between stocks and bonds has turned positive and is at the highest level since 1999.
What to do and where to go? When rebalancing and in an attempt to shield clients’ portfolios from inevitable equity pullbacks, professionals are increasingly turning to options strategies.
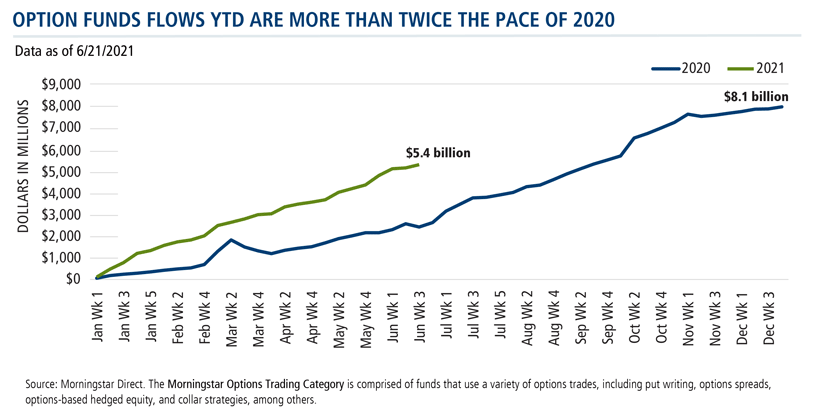
The chart below plots the 2020 and YTD 2021 flows into Morningstar’s Options Trading category. Note that flows—totaling $5.4 billion as of the third week of June—are more than twice where they were at this time last year (for ongoing coverage of liquid alts performance and flows, subscribe to our Weekly Alternatives Snapshot).
Facing the Fixed Income Predicament
A 60% stocks and 40% bond portfolio yielded a 9.0% annualized return between 1926 and 2019—with more than half of that return (5.1%) coming from fixed income. This is according to Dimensional Fund Advisors data, with stocks represented by a composite of the S&P 500, CRSP Deciles 3–5 for mid-cap stocks, and CRSP Deciles 6–10 for small-cap stocks. Bonds are represented by five-year Treasury bonds.
Reconsidering the Overall Structure of Portfolios
A 2020 CFA Institute blog post commented on the predicament facing portfolio-builders:
“The traditional levers to generate incremental return come with considerable uncertainty, yet investors continue to rely on their portfolios to meet operating budgets and living expenses. If we stick with the traditional approach, we’re likely in trouble.
“That means we have to rethink portfolio management and risk control. The current stock/bond paradigm uses stocks for growth and bonds for protection and income generation. Fixed income hedges against stock market downturns…But such periods tend to be infrequent and short-lived. So instead of restricting 40% of our portfolios to securities meant to minimize losses once per decade, we should reconsider the overall structure of our portfolios.
“Maybe the focus should be delivering liquidity during crises without sacrificing long-term returns to minimize downside risk. We still want to optimize returns in normal markets.”
In part, today’s pronounced gravitation to options strategies reflects investors’ acknowledgement that bonds won’t be able to contribute as they have. To try to squeeze more from fixed income would require extending duration or assuming additional credit risk, something few professionals are willing to do at this point.
Instead, investment professionals are rethinking their “riskier” credit allocations. Many are open to trading yield for total return.
You may have previously favored 60/40 allocation funds or high yield funds to offset equity drawdowns and provide a certain level of total return. But given today’s environment, would you consider an options-based idea?
Actively managed to identify and potentially benefit from relative value opportunities in the options market, Calamos Hedged Equity Fund (CIHEX) has become an increasingly popular means of reducing equity risk. While CIHEX has traditionally been thought of as an equity alternative, it can also be used as a total return replacement.
Below, our Elise Pondel, CFA, Calamos AVP, Product Management & Analytics, provides the data to make the case.
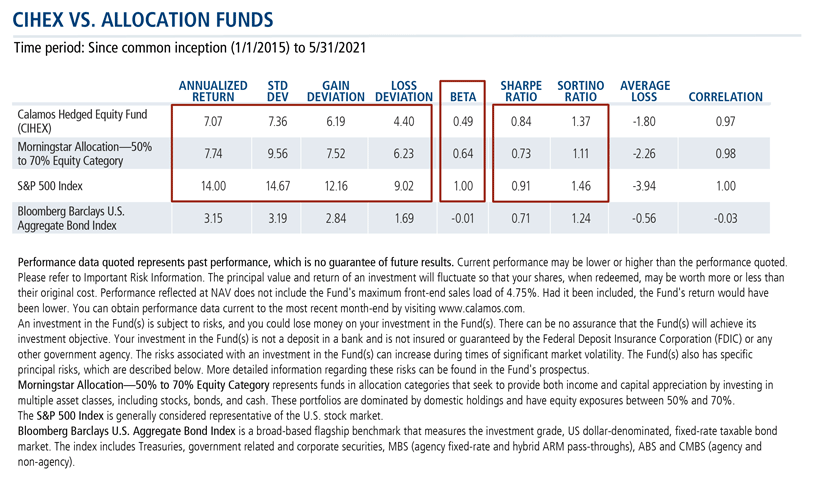
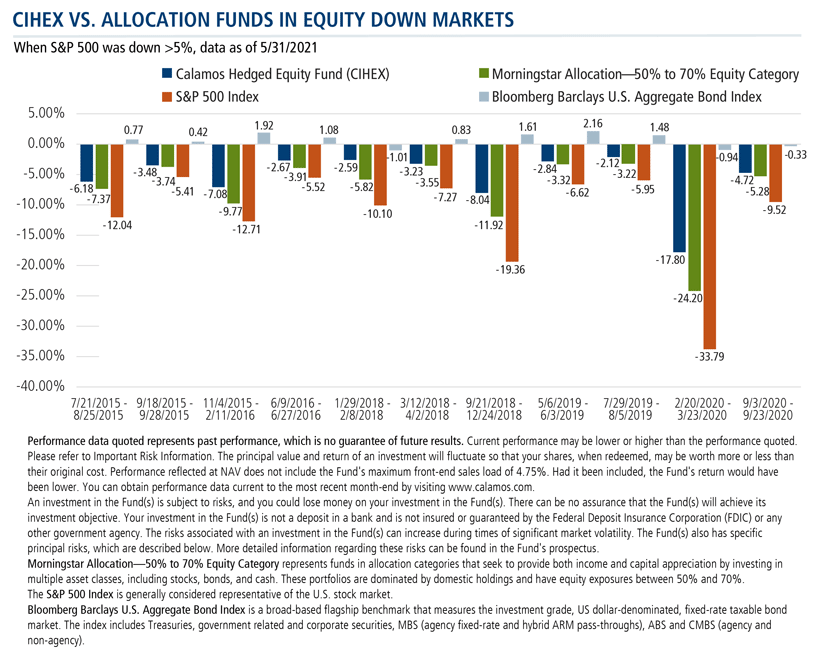
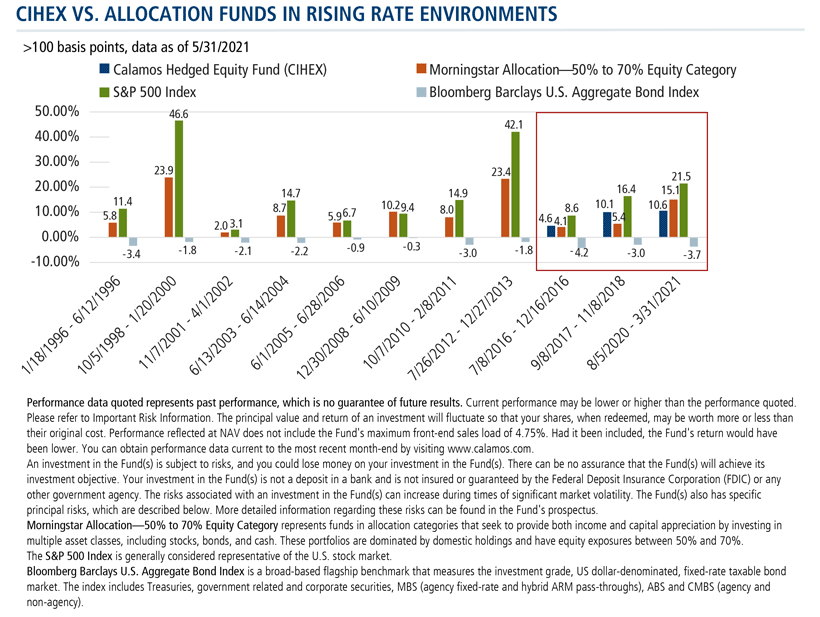
CIHEX vs. 60/40 Allocation Funds
Here’s why CIHEX is a worthy alternative to the allocation fund: Over its inception, the fund has provided a very similar total return with lower volatility and equity market risk, providing a more risk-efficient way of mitigating equity drawdowns and duration risk.
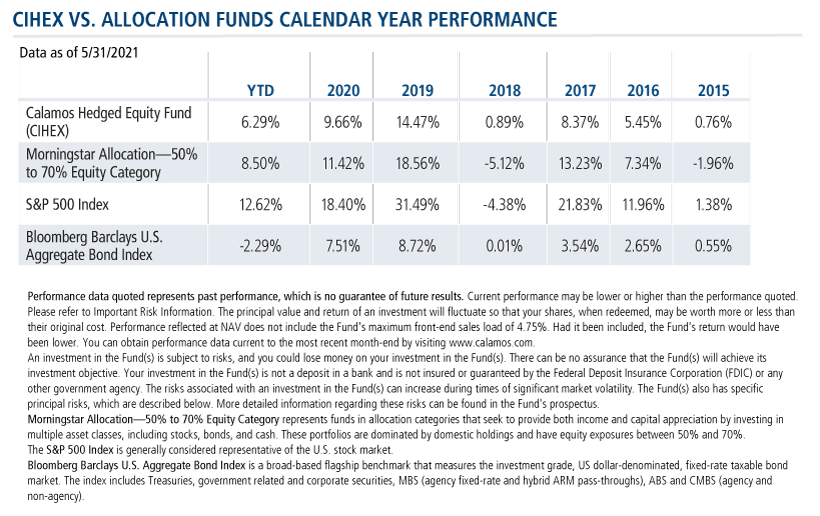
Pondel provides a few views of CIHEX’s historical performance: over calendar years, during equity down markets when the S&P 500 is down more than 5%, and when rates are rising more than 100 basis points.
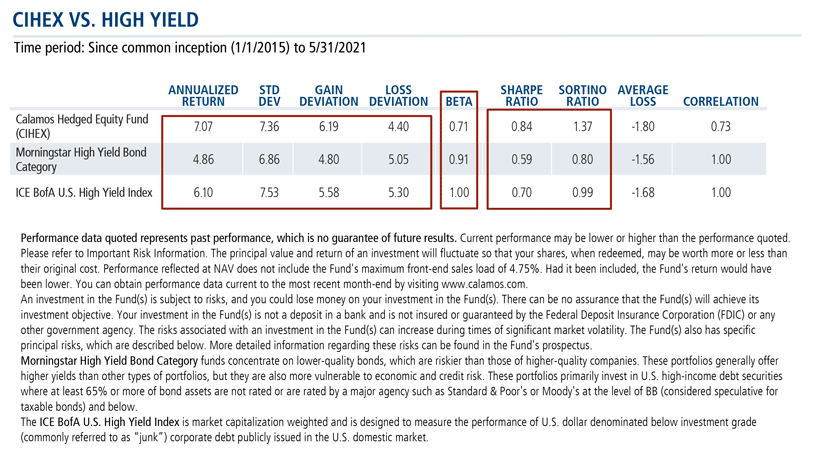
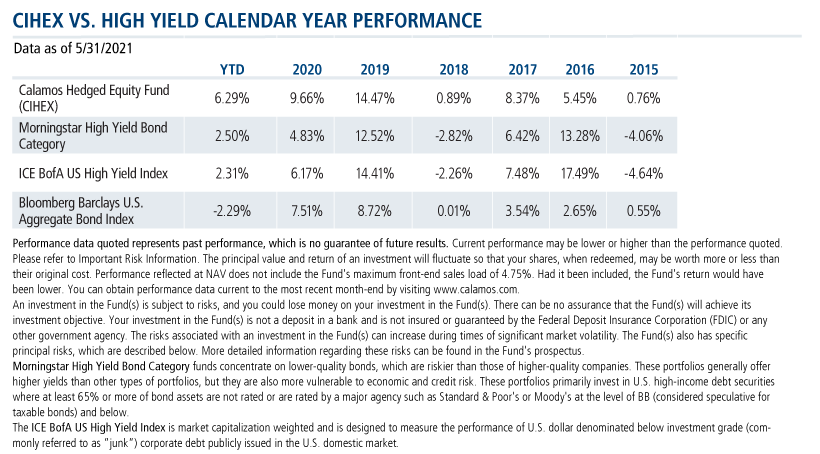
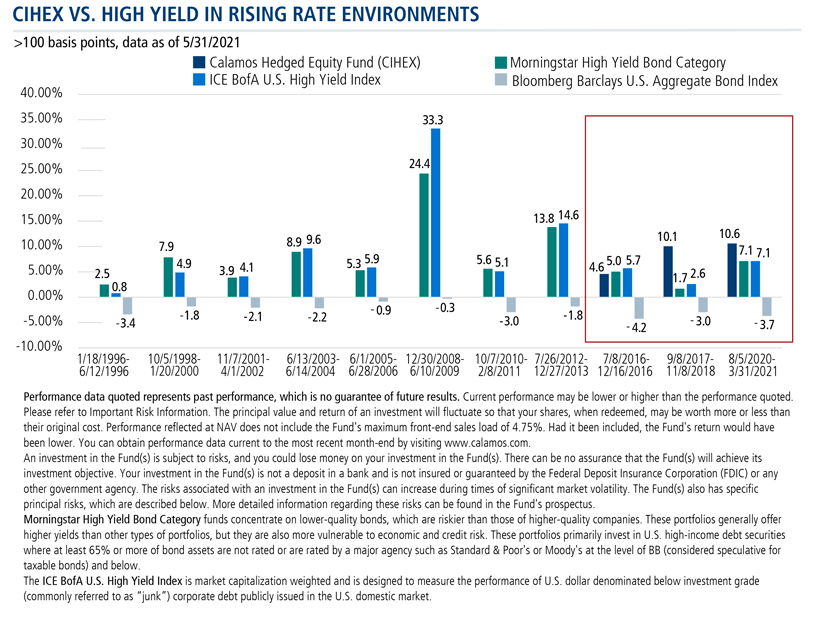
CIHEX vs. High Yield Funds
The drive to diversify and optimize returns is what leads investment professionals to replace all or a part of their high yield allocation with options strategies. If you’re willing to trade income for total return—and many are—CIHEX is a potential replacement.
Over its inception, the fund has outperformed on a total return basis with a similar total volatility profile, providing a more risk-efficient way of reducing duration risk while exceeding the total return profile that high yield has provided.
And, Pondel points to the calendar year performance. CIHEX has provided the strong upside total return potential typically enjoyed by investors in high yield while having maintained a consistent positive calendar year return stream.
Also compare CIHEX’s past performance as a hedge against periods of rising interest rates.
Investment professionals, times have changed and yet your objective to keep clients on track toward their investment goals is unchanged. We can help with these and other ideas, please reach out to your Investment Consultant at 888-571-2567 or caminfo@calamos.com.
Before investing, carefully consider the fund’s investment objectives, risks, charges and expenses. Please see the prospectus and summary prospectus containing this and other information which can be obtained by calling 1-866-363-9219. Read it carefully before investing.
The principal risks of investing in the Calamos Hedged Equity Fund include: covered call writing risk, options risk, equity securities risk, correlation risk, mid-sized company risk, interest rate risk, credit risk, liquidity risk, portfolio turnover risk, portfolio selection risk, foreign securities risk, American depository receipts, and REITs risks.
The Morningstar Options Trading Category is comprised of funds that use a variety of options trades, including put writing, options spreads, options-based hedged equity, and collar strategies, among others.
Morningstar Allocation—50% to 70% Equity Category represents funds in allocation categories that seek to provide both income and capital appreciation by investing in multiple asset classes, including stocks, bonds, and cash. These portfolios are dominated by domestic holdings and have equity exposures between 50% and 70%.
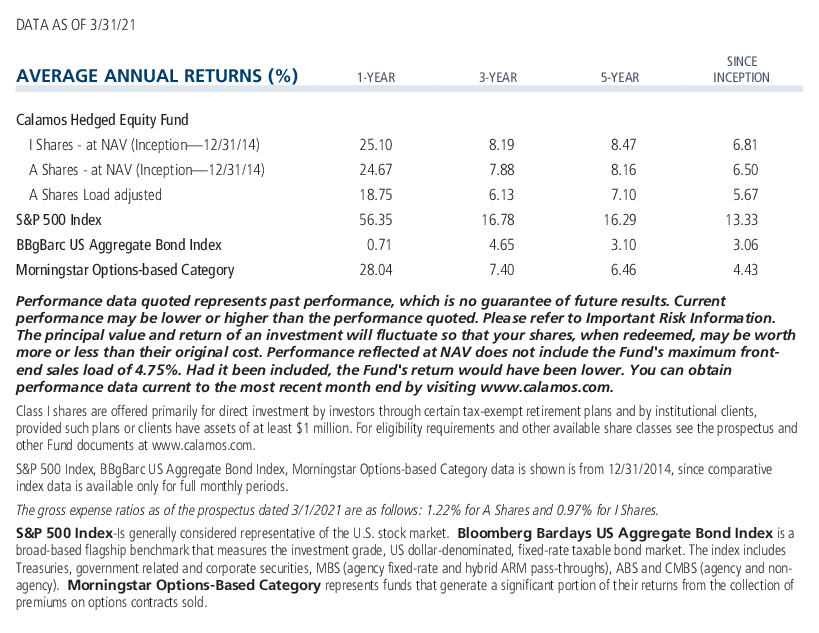
The S&P 500 Index is generally considered representative of the U.S. stock market.
Bloomberg Barclays U.S. Aggregate Bond Index is a broad-based flagship benchmark that measures the investment grade, US dollar-denominated, fixed-rate taxable bond market. The index includes Treasuries, government related and corporate securities, MBS (agency fixed-rate and hybrid ARM pass-throughs), ABS and CMBS (agency and non-agency).
Morningstar High Yield Bond Category funds concentrate on lower-quality bonds, which are riskier than those of higher-quality companies. These portfolios generally offer higher yields than other types of portfolios, but they are also more vulnerable to economic and credit risk. These portfolios primarily invest in U.S. high-income debt securities where at least 65% or more of bond assets are not rated or are rated by a major agency such as Standard & Poor's or Moody's at the level of BB (considered speculative for taxable bonds) and below.
The ICE BofA U.S. High Yield Index is market capitalization weighted and is designed to measure the performance of U.S. dollar denominated below investment grade (commonly referred to as “junk”) corporate debt publicly issued in the U.S. domestic market.
Alpha is a historical measure of risk-adjusted performance. Alpha measures how much of a portfolio’s performance is attributable to investment-specific factors versus broad market trends. A positive alpha suggests that the performance of a portfolio was higher than expected given the level of risk in the portfolio. A negative alpha suggests that the performance was less than expected given the risk.
Beta is a historic measure of a fund’s relative volatility, which is one of the measures of risk; a beta of 0.5 reflects 1/2 the market’s volatility as represented by the Fund’s primary benchmark, while a beta of 2.0 reflects twice the volatility.
Correlation is a statistical measure that shows how two securities move in relation to each other. A correlation of 1 implies that if one security moves up or down, the other security will move in lockstep, in the same direction. Alternatively, a correlation of 1 means that if one security moves in either direction, the other security will do the exact opposite.
Duration is a measure of interest rate sensitivity.
Gain deviation is similar to standard deviation, except that this statistic calculates an average (mean) return for only the periods with a gain and then measures the variation of only the gain periods around this gain mean. This statistic measures the volatility of upside performance.
Loss deviation Similar to standard deviation, except that this statistic calculates an average (mean) return for only the periods with a loss and then measures the variation of only the losing periods around this loss mean. This statistic measures the volatility of downside performance.
Sharpe ratio is a measure of risk-adjusted performance, where higher values are indicative of better investment decisions rather than the result of taking on a higher level of risk. Sharpe ratio is calculated by the difference between a portfolio’s return and a risk-free rate, often that of the 10-year Treasury bond, and dividing the result by the portfolio’s standard deviation.
Standard deviation measures the overall risk of a fund.
Sortino ratio is the excess return over the risk-free rate divided by the downside semi-variance, and so it measures the return to "bad" volatility. (Volatility caused by negative returns is considered bad or undesirable by an investor, while volatility caused by positive returns is good or acceptable.)
802436 721
Archived material may contain dated performance, risk and other information. Current performance may be lower or higher than the performance quoted in the archived material. For the most recent month-end fund performance information visit www.calamos.com. Archived material may contain dated opinions and estimates based on our judgment and are subject to change without notice, as are statements of financial market trends, which are based on current market conditions at the time of publishing. We believed the information provided here was reliable, but do not warrant its accuracy or completeness. This material is not intended as an offer or solicitation for the purchase or sale of any financial instrument. The views and strategies described may not be suitable for all investors. This material has been prepared for informational purposes only, and is not intended to provide, and should not be relied on for, accounting, legal or tax advice. References to future returns are not promises or even estimates of actual returns a client portfolio may achieve. Any forecasts contained herein are for illustrative purposes only and are not to be relied upon as advice or interpreted as a recommendation.
Performance data quoted represents past performance, which is no guarantee of future results. Current performance may be lower or higher than the performance quoted. The principal value and return of an investment will fluctuate so that your shares, when redeemed, may be worth more or less than their original cost. Performance reflected at NAV does not include the Fund’s maximum front-end sales load. Had it been included, the Fund’s return would have been lower.
Archived on July 01, 2022