In the Doldrums About Fixed Income in 2022? Our View on Convertibles Could Cheer You Up
First published: January 10, 2022
We start out 2022 as we’ve done six of the last 10 years—with a nod to convertible securities as the top-performing fixed income asset class (and #2 in two other years) See our Fixed Income Asset Class quilt.
But today’s environment puts a sharper point on convertibles as an alternative to fixed income. Faced with rising inflation and the anticipation of interest rate hikes as early as March, traditional fixed income will struggle to produce real returns.
Prospects for investors in convertible bonds are much brighter, as Calamos Convertible Fund (CICVX) Senior Co-Portfolio Managers Joe Wysocki and Jon Vacko explained to a group of investment professionals in December. Since then the convertible market has become even more attractive in terms of price relative to bond floor and the opportunity set is increasingly concentrated around lower prices as a percentage of par. Given that, we've updated some of the comments and data below.
Converts Have Lower Durations
When interest rates rise, convertibles have performed much better than traditional fixed income. The chart below provides the data.
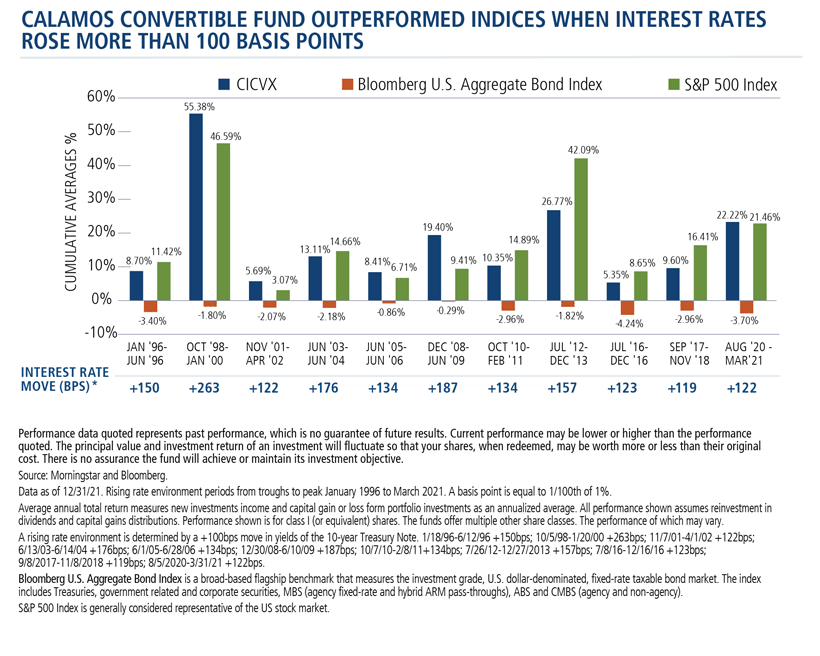
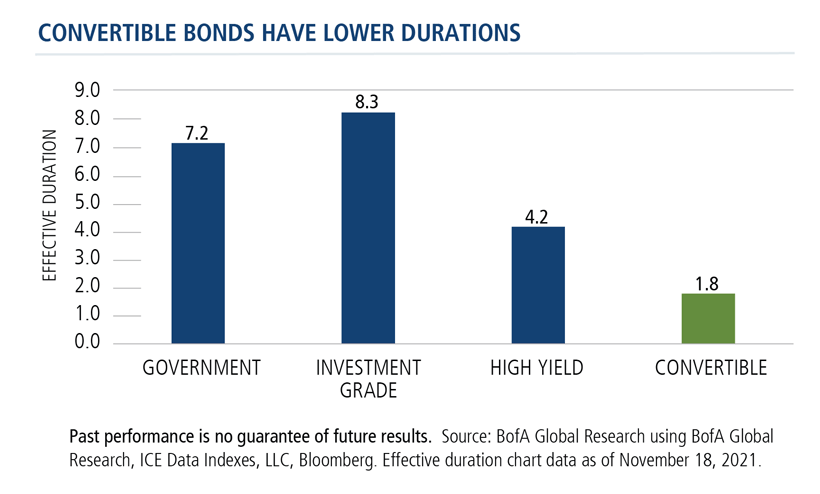
Some of the outperformance can be explained by the duration difference. The effective duration of convertibles, according to Wysocki citing a recent Bank of America study, is less than two years. That’s much lower than government, investment grade or high yield bonds.
And, he added, duration in some fixed income markets has been increasing, which will be even more challenging for investors as rates rise.
In December Wysocki also commented on high valuations as a risk to convertibles. Valuations have risen across all markets, he noted. “But even though valuations were elevated, we saw a 100-basis point rise in interest rates a year ago, and convertibles were up 20%.
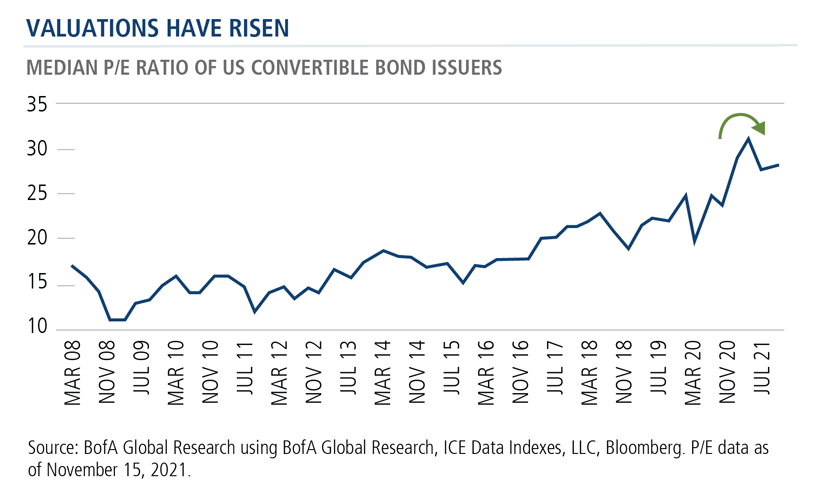
“Valuation alone isn't going to be the determining factor [in how convertibles perform],” he said. “If anything, it speaks to the benefit of actively managing the portfolio. Which types of companies? Which sectors? How will they do in a rising interest rate environment?”
In fact, valuations have declined in the last month.
Wysocki went on to comment on a structural shift that took place in the market from February to October last year, as illustrated in the chart below. The chart breaks the market into price points of convertibles, with the dark blue representing February 2021 and the green outline representing October 2021.
Over half the market in October was in bonds priced below 120. The median bond price at that time was 107 versus 126 last February.
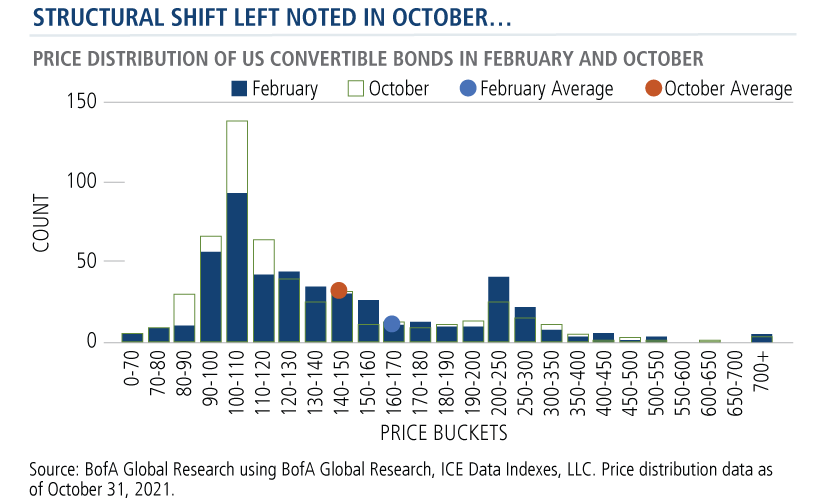
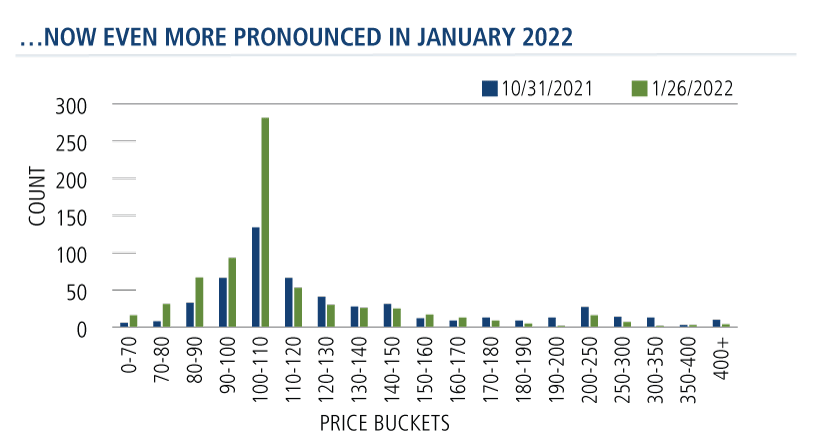
“Think about it,” said Wysocki. “A convertible comes to market at a price of par. The equity goes up. That bond trades up to 120, 150, 200. It becomes more equity-sensitive.” But, because of the pullback in some of the underlying stocks and thanks to new issuance in the market, bond prices have fallen recently.
“That's important because it provides you that ability to mitigate against the downside. The market’s not overly defensive by any means,” he continued, "there are a lot of bonds for us to be able to position to have downside support and still retain upside optionality.”
Wysocki showed this chart of investment premiums to provide another view of the recent repricing. The higher the number, the further away bonds are from their floors.
And, this shift continued in January, as shown by an update to the chart. The investable universe has become even more attractive for those looking for an entry point.
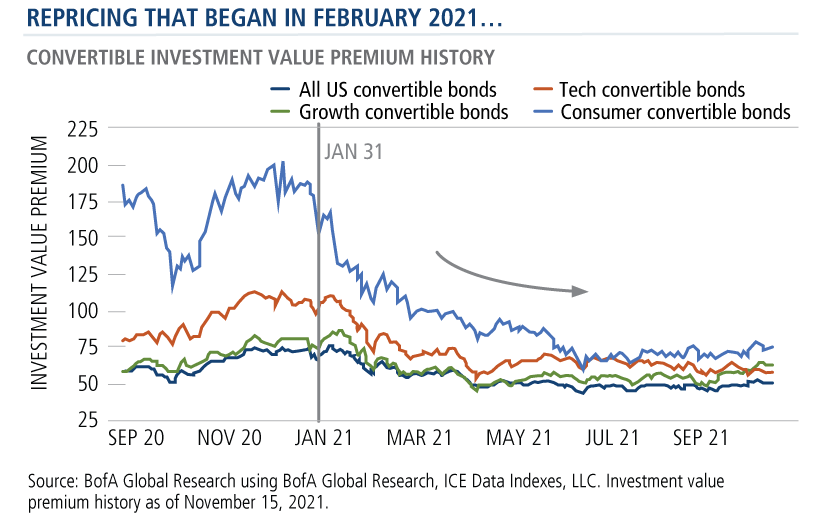
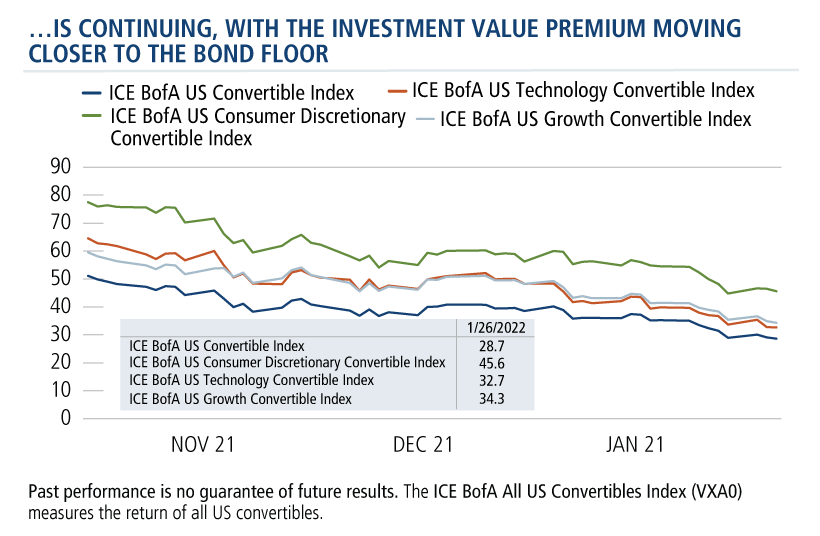
The February 2021 spike reflects the influence of a dominant issuer trading at 1000% of par. As that was reduced in the market, as equities have pulled back, as new bonds have come back in, bonds are trading closer to their floor—as illustrated below by an update of the chart as of January 26.
Strong Issuance, Healthy Market
While last year’s large cap bias within the broader equity market proved to be a headwind for convertible issuers, the two PMs nonetheless expressed enthusiasm about the health of the market.
Issuance was right on pace with 2020, and 2021 ranks as one of the top five years for the market (see the U.S. Convertible Market Snapshot for details). While issuers sought to shore up their balance sheets in 2021, last year issuance was for capital expenditures, investments and growth.
Vacko specifically commented on the fact that more than half (54%) of the overall issues were brought by first-time issuers. More than two-thirds of those (65%) were companies younger than three years old.
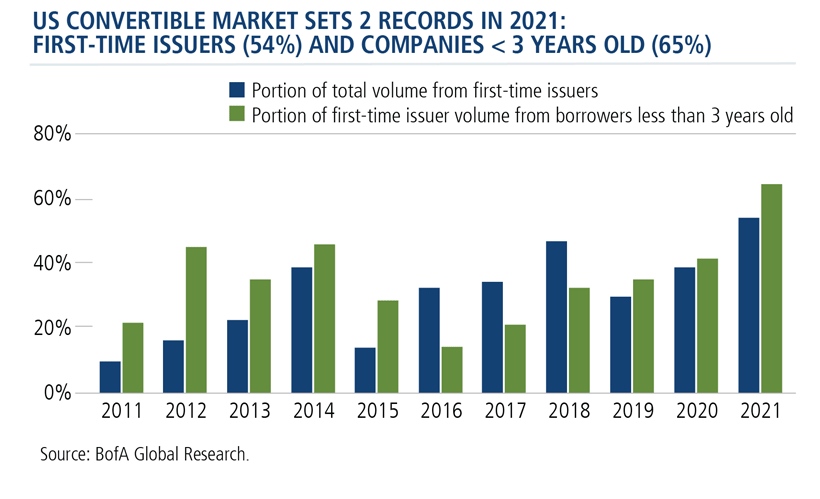
“Why is this important?” he asked. “Well, nobody’s really heard of these companies two or three years ago. They've come to the market and they are incredibly strong growers, with incredibly strong revenue growth and great exposure to some long-term secular themes—payment systems, crypto or blockchain, data maintenance, data security, consumer finance, internet security.”
“We’re getting into them at an earlier stage in their life cycle,” he continued. “We think the analysts do a great job in terms of helping us pick the best names for the portfolios. But these companies often have drawdowns and the market doesn’t go straight up. So, what you find is that the convert universe is a great way to play these great young companies.”
Whether you expect market or individual issuer volatility in 2022, both Wysocki and Vacko said, volatility in convertible investing can create opportunity. This was most recently and dramatically demonstrated in 2020, a year when CICVX was up 48.77%.
Investment professionals, for more information about using convertibles as a fixed income alternative, contact your Calamos Investment Consultant at 888-571-2567 or caminfo@calamos.com.
Click here to view CICVX's standardized performance.
Before investing, carefully consider the fund’s investment objectives, risks, charges and expenses. Please see the prospectus and summary prospectus containing this and other information which can be obtained by calling 1-866-363-9219. Read it carefully before investing.
Past performance is no guarantee of future results. Current performance may be lower or higher than the performance quoted. The principal value and return of an investment will fluctuate so that your shares, when redeemed, may be worth more or less than their original cost. Performance reflected at NAV does not include the Fund’s maximum front-end sales load of 2.25%. Had it been included, the Fund’s return would have been lower. You can obtain performance data current to the most recent month end by visiting www.calamos.com.
Opinions and estimates offered constitute our judgment and are subject to change without notice, as are statements of financial market trends, which are based on current market conditions. We believe information provided here is reliable, but do not warrant its accuracy or completeness. The material is not intended as an offer or solicitation for the purchase of any financial instrument. The views and strategies described may not be suitable for all investors. This material has been prepared for informational purposes only and is not intended to provide—and should not be relied on for—accounting, legal or tax advice. References to future returns are not promises or even estimates of actual returns a client may achieve. Any forecasts contained herein are for illustrative purposes only and are not to be relied upon as advice or interpreted as a recommendation. The securities highlighted are discussed for illustrative purposes only. They are not recommendations.
The principal risks of investing in the Calamos Convertible Fund include: convertible securities risk consisting of the potential for a decline in value during periods of rising interest rates and the risk of the borrower to miss payments, synthetic convertible instruments risk consisting of fluctuations inconsistent with a convertible security and the risk of components expiring worthless, foreign securities risk, equity securities risk, interest rate risk, credit risk, high yield risk, portfolio selection risk and liquidity risk. As a result of political or economic instability in foreign countries, there can be special risks associated with investing in foreign securities, including fluctuations in currency exchange rates, increased price volatility and difficulty obtaining information. In addition, emerging markets may present additional risk due to potential for greater economic and political instability in less developed countries.
808623A 222
Archived material may contain dated performance, risk and other information. Current performance may be lower or higher than the performance quoted in the archived material. For the most recent month-end fund performance information visit www.calamos.com. Archived material may contain dated opinions and estimates based on our judgment and are subject to change without notice, as are statements of financial market trends, which are based on current market conditions at the time of publishing. We believed the information provided here was reliable, but do not warrant its accuracy or completeness. This material is not intended as an offer or solicitation for the purchase or sale of any financial instrument. The views and strategies described may not be suitable for all investors. This material has been prepared for informational purposes only, and is not intended to provide, and should not be relied on for, accounting, legal or tax advice. References to future returns are not promises or even estimates of actual returns a client portfolio may achieve. Any forecasts contained herein are for illustrative purposes only and are not to be relied upon as advice or interpreted as a recommendation.
Performance data quoted represents past performance, which is no guarantee of future results. Current performance may be lower or higher than the performance quoted. The principal value and return of an investment will fluctuate so that your shares, when redeemed, may be worth more or less than their original cost. Performance reflected at NAV does not include the Fund’s maximum front-end sales load. Had it been included, the Fund’s return would have been lower.
Archived on February 03, 2023Cookies
This website uses cookies. By continuing to use this website, you consent to the use of cookies. Learn more about our cookie usage.

