How Emerging Markets Have Progressed in the Last Year: One Snapshot at a Time
June 19, 2017
Investors are notoriously bad at market timing. Nowhere has this been more evident than in emerging markets where outflows typically precede outperformance. EM has not been for the faint of heart (or for those lacking conviction). Consider this example from last year: January 20 was one of EM’s five worst days. Just two days later, January 22 was one of its best (and see this post).
Stop and start exposure to EM poorly serves investors, Calamos believes. As a part of our effort to make the case for a consistent allocation to emerging markets, one year ago we introduced a newsletter for tracking the growth and development of emerging markets.
The weekly drip, drip, drip of a single EM-centered chart, we hoped, would keep a focus on changes that are attracting investment capital to the part of the world that’s experiencing the greatest GDP growth.
In fact, conditions are changing fast, and even our one-year-old publication has captured some of the change. This year the MSCI Emerging Markets Index dropped to -1.43% at its lowest and rose to 29.21% at its highest. And, the largely unexpected U.S. presidential election temporarily threw emerging markets off their path.
The following are a few insights of how emerging markets have progressed, 50-plus charts later.
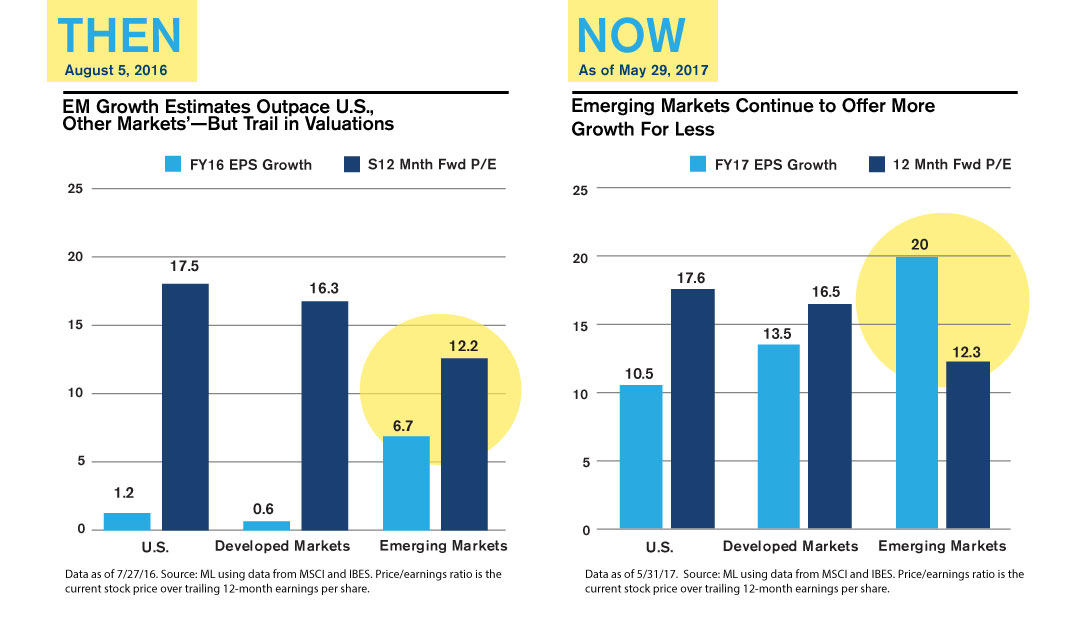
U.S., Other Markets’ Growth Underestimated—but EM Still More Attractive
A look back at this chart from August 5, 2016, is a reminder of the weak expectations investors had for the United States and other developed markets, although they were trading at healthy prices. Fast forward and EPS growth estimates have significantly improved in the U.S. and developed markets. So much so that there’s a risk of investors delaying EM exposure.
This pickup in economic and earnings growth notwithstanding, the long-term case remains: Even while P/Es have risen slightly in emerging markets, they offer still more growth and still for less.
(Click image to enlarge)
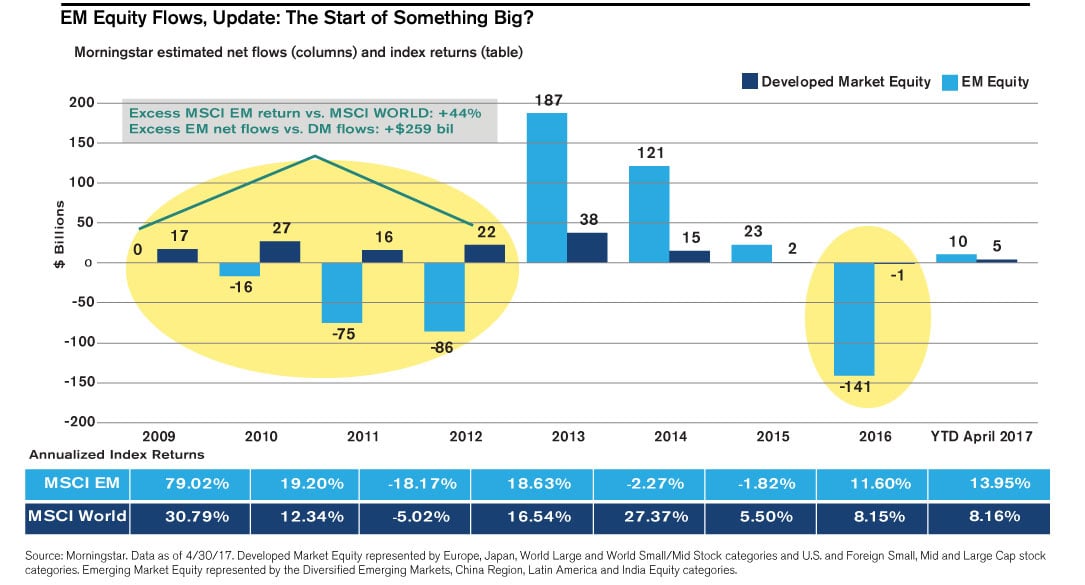
The Start of Something Big?
Nine months into 2016, our team spotted a tide turning: “Fund flows and performance tend to go hand in hand, and when there’s a change in direction, it’s often a multiple year trend,” the EM Snapshot reported on September 9. While funds were flowing out of developed markets in a year of sagging performance, emerging markets had begun to attract higher net flows.
Ultimately, EM equities funds ended the year with negative net flows, but they had far outperformed developed markets funds. Year to date (through April 2017), EM equity funds have experienced positive net flows. As reported in the June 2, 2017, Snapshot, EMs have attracted $4.7 billion through April 30 versus $178 million through April of last year. And, emerging markets posted better performance versus their DM counterparts.
(Click image to enlarge)
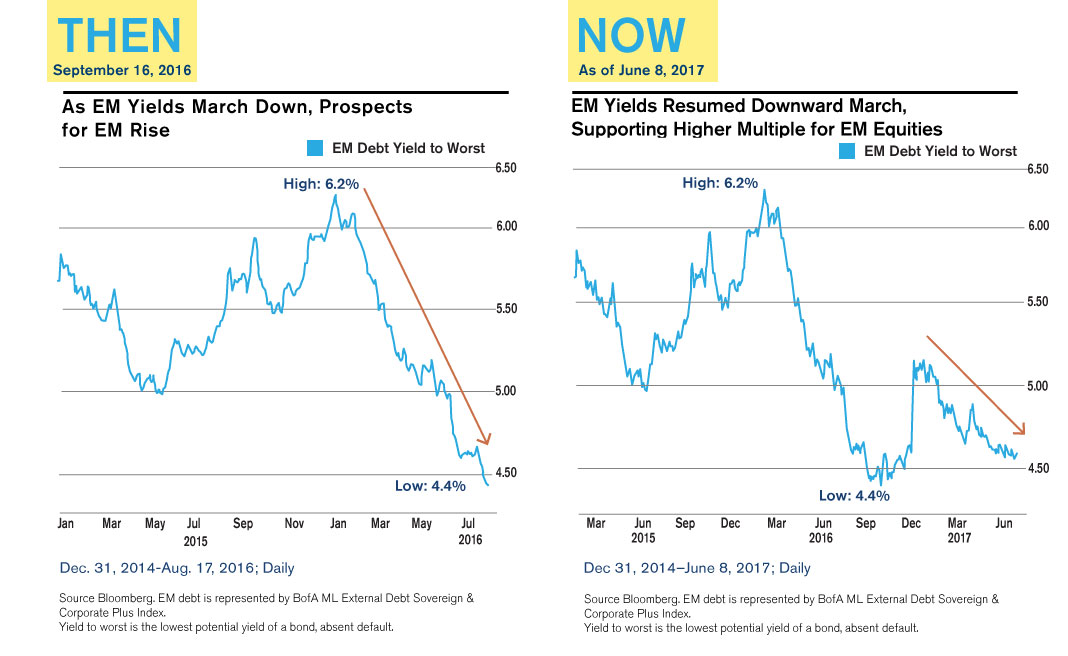
Yields Fell and Then Fell Some More
Yields rose globally following the U.S. election in November 2016. Starting in December of last year, they’ve resumed their downward march. A decrease in EM yields both lowers the cost of funding and supports a higher multiple for EM equities.
(Click image to enlarge)
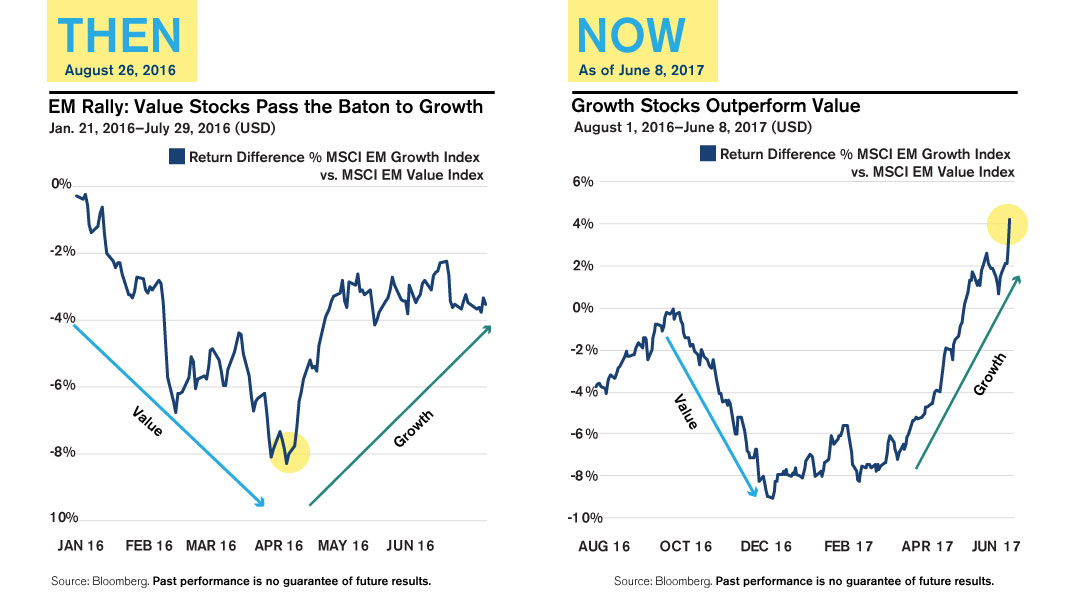
Growth Takes Hold
Lower quality drove much of the 2016 emerging markets performance. As noted in our August 26 Snapshot, we spotted the baton being passed from value to growth (higher quality) stocks in April last year.
Value took over worldwide starting in October ahead of the U.S. election, and emerging markets underperformed developed markets for the rest of the year. Since March, higher quality has driven the markets. As highlighted in our June 9, 2017, Snapshot, high quality companies (those with return on invested capital [ROIC]) of 25% or more this year are easily besting the return of the MSCI Emerging Markets Index.
(Click image to enlarge)
Financial advisors, for more information about outlook or about Calamos Evolving World Growth Fund or Calamos Emerging Market Equity Fund, please talk to your Calamos Investment Consultant at 888-571-2567 or caminfo@calamos.com
Before investing, carefully consider the fund’s investment objectives, risks, charges and expenses. Please see the prospectus and summary prospectus containing this and other information which can be obtained by calling 1-866-363-9219. Read it carefully before investing.
The opinions referenced are as of the date of publication and are subject to change due to changes in the market or economic conditions and may not necessarily come to pass. Information contained herein is for informational purposes only and should not be considered investment advice.
The principal risks of investing in the Calamos Evolving World Growth Fund include: equity securities risk, growth stock risk, foreign securities risk, emerging markets risk, convertible securities risk and portfolio selection risk.
As a result of political or economic instability in foreign countries, there can be special risks associated with investing in foreign securities, including fluctuations in currency exchange rates, increased price volatility and difficulty obtaining information. In addition, emerging markets may present additional risk due to potential for greater economic and political instability in less developed countries.
The value of a convertible security is influenced by changes in interest rates, with investment value declining as interest rates increase and increasing as interest rates decline. The credit standing of the issuer and other factors also may have an effect on the convertible security’s investment value. The principal risks of investing in Calamos Emerging Market Equity Fund: equity securities risk consisting of market prices declining in general, growth stock risk consisting of potential increased volatility due to securities trading at higher multiples, foreign securities risk, emerging markets risk, currency risk, geographic concentration risk, American depository receipts, mid-size company risk, small company risk, portfolio turnover risk and portfolio selection risk.
The MSCI Emerging Markets Index is a free float-adjusted market capitalization index that is designed to measure equity market performance of emerging markets. The index is calculated without dividends, with net or with gross dividends reinvested, in both U.S. dollars and local currencies.
Unmanaged index returns assume reinvestment of any and all distributions and, unlike fund returns, do not reflect fees, expenses or sales charges. Investors cannot invest directly in an index.
NOT FDIC INSURED | MAY LOSE VALUE | NO BANK GUARANTEE
800301 0617 R
Archived material may contain dated performance, risk and other information. Current performance may be lower or higher than the performance quoted in the archived material. For the most recent month-end performance information, please CLICK HERE. Archived material may contain dated opinions and estimates based on our judgment and are subject to change without notice, as are statements of financial market trends, which are based on current market conditions at the time of publishing. We believed the information provided here was reliable, but do not warrant its accuracy or completeness. This material is not intended as an offer or solicitation for the purchase or sale of any financial instrument. The views and strategies described may not be suitable for all investors. This material has been prepared for informational purposes only, and is not intended to provide, and should not be relied on for, accounting, legal or tax advice. References to future returns are not promises or even estimates of actual returns a client portfolio may achieve. Any forecasts contained herein are for illustrative purposes only and are not to be relied upon as advice or interpreted as a recommendation.
Performance data quoted represents past performance, which is no guarantee of future results. Current performance may be lower or higher than the performance quoted. The principal value and return of an investment will fluctuate so that your shares, when redeemed, may be worth more or less than their original cost. Performance reflected at NAV does not include the Fund’s maximum front-end sales load. Had it been included, the Fund’s return would have been lower. For the most recent month-end fund performance information visit www.calamos.com.
Archived material may contain dated performance, risk and other information. Current performance may be lower or higher than the performance quoted in the archived material. For the most recent month-end fund performance information visit www.calamos.com. Archived material may contain dated opinions and estimates based on our judgment and are subject to change without notice, as are statements of financial market trends, which are based on current market conditions at the time of publishing. We believed the information provided here was reliable, but do not warrant its accuracy or completeness. This material is not intended as an offer or solicitation for the purchase or sale of any financial instrument. The views and strategies described may not be suitable for all investors. This material has been prepared for informational purposes only, and is not intended to provide, and should not be relied on for, accounting, legal or tax advice. References to future returns are not promises or even estimates of actual returns a client portfolio may achieve. Any forecasts contained herein are for illustrative purposes only and are not to be relied upon as advice or interpreted as a recommendation.
Performance data quoted represents past performance, which is no guarantee of future results. Current performance may be lower or higher than the performance quoted. The principal value and return of an investment will fluctuate so that your shares, when redeemed, may be worth more or less than their original cost. Performance reflected at NAV does not include the Fund’s maximum front-end sales load. Had it been included, the Fund’s return would have been lower.
Archived on June 19, 2018