Here’s An EM Idea For Your Volatility-Shy Clients
November 9, 2017
Two questions for financial advisors:
- Could your clients’ portfolios benefit from the double-digit growth experienced this year in emerging markets and forecast for next?
- But is emerging markets’ notorious volatility giving you and your clients pause?
Here’s an idea that can help limit investors’ downside to lead to better results over time.
Earning More by Losing Less
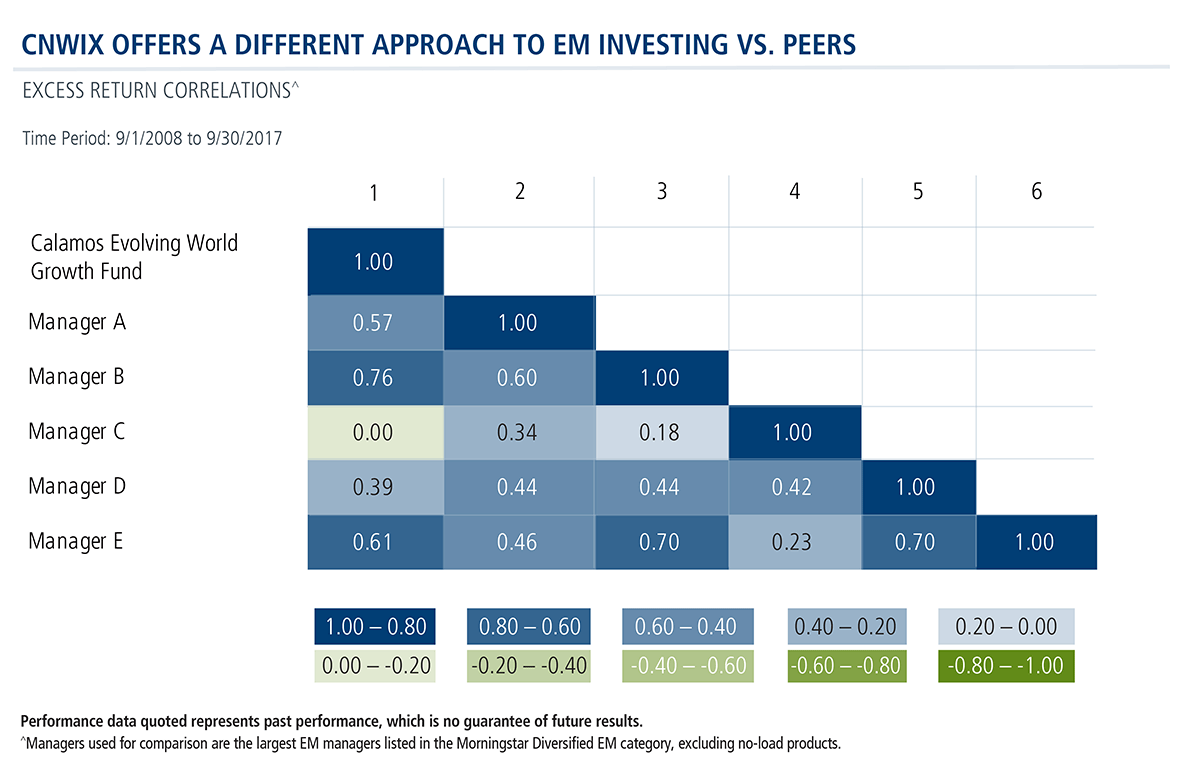
Calamos Evolving World Growth Fund (CNWIX) takes an approach that’s different from the largest emerging markets managers in the Morningstar Diversified EM Category, as shown by excess return correlations shown below.
What CNWIX does:
- Emphasizes companies with higher quality growth fundamentals and durable secular themes
- Widens the opportunity set (via revenue mapping and multinationals) to unlock more opportunities to target growth themes, enable active management and exploit relative value
- Utilizes an advantaged pool of securities, including convertibles to manage the risk/reward profile
- Invests in economies that are enacting structural reforms, with rising economic freedoms
In fact, these differences have led some advisors to add CNWIX as a complementary EM allocation.

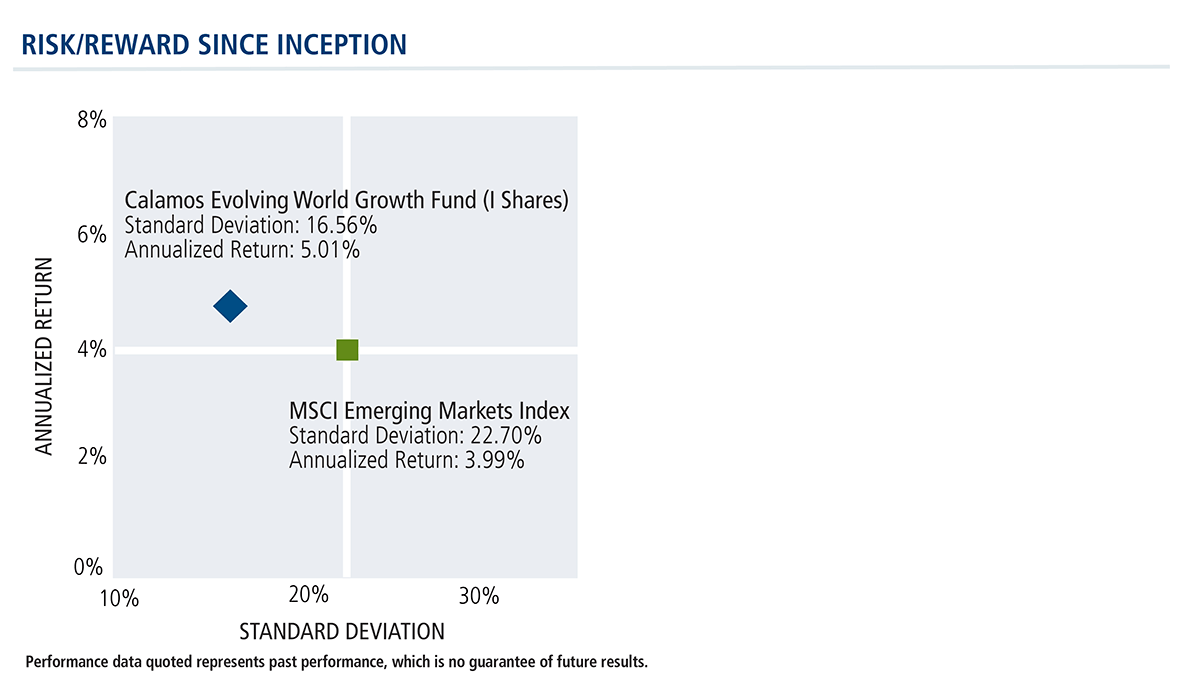
The flexibility of the actively managed CNWIX has also enabled it to mute the effect of volatility. Since its inception, CNWIX has demonstrated lower volatility as measured by standard deviation than the broader EM equity market, represented by the MSCI EM Index.

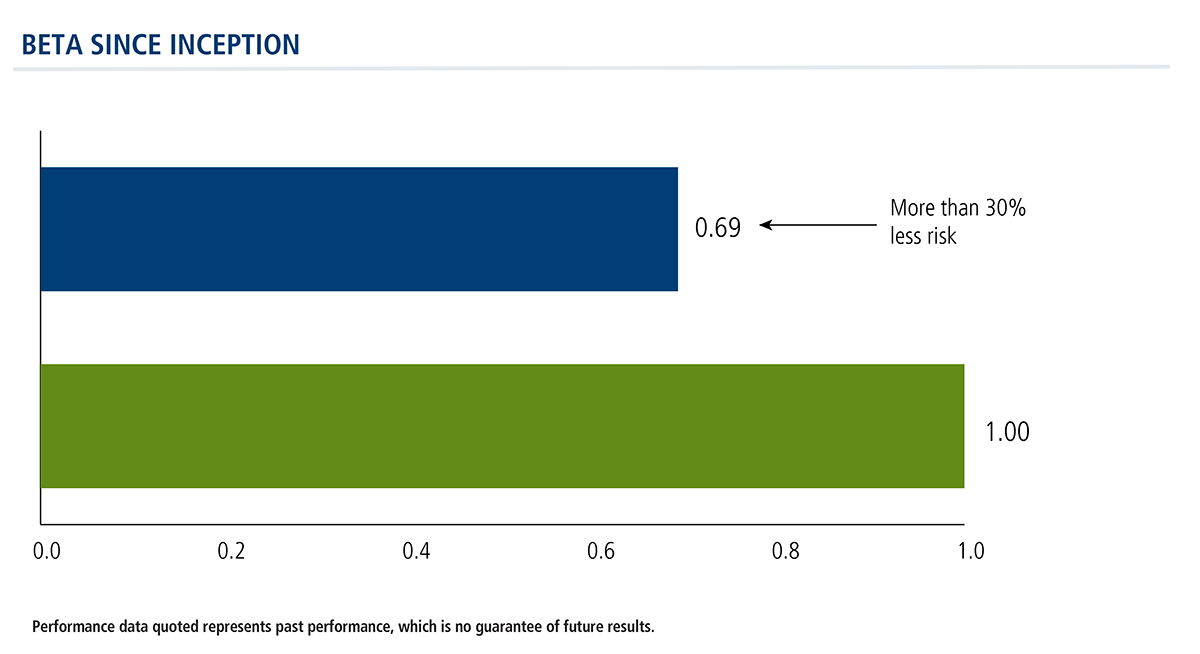
CNWIX has outperformed the broad index with less risk since inception in August 2008, as measured by a beta of 0.69, a popular statistic for gauging historically volatility.

When Pullbacks Occur
Advisors include emerging markets in portfolios on the conviction that the long-term trend is up. But there will be periods when EM struggles.
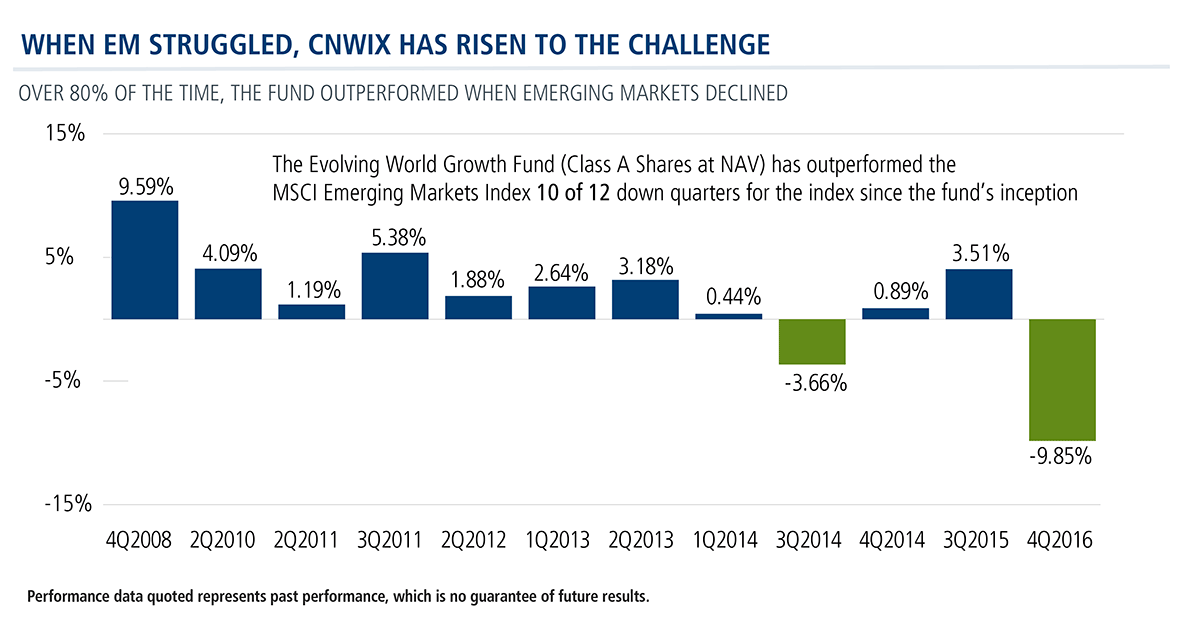
Emerging markets have experienced 12 down quarters since the fund’s inception nine years ago. CNWIX has finished positive in 10 of those 12.

Historically, CNWIX has demonstrated its resilience in turbulent markets compared to the MSCI EM Index.

To learn more about our Global Equity Team’s approach to EM investing and outlook, talk to your Calamos Investment Consultant at 888-571-2567 or caminfo@calamos.com.
Before investing, carefully consider the fund’s investment objectives, risks, charges and expenses. Please see the prospectus and summary prospectus containing this and other information which can be obtained by calling 1-866-363-9219. Read it carefully before investing.
Data as of 9/30/17. Sources: Morningstar, State Street Corporation, and Lipper, Inc.
**Growth stock risk consists of potential increased volatility due to securities trading at higher multiples.
All risk-adjusted statistics are relative to the MSCI Emerging Markets Index on an annualized basis, versus the Calamos Evolving World Growth Fund Class I shares. Data shown is from 9/1/2008, the first full month following the inception date of 8/15/2008.

Performance data quoted represents past performance, which is no guarantee of future results. Current performance may be lower or higher than the performance quoted. The principal value of an investment will fluctuate so that your shares, when redeemed, may be worth more or less than their original cost. A Shares at NAV returns do not include the fund's maximum 4.75% front-end sales load, had it been included returns would have been lower. You can obtain performance data current to the most recent month end by visiting www.calamos.com.
As of the prospectus dated 2/28/17, the gross expense ratio for Class A shares is 1.64% and 1.39% for Class I Shares.
The principal risks of investing in the Evolving World Growth Fund include: the risk the equity market will decline in general, the risks associated with growth securities which tend to trade at higher multiples and be more volatile, the risks associated with foreign securities including currency exchange rate risk, the risks associated with emerging markets which may have less stable governments and greater sensitivity to economic conditions, and the risks associated with convertible securities, which may decline in value during periods of rising interest rates. Equity securities risk consists of market prices declining in general.
Beta is historic measure of a fund's relative volatility, which is one of the measures of risk; a beta of 0.5 reflects 1/2 the market's volatility as represented by the MSCI EM Index, while a beta of 2.0 reflects twice the market's volatility.
Standard deviation is measure of volatility.
R-squared is a mathematical measure that describes how closely a security’s movement reflects movements in a benchmark.
Information ratio is the measurement of the performance returns of a portfolio against the performance volatility of an index or benchmark.
Upside capture ratio measures a manager's performance in up markets relative to the named index itself. It is calculated by taking the security's upside capture return and dividing it by the benchmark's upside capture return.
Sharpe ratio is a calculation that reflects the reward per each unit of risk in a portfolio. The higher the ratio, the better the portfolio's risk-adjusted return is.
Class I Shares are offered primarily for direct investment by investors through certain tax-exempt retirement plans and by institutional clients, provided such plans or clients have assets of at least $1 million. For eligibility requirements and other available share classes see the prospectus and other Fund documents at www.calamos.com.
Returns greater than 12 months are annualized. Annualized total return measures net investment income and capital gain or loss from portfolio investments as an annualized average assuming reinvestment of dividends and capital gains distributions. In calculating net investment income, all applicable fees and expenses are deducted from the returns.
*Index data is shown from 8/31/08, since comparative index data is only available for full monthly periods. Portfolios are managed according to their respective strategies which may differ significantly in terms of security holdings, industry weightings and asset allocation from those of the benchmark(s). Portfolio performance, characteristics and volatility may differ from the benchmark(s) shown.
800889 1117

