Today’s Opportunity: Take Interest Rate Risk Out of Portfolios Without Surrendering Yield
July 29, 2022
Investors should receive additional yield for locking their dollars up for longer periods of time. That’s a generally accepted expectation of fixed income investing—it’s a phenomenon often referred to as a “term premium.”
In most economic environments, particularly those associated with growth, this results in a yield curve that is upward sloping. One built-in assumption of a “normal” yield curve is financial markets’ anticipation of higher interest rates in the future.
But, a flattening yield curve develops from at least one of two drivers:
- Bear flattening: Short-term rates may rise faster than long-term rates either in response to or anticipation of the Federal Reserve raising its overnight rate—the decline in short maturity bond prices are driving the change in shape.
- Bull flattening: This occurs when long-term rates are declining more than short-term rates as long bond prices rally. While several potential drivers exist, a bull flattening usually develops as a result of lower market expectations for growth and inflation.
What’s unique about today is that both bull tendencies in the long-term market and bear tendencies in the short-term market are contributing to the flat yield curve environment. The market consensus is that the Fed will have to tighten policy considerably more from its current stance to make material progress in its fight against inflation. At the same time, the recent rally in long-dated Treasuries indicates that long-term growth potential and inflation expectations are muted.
In flat yield curve environments, investors have an opportunity to take interest rate risk out of portfolio positions without giving up valuable yield.
For example, the yield differential between the Bloomberg US Government/Credit 1-3 Years Index and the Bloomberg US Aggregate Bond Index sat at 28 basis points after July's rate announcement, which would represent the tightest month-end reading of the last two decades. This compares to an average spread of 128 points over 20-year period.
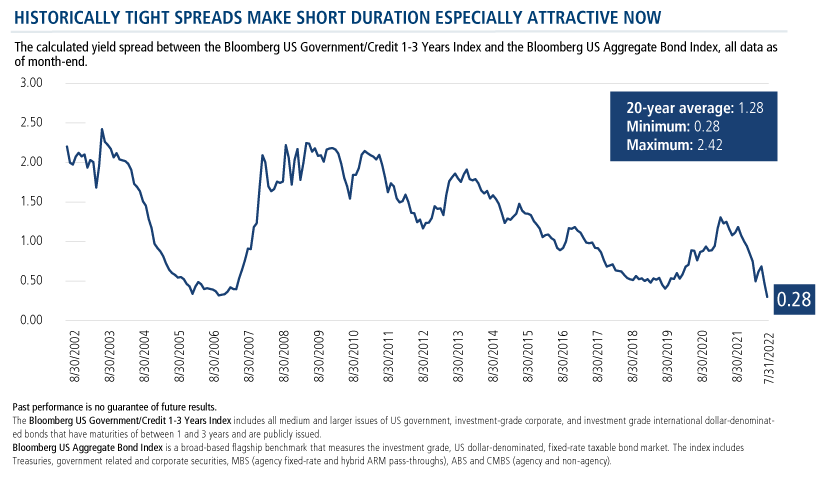
In exchange for giving up only 28 basis points in yield, investors could pivot from a core fixed income strategy with a duration of over six years to a short-duration strategy with a duration near two years. Today’s environment provides an attractive trade-off for those concerned about further interest rate volatility.
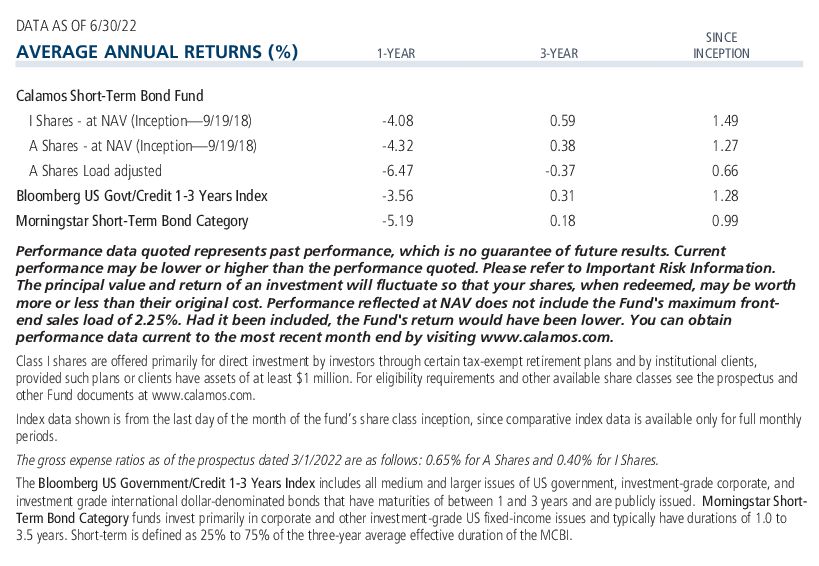
Investment professionals, do you find yourself talking about higher rates with clients more than you ever remember? Here’s an idea for allaying their concerns: Calamos Short-Term Bond Fund (CSTIX). CSTIX is managed for clients seeking current income accompanied by lower volatility over a one- to two-year horizon—ideally, just until markets settle down.
For more information, contact your Calamos Investment Consultant at 888-571-2567 or email caminfo@calamos.com.
Before investing, carefully consider the fund’s investment objectives, risks, charges and expenses. Please see the prospectus and summary prospectus containing this and other information which can be obtained by calling 1-866-363-9219. Read it carefully before investing.
The principal risks of investing in the Calamos Short-Term Bond Fund include: interest rate risk consisting of loss of value for income securities as interest rates rise, credit risk consisting of the risk of the borrower to miss payments, high yield risk, liquidity risk, mortgage-related and other asset-back securities risk, including extension risk and prepayment risk, US Government security risk, foreign securities risk, non-US Government obligation risk and portfolio selection risk. As a result of political or economic instability in foreign countries, there can be special risks associated with investing in foreign securities, including fluctuations in currency exchange rates, increased price volatility and difficulty obtaining information. In addition, emerging markets may present additional risk due to potential for greater economic and political instability in less developed countries.
Morningstar Short-Term Bond Category funds invest primarily in corporate and other investment-grade US fixed-income issues and typically have durations of 1.0 to 3.5 years. Short-term is defined as 25% to 75% of the three-year average effective duration of the MCBI.
The Bloomberg US Government/Credit 1-3 Years Index includes all medium and larger issues of US government, investment-grade corporate, and investment grade international dollar-denominated bonds that have maturities of between 1 and 3 years and are publicly issued.
Bloomberg US Aggregate Bond Index is a broad-based flagship benchmark that measures the investment grade, US dollar-denominated, fixed-rate taxable bond market. The index includes Treasuries, government related and corporate securities, MBS (agency fixed-rate and hybrid ARM pass-throughs), ABS and CMBS (agency and non-agency).
810211 822
Archived material may contain dated performance, risk and other information. Current performance may be lower or higher than the performance quoted in the archived material. For the most recent month-end fund performance information visit www.calamos.com. Archived material may contain dated opinions and estimates based on our judgment and are subject to change without notice, as are statements of financial market trends, which are based on current market conditions at the time of publishing. We believed the information provided here was reliable, but do not warrant its accuracy or completeness. This material is not intended as an offer or solicitation for the purchase or sale of any financial instrument. The views and strategies described may not be suitable for all investors. This material has been prepared for informational purposes only, and is not intended to provide, and should not be relied on for, accounting, legal or tax advice. References to future returns are not promises or even estimates of actual returns a client portfolio may achieve. Any forecasts contained herein are for illustrative purposes only and are not to be relied upon as advice or interpreted as a recommendation.
Performance data quoted represents past performance, which is no guarantee of future results. Current performance may be lower or higher than the performance quoted. The principal value and return of an investment will fluctuate so that your shares, when redeemed, may be worth more or less than their original cost. Performance reflected at NAV does not include the Fund’s maximum front-end sales load. Had it been included, the Fund’s return would have been lower.
Archived on July 29, 2023