Entice Those Cash-hoarders with Yield: CSTIX
August 17, 2022
First published: July 21, 2022
What’s not to like about Calamos Short-Term Bond Fund? Here’s a list of what makes CSTIX so appealing right now:
Calamos Short-Term Bond Fund (CSTIX)
Morningstar Overall RatingTM Among 522 Short-Term Bond funds. The Fund's risk-adjusted returns based on load-waived Class I Shares had 4 stars for 3 years and 4 stars for 5 years out of 522 and 482 Short-Term Bond Funds, respectively, for the period ended 6/30/2024.
Morningstar Sustainability Rating

Morningstar Sustainability RatingTM Out of 3875 US Fixed Income funds as of 5/31/2024. Based on 78.88% of AUM. Data is based on long positions only.
- Its 3.25% SEC yield (as of 7/31/22) is likely to turn the heads of even the most fervent cash-hoarders or those earning short of 2% in high yield money market funds.
- This compelling yield is made possible by a broad diversification across asset classes that include Treasuries, corporate debt, asset-backed securities, high yield and bank loans—85% of it investment grade as of 7/31/22. By prospectus, the fund can’t invest in more than 20% non-investment grade.
- Its Morningstar bonafides include four stars and four globes acknowledging its ESG integration.
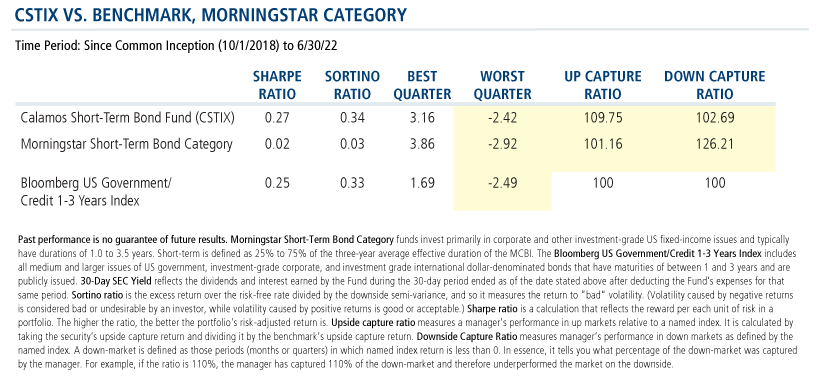
“Investors have two objectives with a short-term bond fund,” says Christian Brobst, Vice President, Co-Portfolio Manager. “Return consistency and capital preservation.”
Consider CSTIX’s performance: Since the fund’s inception in 2018, its worst quarter was 50 basis points better than the category average. Its down capture ratio was much lower. And, here’s a note about CSTIX’s peers: The category average had a higher down capture ratio than upside capture ratio—that’s not been the case with the Calamos fund.
We hear just one pushback from the uninitiated, and that’s some apprehension about trading duration risk for credit risk. Here’s how Matt Freund, Co-CIO, Head of Fixed Income Strategies and Senior Co-Portfolio Manager, addressed the topic of using bank loans in short-duration strategies at a recent meeting of investment professionals.
“Yes, the risks are a little bit higher, but we’re senior in the credit structure and we carefully evaluate our covenant package. You generally don’t disappoint your bankers. Bondholders can get hurt all the time, but your bankers you want to keep friendly,” said Freund.
Selective inclusion of loans in the current environment provides dual benefits, according to our team. On one hand, the senior position in debt capital structures can afford additional protection against credit deterioration in an economic slowdown. Conversely, if the Federal Reserve policy changes result in raising rates beyond market expectations to cool inflation, loan interest rates will reset higher as policy rates are tightened.
“We’ve been able to deliver a pretty competitive yield without taking the risk that some funds in the space do,” said Chuck Carmody, Senior Vice President, Co-Portfolio Manager and Senior Fixed Income Trader. The fund is capped by prospectus at 20% exposure to holdings below investment grade, he added.
"Given the strength of fundamentals, broadly speaking, we think that liquidity is not going to be an issue,” Carmody said. “All of these companies should be able to refinance or repay this debt so we don’t think there’s a lot of risk there. There’s some nice optionality around loans and the potential if we do see higher rates.”
Investment professionals, three months ago we encouraged you to break up with TINA* now that CINDY** has so much going for it (see the post). Since then, the yields have continued to climb, and we expect the upward trend to continue.
For more about how CSTIX may make sense in your clients’ portfolio today, contact your Calamos Investment Consultant at 888-571-2567 or caminfo@calamos.com.
*As in there has been no alternative to equities
**Less well known but on the verge of breaking out: CINDY=Credit is now delivering yield
Before investing, carefully consider the fund’s investment objectives, risks, charges and expenses. Please see the prospectus and summary prospectus containing this and other information which can be obtained by calling 1-866-363-9219. Read it carefully before investing.
The principal risks of investing in the Calamos Short-Term Bond Fund include: interest rate risk consisting of loss of value for income securities as interest rates rise, credit risk consisting of the risk of the borrower to miss payments, high yield risk, liquidity risk, mortgage-related and other asset-back securities risk, including extension risk and prepayment risk, US Government security risk, foreign securities risk, non-US Government obligation risk and portfolio selection risk. As a result of political or economic instability in foreign countries, there can be special risks associated with investing in foreign securities, including fluctuations in currency exchange rates, increased price volatility and difficulty obtaining information. In addition, emerging markets may present additional risk due to potential for greater economic and political instability in less developed countries.
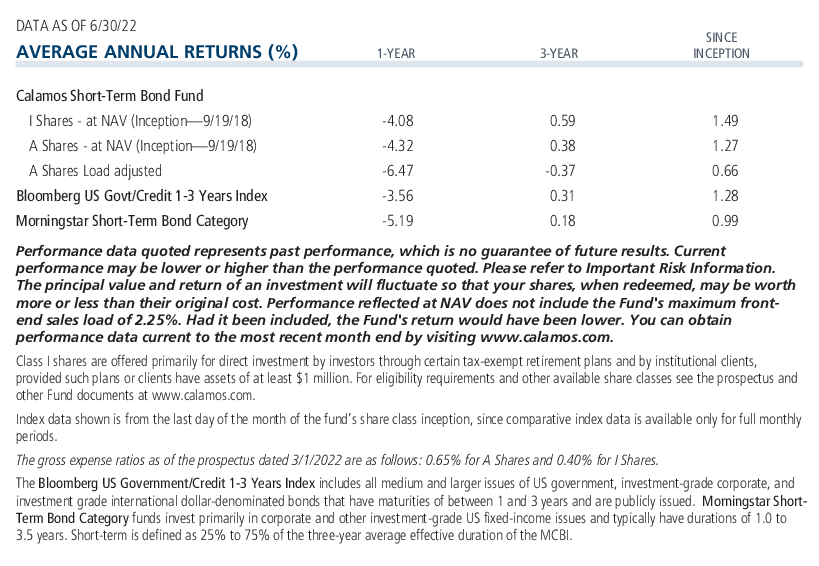
Morningstar Short-Term Bond Category funds invest primarily in corporate and other investment-grade US fixed-income issues and typically have durations of 1.0 to 3.5 years. Short-term is defined as 25% to 75% of the three-year average effective duration of the MCBI.
The Bloomberg US Government/Credit 1-3 Years Index includes all medium and larger issues of US government, investment-grade corporate, and investment grade international dollar-denominated bonds that have maturities of between 1 and 3 years and are publicly issued.
30-Day SEC Yield reflects the dividends and interest earned by the Fund during the 30-day period ended as of the date stated above after deducting the Fund’s expenses for that same period.
Sortino ratio is the excess return over the risk-free rate divided by the downside semi-variance, and so it measures the return to “bad” volatility. (Volatility caused by negative returns is considered bad or undesirable by an investor, while volatility caused by positive returns is good or acceptable.)
Sharpe ratio is a calculation that reflects the reward per each unit of risk in a portfolio. The higher the ratio, the better the portfolio's risk-adjusted return is.
Upside capture ratio measures a manager’s performance in up markets relative to a named index. It is calculated by taking the security’s upside capture return and dividing it by the benchmark’s upside capture return.
Downside Capture Ratio measures manager’s performance in down markets as defined by the named index. A down-market is defined as those periods (months or quarters) in which named index return is less than 0. In essence, it tells you what percentage of the down-market was captured by the manager. For example, if the ratio is 110%, the manager has captured 110% of the down-market and therefore underperformed the market on the downside.
Morningstar RatingsTM are based on risk-adjusted returns and are through 6/30/22 for the share class listed and will differ for other share classes. Morningstar ratings are based on a risk-adjusted return measure that accounts for variation in a fund's monthly historical performance (reflecting sales charges), placing more emphasis on downward variations and rewarding consistent performance. Within each asset class, the top 10%, the next 22.5%, 35%, 22.5%, and the bottom 10% receive 5, 4, 3, 2 or 1 star, respectively. Each fund is rated exclusively against US domiciled funds. The information contained herein is proprietary to Morningstar and/or its content providers; may not be copied or distributed; and is not warranted to be accurate, complete or timely. Neither Morningstar nor its content providers are responsible for any damages or losses arising from any use of this information. Source: ©2022 Morningstar, Inc.
Historical Sustainability Score as of 5/31/2022. Sustainability Rating as of 5/31/2022. Sustainalytics provides company-level analysis used in the calculation of Morningstar's Historical Sustainability Score. ©2022 Morningstar. All rights reserved. The information contained herein: (1) is proprietary to Morningstar and/or its content providers; (2) may not be copied or distributed; and (3) is not warranted to be accurate, complete, or timely. Neither Morningstar nor its content providers are responsible for any damages or losses arising from any use of this information. The Morningstar® Sustainability Rating is intended to measure how well the issuing companies of securities within a fund's portfolio are managing their environmental, social, and governance ("ESG") risks and opportunities relative to the fund's Morningstar category peers. The Morningstar Sustainability Rating calculation is a three-step process. First, each fund with at least 67% of assets covered by a company level ESG score from Sustainalytics receives a Morningstar® Portfolio Sustainability Score?, an asset weighted-average of normalized company level ESG scores with deductions made for controversial incidents by issuing companies, such as environmental accidents, fraud, or discriminatory behavior. Second, the Portfolio Sustainability Score is rescaled to reflect an exponential weighted moving average of scores over the past 12 months. Third, the Morningstar Sustainability Rating is then assigned to all scored funds within Morningstar Categories in which at least 30 funds received a Portfolio Sustainability Score and is determined by each fund's rank: High (highest 10%); Above Average (next 22.5%); Average (next 35%); Below Average (next 22.5%); Low (lowest 10%). The Morningstar Sustainability Rating is depicted by globe icons where High equals 5 globes and Low equals 1 globe. Past performance is no guarantee of future results.
810201 822
Archived material may contain dated performance, risk and other information. Current performance may be lower or higher than the performance quoted in the archived material. For the most recent month-end fund performance information visit www.calamos.com. Archived material may contain dated opinions and estimates based on our judgment and are subject to change without notice, as are statements of financial market trends, which are based on current market conditions at the time of publishing. We believed the information provided here was reliable, but do not warrant its accuracy or completeness. This material is not intended as an offer or solicitation for the purchase or sale of any financial instrument. The views and strategies described may not be suitable for all investors. This material has been prepared for informational purposes only, and is not intended to provide, and should not be relied on for, accounting, legal or tax advice. References to future returns are not promises or even estimates of actual returns a client portfolio may achieve. Any forecasts contained herein are for illustrative purposes only and are not to be relied upon as advice or interpreted as a recommendation.
Performance data quoted represents past performance, which is no guarantee of future results. Current performance may be lower or higher than the performance quoted. The principal value and return of an investment will fluctuate so that your shares, when redeemed, may be worth more or less than their original cost. Performance reflected at NAV does not include the Fund’s maximum front-end sales load. Had it been included, the Fund’s return would have been lower.
Archived on August 17, 2023