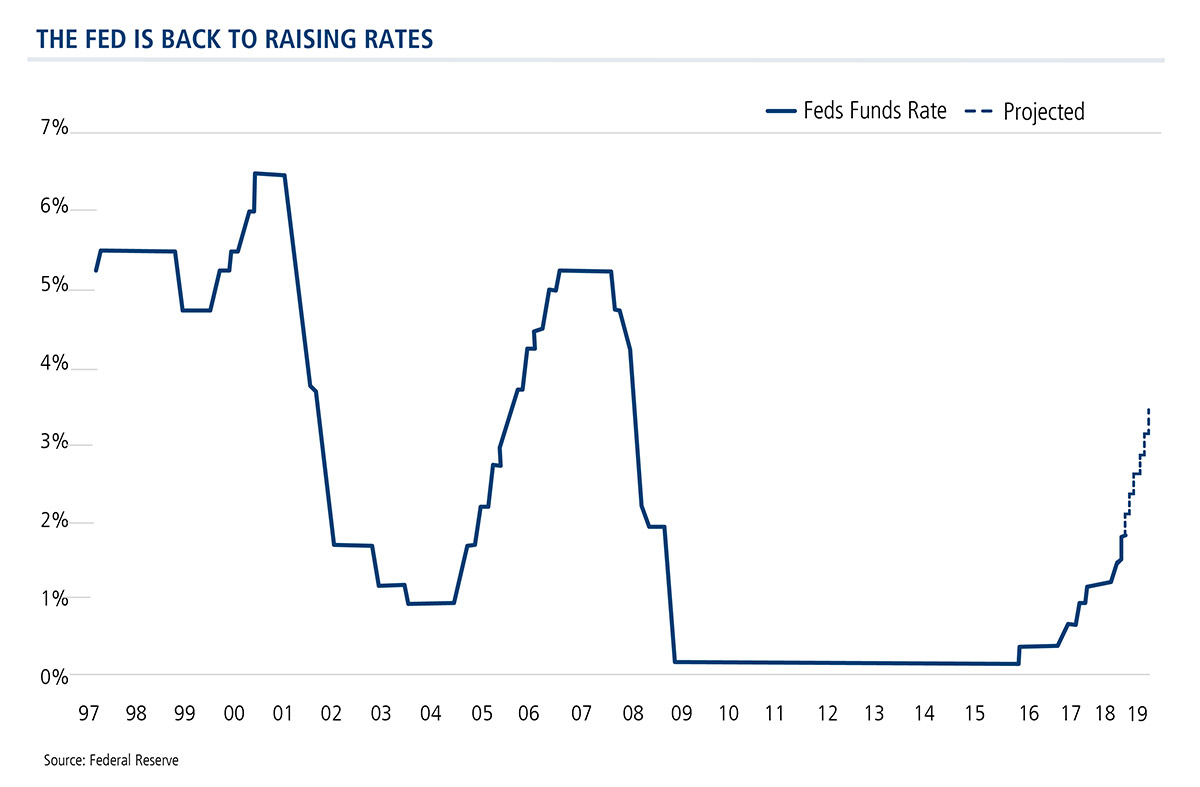
Here we go—Wednesday's Fed funds rate hike confirms the expected direction of interest rates for 2018 and 2019.

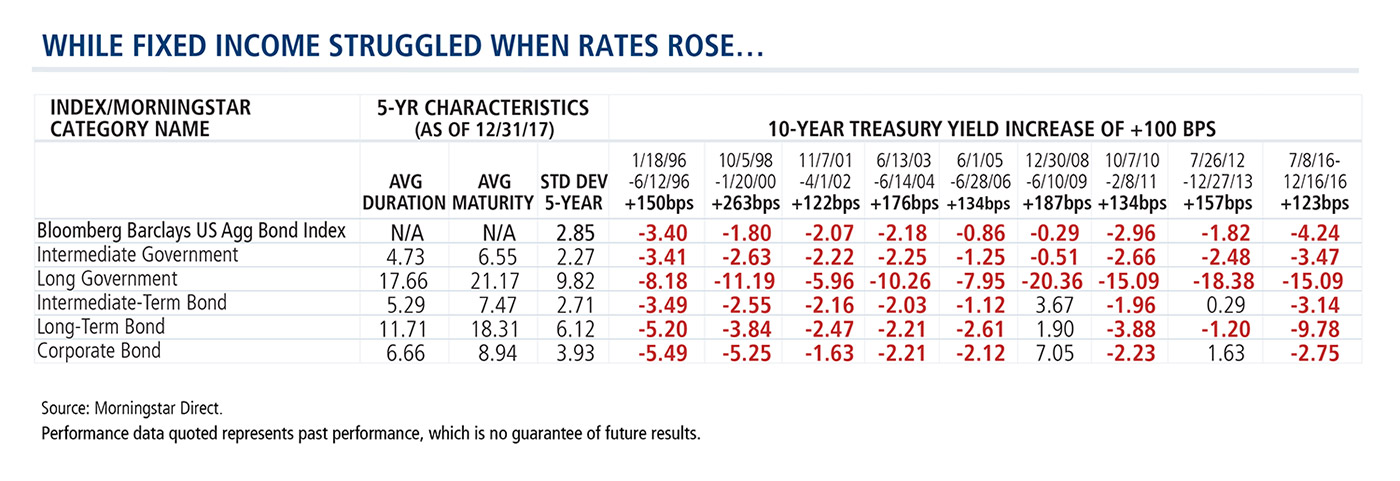
Rising rates can be challenging for the fixed income portion of an investment portfolio. The table below shows the performance of the Bloomberg Barclays U.S. Aggregate Bond Index and five fixed income Morningstar categories—Intermediate Government, Long Government, Intermediate-Term Bond, Long-Term Bond and Corporate Bond—over the last nine periods when the 10-year Treasury yield increased more than 100 basis points.

But, financial advisors, there is something you can do about rising rates: consider a fixed income alternative. We have at least three ideas—all using convertible securities to some degree—for mitigating the effects of rising rates.
Note there are differences between a fixed income fund that invests primarily in debt or bonds and an income fund that also invests in convertible securities. Like bonds, convertibles provide income and potential downside protection in declining markets. A convertible security is a bond that can be exchanged or converted into a specific number of shares of the issuer’s common stock, which represent the potential for upside appreciation in rising equity markets and less sensitivity to rising interest rates. Convertibles bonds are senior to common equity but not to most other forms of debt, and do entail default risk.
Consider These Convertible-Using Funds When Rates Are Rising
- Calamos Market Neutral Income Fund (CMNIX), whose core strategies include covered call writing and convertible arbitrage. Together, they’re used to provide the fund with an enhanced potential for risk-managed returns due to their differing responses to volatility.
- Calamos Growth & Income Fund (CGIIX), investing primarily in U.S. equity and convertible securities in an attempt to balance risk/reward while providing growth and income.
- Calamos Convertible Fund (CICVX) invests primarily in convertible securities of U.S. companies that are diversified across market sectors and credit quality.
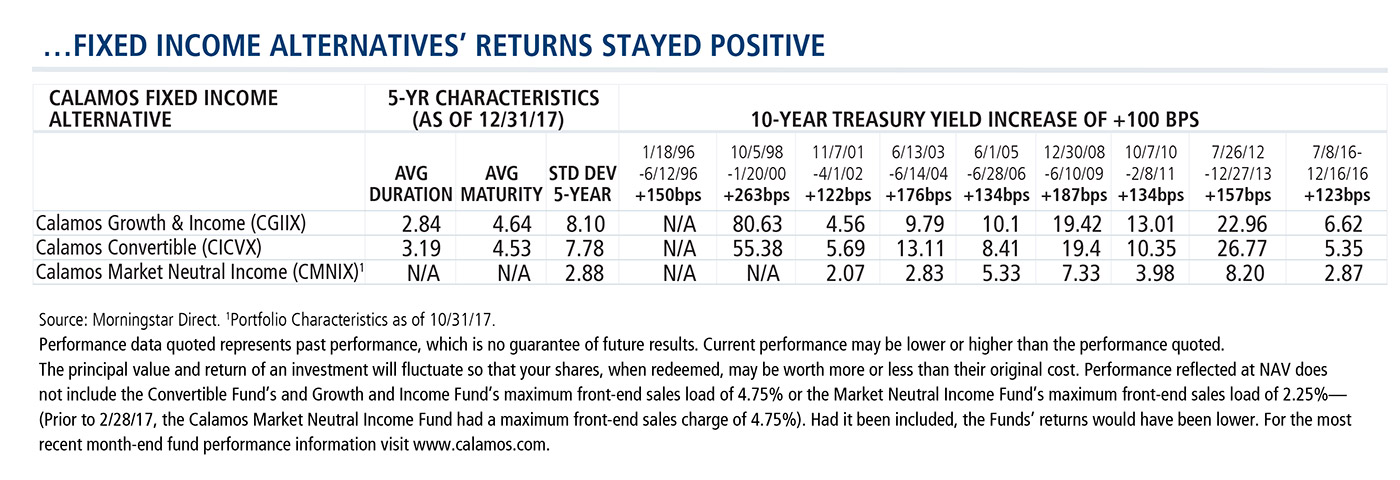
The table below shows how these funds have performed during the same rising rate environments.

Advisors, if you’re looking for new ideas as rates rise, your Calamos Investment Consultant can help. Contact him or her at 888-571-2567 or caminfo@calamos.com.
Before investing, carefully consider the fund’s investment objectives, risks, charges and expenses. Please see the prospectus and summary prospectus containing this and other information which can be obtained by calling 1-866-363-9219. Read it carefully before investing.
Opinions and estimates offered constitute our judgment and are subject to change without notice, as are statements of financial market trends, which are based on current market conditions. We believe the information provided here is reliable, but do not warrant its accuracy or completeness. This material is not intended as an offer or solicitation for the purchase or sale of any financial instrument. The views and strategies described may not be suitable for all investors. This material has been prepared for informational purposes only, and is not intended to provide, and should not be relied on for, accounting, legal or tax advice. References to future returns are not promises or even estimates of actual returns a client portfolio may achieve. Any forecasts contained herein are for illustrative purposes only and are not to be relied upon as advice or interpreted as a recommendation. The S&P 500 Index is considered generally representative of the U.S. stock market. Indexes are unmanaged, do not entail fees or expenses and are not available for direct investment.

Fund Risks
Calamos Market Neutral Income Fund (CMNIX): convertible securities risk, synthetic convertible instruments risk, convertible hedging risk, covered call writing risk, options risk, short sale risk, interest rate risk, credit risk, high yield risk, liquidity risk and portfolio selection risk.
Calamos Convertible Fund (CICVX): convertible securities risk, synthetic convertible instruments risk, foreign securities risk, equity securities risk, interest rate risk, credit risk, high yield risk and portfolio selection risk.
Growth and Income Fund (CGIIX): convertible securities risk, synthetic convertible instruments risk, equity securities risk, growth stock risk, small and mid-sized company risk, interest rate risk, credit risk, high yield risk and portfolio selection risk.
Class I shares are offered primarily for direct investment by investors through certain tax-exempt retirement plans -including 401-k plans, 457 plans, employer-sponsored 403-b plans, profit sharing and money purchase pension plans, defined benefit plans and non-qualified deferred compensation plans and by institutional clients, provided such plans or clients have assets of at least $1 million. Class I shares may also be offered to certain other entities or programs, including, but not limited to, investment companies, under certain circumstances.
Convertible securities consist of the potential for a decline in value during periods of rising interest rates and the risk of the borrower to miss payment.
High yield risk consists of of increased credit and liquidity risks.
Synthetic convertible instruments risk consists of fluctuations inconsistent with a convertible security and the risk of components expiring worthless.
Index Definitions
The Bloomberg Barclays U.S. Aggregate Bond Index is a broad-based benchmark that measures the investment-grade, U.S. dollar-denominated, fixed-rate taxable bond market of SEC-registered securities. The index includes bonds from the Treasury, Government-Related, Corporate, MBS (agency fixed rate and hybrid ARM pass-throughs), ABS, and CMBS sectors.
Morningstar Category Definitions
Intermediate-government portfolios have at least 90% of their bond holdings in bonds backed by the U.S. government or by government-linked agencies. This backing minimizes the credit risk of these portfolios, as the U.S. government is unlikely to default on its debt. These portfolios have durations typically between 3.5 and 6.0 years. Consequently, the group's performance—and its level of volatility—tends to fall between that of the short government and long government bond categories.
Long-term bond portfolios invest primarily in corporate and other investment-grade U.S. fixed-income issues and typically have durations of more than 6.0 years. Because of their long durations, these portfolios are exposed to greater interest-rate risk.
Long-government portfolios have at least 90% of their bond holdings invested in bonds backed by the U.S. government or by government-linked agencies. This backing minimizes the credit risk of these portfolios, as the U.S. government is unlikely to default on its debt. They are not risk-free, though. Because these portfolios have durations of typically more than 6.0 years, they are more sensitive to interest rates, and thus riskier, than portfolios that have shorter durations.
Intermediate-term bond portfolios invest primarily in corporate and other investment-grade U.S. fixed-income issues and typically have durations of 3.5 to 6.0 years. These portfolios are less sensitive to interest rates, and therefore less volatile, than portfolios that have longer durations.
Corporate Bond portfolios concentrate on bonds issued by corporations. These tend to have more credit risk than government or agency-backed bonds. These portfolios hold more than 65% of their assets in corporate bonds, hold less than 40% of their assets in foreign bonds, less than 35% in high yield bonds, and have an effective duration of more than 75% of the Morningstar Core Bond Index.
Definitions
Beta is a historic measure of a fund’s relative volatility, which is one of the measures of risk; a beta of 0.5 reflects 1/2 the market’s volatility as represented by the Fund’s primary benchmark, while a beta of 2.0 reflects twice the volatility.
Average Maturity is computed by weighting the maturity of each security in the portfolio by the market value of the security, then averaging these weighted figures.
Average effective duration provides a measure of a fund’s interest-rate sensitivity. The longer a fund’s duration, the more sensitive the fund is to shifts in interest rates. The relationship among funds with different durations is straightforward: A fund with duration of 10 years is expected to be twice as volatile as a fund with a five-year duration.
Standard deviation measures the overall risk of a fund.
NOT FDIC INSURED | MAY LOSE VALUE | NO BANK GUARANTEE
801055 0318

