First published: December 14, 2016
Financial advisors generally like to see an alternative fund with a strong long-term performance record, suggesting resiliency over multiple market cycles. This is especially true in the long/short equity fund category where 63% of funds are younger than five years old and just 13% of funds are older than 10 years old.
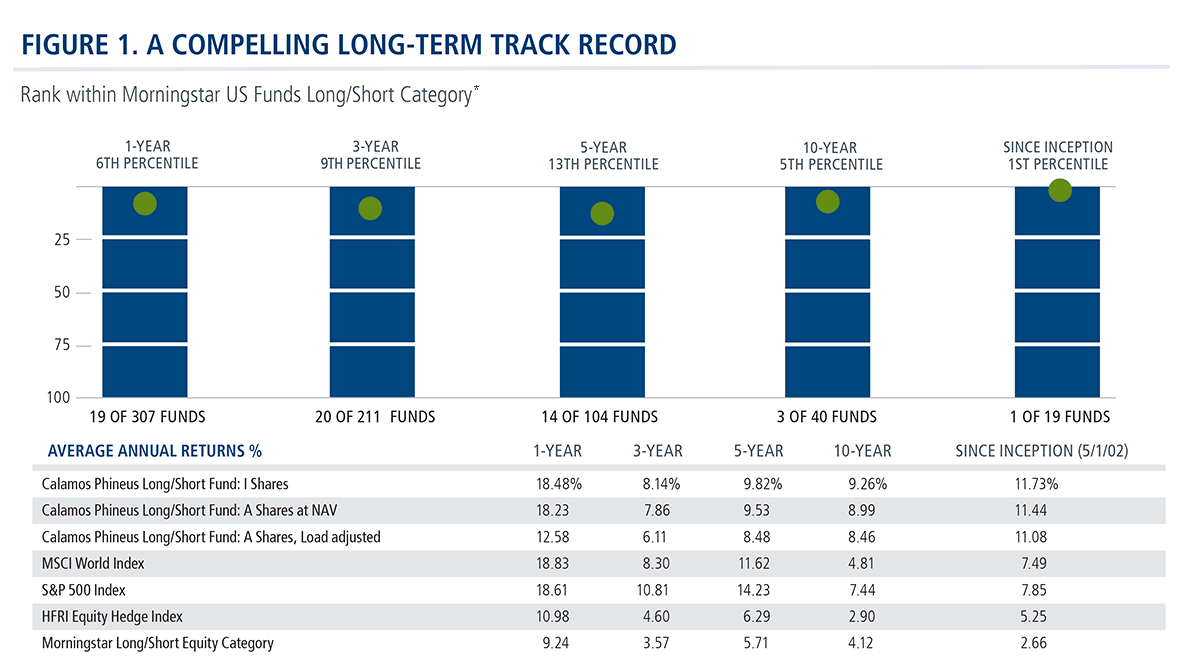
But every once in a while, an advisor will challenge us on the results of our 15-year-old Calamos Phineus Long/Short Fund (CPLIX), the eighth oldest in the long/short equity category. As you’ll see below, CPLIX has outperformed the Morningstar U.S. Funds Long/Short Category, the MSCI World Index and the S&P 500 Index since inception on May 1, 2002.
To what extent, advisors sometimes ask, was this performance lifted by a few concentrated periods?
Diversification does not guarantee a profit or protection against losses.
Data as of 9/30/17. Performance data quoted represents past performance, which is no guarantee of future results. Current performance may be lower or higher than the performance quoted. The principal value and return of an investment will fluctuate so that your shares, when redeemed, may be worth more or less than their original cost. Performance reflected at NAV does not include the Fund's maximum front-end sales load of 4.75%. Had it been included, the Fund's return would have been lower. For the most recent month-end fund performance information visit www.calamos.com.
*The percentile and category rankings illustrated are created by Calamos Financial Services, LLC. The percentile rank measures the Fund's total return among the Morningstar U.S. Fund Long/Short category as of 4/6/16. This is the fund's total-return percentile rank relative to all funds that have the same category for the same time period.
The gross expense ratios for Class A and Class I shares are 4.29% and 4.29% respectively, as the prospectus dated 2/28/17. The Fund's investment advisor has contractually agreed to reimburse Fund expenses through 3/1/19, to the extent necessary so that Total Annual Fund Operating Expenses (excluding taxes, interest, short interest, short dividend expenses, brokerage commissions, acquired fund fees and expenses, and extraordinary or non-routine expenses, if any) of Class A, Class C and Class I shares are limited to 2.00%, 2.75%, and 1.75% of average net assets, respectively. The investor will pay the Net Expense Ratio.
The performance shown for periods prior to 4/6/16 is the performance of a predecessor investment vehicle (the "Predecessor Fund"). The Predecessor Fund was reorganized into the Fund on 4/6/16, the date upon which the Fund commenced operations. On 10/1/15 the parent company of Calamos Advisors, Purchased Phineus Partners LP, the prior investment adviser to the Predecessor Fund ("Phineus") and Calamos Advisors served as the Predecessor Fund using investment policies, objectives, guidelines and restrictions that were in all material respects equivalent to those of the Fund. Phineus and Calamos Advisors managed the Predecessor Fund in this manner either directly or indirectly by investing all of the Predecessor Fund's assets in a master fund structure. The Predecessor Fund performance information has been adjusted to reflect Class A and I shares expenses. However, the Predecessor Fund was not a registered mutual fund and thus was not subject to the same investment and tax restrictions as the Fund. If it had been, the Predecessor Fund's performance may have been lower.
Our answer: Let’s look at the same performance but separate it into five distinct three-year periods. Each period illustrates the annualized returns and risk-adjusted metrics. This chart shows what clients experienced and how that experience compared to the fund’s peers, the S&P 500 Index and the MSCI World Index.
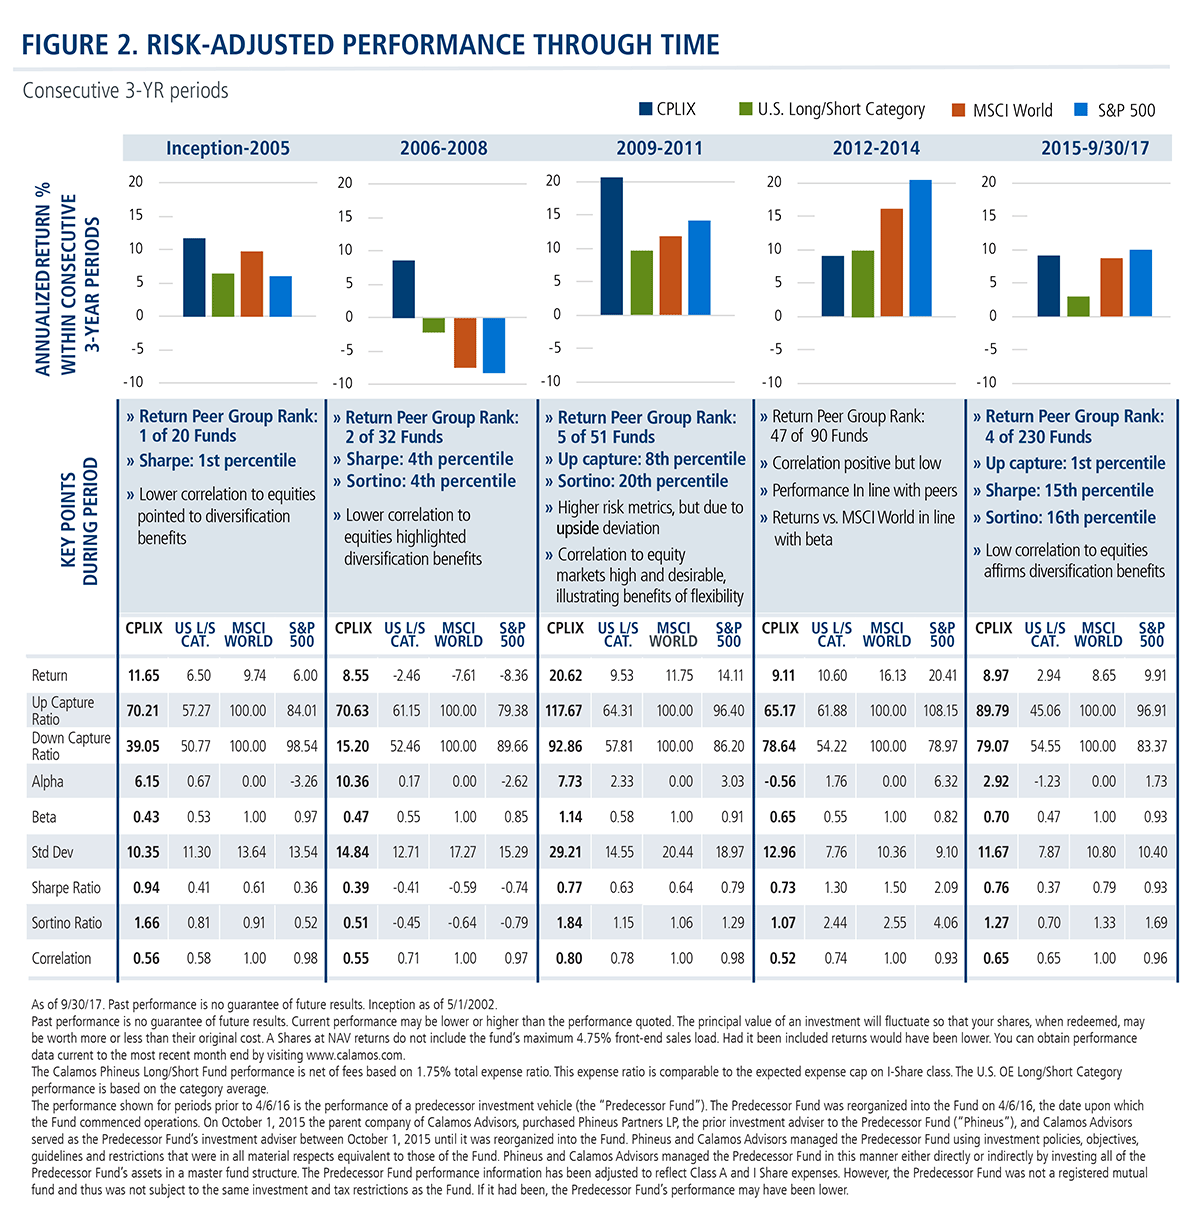
This presentation provides insight into both the advantage of the flexibility of the unconstrained fund and the Global Long/Short Team’s management of different factors, says Senior Vice President, Senior Co-Portfolio Manager Michael Grant.
"For example," he says, "If we were simply doing 'one thing' such as adhering to a growth bias or a value bias or an emerging market bias or a market neutral bias—the outcomes between periods would have been more varied. Instead, we succeeded in understanding the differing risk regime through time as well as the implications for equities."
Eyes on the Top Quartile
Grant and team are not managing the fund to appear in the top decile of their category in any given year.
"The problem with aiming for the top decile is that it carries the risk of finding ourselves in the bottom decile," Michael says. "We prefer to moderate the assumption of risk, even if it caps some upside opportunity, but hope to nudge our way into the top quartile."
"Success is as much about avoiding the really dumb moves from which it can be impossible to recover," says Grant. CPLIX has been consistently near the top quartile on any of these metrics, and as a result the fund has historically made its way to the top decile in the three-year view, without much of the risk that comes with aiming for the top decile in a particular year. Similarly, the fund approached the top of these metrics over consecutive calendar years, which allowed CPLIX to be the top ranked fund in its category since inception (5/1/2002).
For more information, please talk to your Calamos Investment Consultant at 888-571-2567 or caminfo@calamos.com.
Before investing, carefully consider the fund’s investment objectives, risks, charges and expenses. Please see the prospectus and summary prospectus containing this and other information which can be obtained by calling 1-866-363-9219. Read it carefully before investing.
Performance data quoted represents past performance, which is no guarantee of future results. Current performance may be lower or higher than the performance quoted. The principal value and return of an investment will fluctuate so that your shares, when redeemed, may be worth more or less than their original cost. Performance reflected at NAV does not include the Fund’s maximum front-end sales load of 4.75%. Had it been included; the Fund’s return would have been lower. For the most recent month-end fund performance information visit www.Calamos.com.
Class I shares are offered primarily for direct investment by investors through certain tax-exempt retirement plans (including 401(k) plans, 457 plans, employer-sponsored 403(b) plans, profit sharing and money purchase pension plans, defined benefit plans and non-qualified deferred compensation plans) and by institutional clients, provided such plans or clients have assets of at least $1 million. Class I shares may also be offered to certain other entities or programs, including, but not limited to, investment companies, under certain circumstances.
Alternative investments may not be suitable for all investors, and the risks of alternative investments vary based on the underlying strategies used. Many alternative investments are highly illiquid, meaning that you may not be able to sell your investment when you wish to.
Unmanaged index returns assume reinvestment of any and all distributions and do not reflect any fees, expenses, or sales charges. Investors cannot invest directly in an index.
S&P 500 Index is a market weighted index and is widely regarded as the standard for measuring U.S. stock market performance.
MSCI World Index is a market capitalization weighted index composed of companies representative of the market structure of 21 developed market countries in North America, Europe, and the Asia/Pacific region. The MSCI World Index consists of the following 23 developed market country indexes: Australia, Austria, Belgium, Canada, Denmark, Finland, France, Germany, Hong Kong, Ireland, Israel, Italy, Japan, Netherlands, New Zealand, Norway, Portugal, Singapore, Spain, Sweden, Switzerland, the United Kingdom, and the United States.
Morningstar U.S. Funds Long/Short Category: Long-short portfolios hold sizable stakes in both long and short positions in equities and related derivatives. Some funds that fall into this category will shift their exposure to long and short positions depending on their macro outlook or the opportunities they uncover through bottom-up research. Some funds may simply hedge long stock positions through exchange-traded funds or derivatives. At least 75% of the assets are in equity securities or derivatives.
The principal risks of investing in the Calamos Phineus Long/Short Fund include: equity securities risk consisting of market prices declining in general, short sale risk consisting of potential for unlimited losses, foreign securities risk, currency risk, geographic concentration risk, other investment companies (including ETFs) risk, derivatives risk, options risk, and leverage risk.
The principal risks of investing in the Market Neutral Income Fund include: equity securities risk consisting of market prices declining in general, convertible securities risk consisting of the potential for a decline in value during periods of rising interest rates and the risk of the borrower to miss payments, synthetic convertible instruments risk, convertible hedging risk, covered call writing risk, options risk, short sale risk, interest rate risk, credit risk, high yield risk, liquidity risk, portfolio selection risk, and portfolio turnover risk.
Alpha is a historical measure of risk-adjusted performance. Alpha measures how much of a portfolio’s performance is attributable to investment-specific factors versus broad market trends. A positive alpha suggests that the performance of a portfolio was higher than expected given the level of risk in the portfolio. A negative alpha suggests that the performance was less than expected given the risk.
Beta is a common measure of historic volatility, beta measures how much of an investment’s performance is attributable to market-wide factors (such as a rising stock market). An investment that goes up or down as much as a broad market measure has a beta of 1. An investment that captures only half of the market’s movements would have a beta of 0.5.
Sharpe ratio is a measure of risk-adjusted performance, where higher values are indicative of better investment decisions rather than the result of taking on a higher level of risk. Sharpe ratio is calculated by the difference between a portfolio’s return and a risk-free rate, often that of the 10-year Treasury bond, and dividing the result by the portfolio’s standard deviation.
Standard Deviation is a statistical measure of the volatility of a mutual fund that is used to measure the overall risk of a fund.
Sortino ratio is the excess return over the risk-free rate divided by the downside semi-variance, and so it measures the return to "bad" volatility. (Volatility caused by negative returns is considered bad or undesirable by an investor, while volatility caused by positive returns is good or acceptable.)
Upside/downside capture ratios show you whether a given fund has outperformed--gained more or lost less than--a broad market benchmark during periods of market strength and weakness, and if so, by how much.
Upside capture is calculated by taking the fund's monthly return during months when the benchmark had a positive return and dividing it by the benchmark return during that same month.
Downside capture is calculated by taking the fund's monthly return during the periods of negative benchmark performance and dividing it by the benchmark return.
An investment in the Fund(s) is subject to risks, and you could lose money on your investment in the Fund(s). There can be no assurance that the Fund(s) will achieve its investment objective. Your investment in the Fund(s) is not a deposit in a bank and is not insured or guaranteed by the Federal Deposit Insurance Corporation (FDIC) or any other government agency. The risks associated with an investment in the Fund(s) can increase during times of significant market volatility. The Fund(s) also has specific principal risks, which are described below. More detailed information regarding these risks can be found in the Fund’s prospectus.