Clients Looking for an Early Exit? Consider CGCIX for Extra Long Retirements
August 30, 2022
First published: May 6, 2021
If you’re like other investment professionals we talk to, your retirement conversations cover the gamut. While a growing number of baby boomers are heading back to work—some by choice and some to shore up their finances adversely affected by inflation or investment losses—there are still plenty of people eager to accelerate their retirement date post-pandemic.
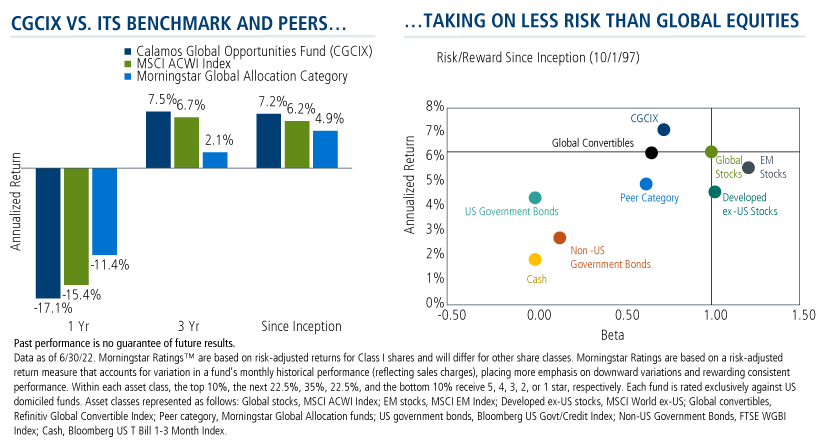
Here’s a fresh idea for these clients whose relative young age at retirement will mean they’ll need a considerable cushion: Calamos Global Opportunities Fund (CGCIX). Investing in a diversified portfolio of global equity and convertible securities, CGCIX provides a core holding option that aims to maintain a consistent risk posture throughout the market cycle. The goal: to participate in the upside movements of the global equity market while lessening the damage of down periods.
Let’s look at a hypothetical example of how the fund would have provided consistent growth and income if your client had invested $500,000 at the fund’s I Shares inception in September 1997, and held that investment through June 30, 2022, making an annual withdrawal of $20,000 in December of each year starting in 1997.
The investment made in 1997 was more than capable of funding the retirement income needs for 24 years, and there would have been $1.56 million left in the fund by June 30, 2022. An MSCI ACWI index-based fund also would have completed the period with money remaining, although $505,000 less.
But look at the client’s experience during the period. CGCIX dropped below the invested balance just once, after the first withdrawal in year 2 and never looked back.
However, early on in the period, the balance of the index-based investment suffered a decline and needed three years to climb back to $500,000. It makes a return trip below $500,000 again in 2008, and again needed more time to recover. Clients who retired early to avoid more work drama are likely not signing up for investment drama, and your selection of CGCIX has the potential to help with that.
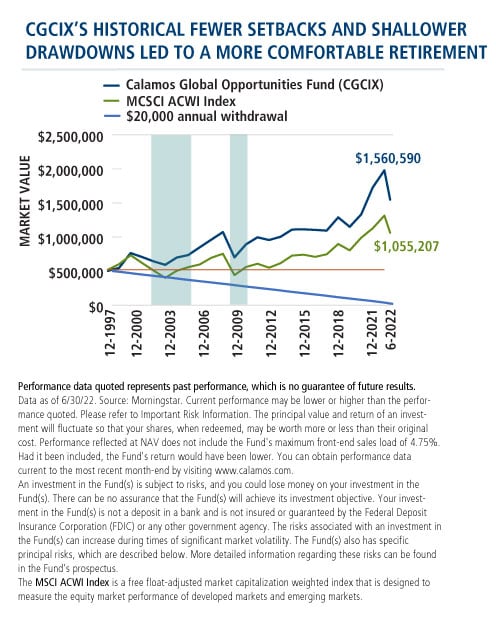
Withdrawal Example: Calamos Global Opportunities Fund vs. MSCI ACWI Index
$500,000 INITIAL INVESTMENT, $20,000 END-OF-YEAR WITHDRAWALS
TOTAL INVESTMENT: $500,000
TOTAL WITHDRAWALS: $500,000
CALAMOS GLOBAL OPPORTUNITIES FUND ENDING VALUE: $1,560,590
MSCI ACWI INDEX ENDING VALUE: $1,055,207
| Date | Initial Investment at Inception 9-18-97 | End-of-year Withdrawals | Calamos Global Opportunities Fund (CGCIX) Value | MSCI ACWI Value |
|---|---|---|---|---|
| December-1997 | $0 | $20,000 | $470,898 | $489,485 |
| December-1998 | $470,898 | $20,000 | $519,317 | $577,005 |
| December-1999 | $519,317 | $20,000 | $745,231 | $711,736 |
| December-2000 | $745,231 | $20,000 | $683,493 | $592,547 |
| December-2001 | $683,493 | $20,000 | $617,085 | $478,259 |
| December-2002 | $617,085 | $20,000 | $564,805 | $367,494 |
| December-2003 | $564,805 | $20,000 | $675,689 | $474,774 |
| December-2004 | $675,689 | $20,000 | $715,191 | $529,571 |
| December-2005 | $715,191 | $20,000 | $834,688 | $569,802 |
| December-2006 | $834,688 | $20,000 | $949,915 | $672,473 |
| December-2007 | $949,915 | $20,000 | $1,065,503 | $734,413 |
| December-2008 | $1,065,503 | $20,000 | $679,033 | $407,094 |
| December-2009 | $679,033 | $20,000 | $876,767 | $531,236 |
| December-2010 | $876,767 | $20,000 | $986,521 | $581,427 |
| December-2011 | $986,521 | $20,000 | $944,204 | $521,523 |
| December-2012 | $944,204 | $20,000 | $993,423 | $589,147 |
| December-2013 | $993,423 | $20,000 | $1,104,471 | $707,242 |
| December-2014 | $1,104,471 | $20,000 | $1,107,319 | $720,522 |
| December-2015 | $1,107,319 | $20,000 | $1,098,584 | $687,263 |
| December-2016 | $1,098,584 | $20,000 | $1,088,134 | $725,577 |
| December-2017 | $1,088,134 | $20,000 | $1,289,420 | $884,245 |
| December-2018 | $1,289,420 | $20,000 | $1,146,996 | $785,289 |
| December-2019 | $1,146,996 | $20,000 | $1,337,975 | $979,645 |
| December-2020 | $1,337,975 | $20,000 | $1,748,881 | $1,124,460 |
| December-2021 | $1,748,881 | $20,000 | $2,008,775 | $1,318,518 |
| June-2022 | $2,008,775 | $0 | $1,560,590 | $1,055,207 |
Source: Morningstar Past performance does not guarantee future results. Growth of hypothetical $500,000 assumes reinvestment of dividends and annual $20,000 withdrawals, as stated in each table’s title, at the end of December each year. These illustrations should be read along with the average annual total returns for the 1-, 5- and 10-year periods below. MSCI ACWI Index: Unmanaged index returns assume reinvestment of any and all distributions and, unlike fund returns, do not reflect fees, expenses or sales charges. Investors cannot invest directly in an index.
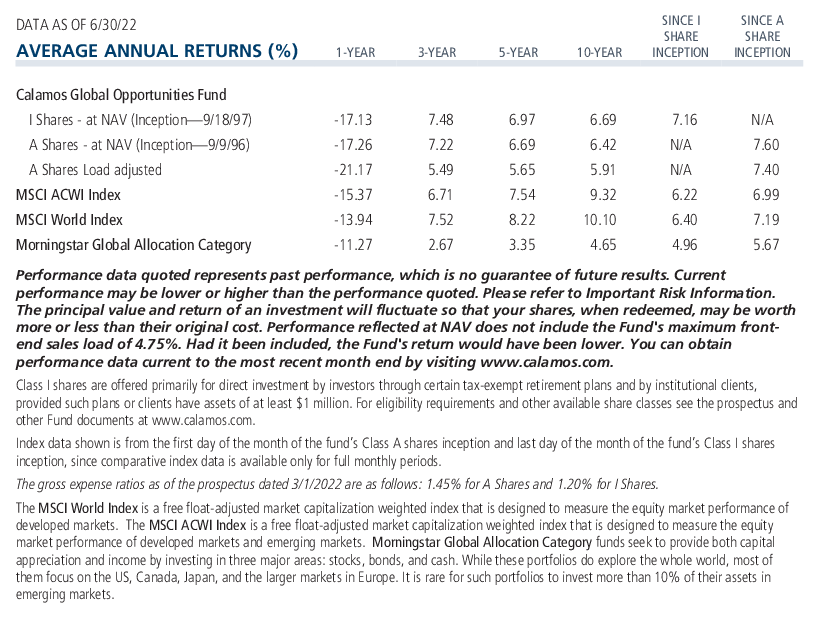
Calamos Global Opportunities Fund (CGCIX)
Morningstar Overall RatingTM Among 338 Global Allocation funds. The Fund's risk-adjusted returns based on load-waived Class I Shares had 4 stars for 3 years, 5 stars for 5 years and 5 stars for 10 years out of 338, 320 and 240 Global Allocation Funds, respectively, for the period ended 6/30/2024.
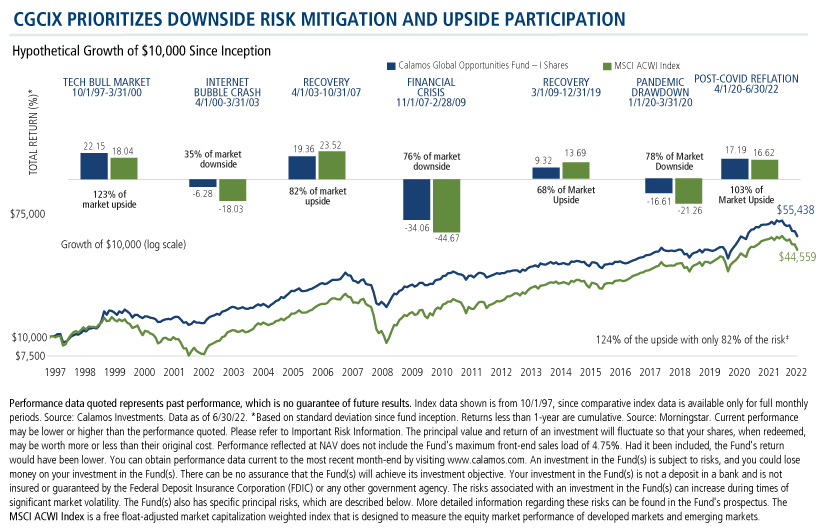
Shareholders in CGCIX potentially benefit from the fund’s flexibility to invest in a variety of securities to capture opportunity and manage risk. Since its inception and through 6/30/22, the fund has captured 124% of the upside with just 82% of the risk (based on standard deviation). It’s a portfolio designed to achieve optimal risk-return asymmetry.
Investment professionals, for more information on CGCIX, contact your Calamos Investment Consultant at 800-582-6959 or caminfo@calamos.com.
Before investing, carefully consider the fund’s investment objectives, risks, charges and expenses. Please see the prospectus and summary prospectus containing this and other information which can be obtained by calling 1-866-363-9219. Read it carefully before investing.
The principal risks of investing in the Calamos Global Opportunities Fund include: convertible securities risk consisting of the potential for a decline in value during periods of rising interest rates and the risk of the borrower to miss payments, synthetic convertible instruments risk consisting of fluctuations inconsistent with a convertible security and the risk of components expiring worthless, foreign securities risk, emerging markets risk, equity securities risk, growth stock risk, interest rate risk, credit risk, high yield risk, forward foreign currency contract risk, portfolio selection risk, and liquidity risk. As a result of political or economic instability in foreign countries, there can be special risks associated with investing in foreign securities, including fluctuations in currency exchange rates, increased price volatility and difficulty obtaining information. In addition, emerging markets may present additional risk due to potential for greater economic and political instability in less developed countries.
The MSCI ACWI Index is a free float-adjusted market capitalization weighted index that is designed to measure the equity market performance of developed markets and emerging markets.
MSCI Emerging Markets Index is a free float adjusted market capitalization index. It includes market indexes of Brazil, Chile, China, Colombia, Czech Republic, Egypt, Hungary, India, Indonesia, Israel, Korea, Malaysia, Mexico, Morocco, Peru, Philippines, Poland, Russia, South Africa, Taiwan, Thailand, and Turkey.
The MSCI World ex USA Index captures large and mid cap representation across 22 of 23 Developed Markets (DM) countries*-- excluding the United States. With 985 constituents, the index covers approximately 85% of the free float-adjusted market capitalization in each country.
The Bloomberg Capital US Government/Credit Bond Index is composed of long-term government and investment-grade corporate debt securities and is generally considered representative of the performance of the broad US bond market.
FTSE World Government Bond Index (WGBI) is a broad index providing exposure to the global sovereign fixed income market, the index measures the performance of fixed-rate, local currency, investment-grade sovereign bonds. It comprises sovereign debt from over 20 countries, denominated in a variety of currencies.
The Bloomberg 1-3 Month US Treasury Bill Index is designed to measure the performance of public obligations of the US Treasury that have a remaining maturity of greater than or equal to 1 month and less than 3 months.
Morningstar Global Allocation Category funds seek to provide both capital appreciation and income by investing in three major areas: stocks, bonds, and cash. While these portfolios do explore the whole world, most of them focus on the US, Canada, Japan, and the larger markets in Europe. It is rare for such portfolios to invest more than 10% of their assets in emerging markets.
Morningstar RatingsTM are based on risk-adjusted returns and are through 7/31/22 for Class I shares and will differ for other share classes. Morningstar ratings are based on a risk-adjusted return measure that accounts for variation in a fund's monthly historical performance (reflecting sales charges), placing more emphasis on downward variations and rewarding consistent performance. Within each asset class, the top 10%, the next 22.5%, 35%, 22.5%, and the bottom 10% receive 5, 4, 3, 2 or 1 star, respectively. Each fund is rated exclusively against US domiciled funds. The information contained herein is proprietary to Morningstar and/or its content providers; may not be copied or distributed; and is not warranted to be accurate, complete or timely. Neither Morningstar nor its content providers are responsible for any damages or losses arising from any use of this information. Source: ©2022 Morningstar, Inc.
802385 0822
Archived material may contain dated performance, risk and other information. Current performance may be lower or higher than the performance quoted in the archived material. For the most recent month-end fund performance information visit www.calamos.com. Archived material may contain dated opinions and estimates based on our judgment and are subject to change without notice, as are statements of financial market trends, which are based on current market conditions at the time of publishing. We believed the information provided here was reliable, but do not warrant its accuracy or completeness. This material is not intended as an offer or solicitation for the purchase or sale of any financial instrument. The views and strategies described may not be suitable for all investors. This material has been prepared for informational purposes only, and is not intended to provide, and should not be relied on for, accounting, legal or tax advice. References to future returns are not promises or even estimates of actual returns a client portfolio may achieve. Any forecasts contained herein are for illustrative purposes only and are not to be relied upon as advice or interpreted as a recommendation.
Performance data quoted represents past performance, which is no guarantee of future results. Current performance may be lower or higher than the performance quoted. The principal value and return of an investment will fluctuate so that your shares, when redeemed, may be worth more or less than their original cost. Performance reflected at NAV does not include the Fund’s maximum front-end sales load. Had it been included, the Fund’s return would have been lower.
Archived on August 30, 2023